the Creative Commons Attribution 4.0 License.
the Creative Commons Attribution 4.0 License.
 | 23 Nov 2022
Exploring TikTok as a promising platform for geoscience communication
Emily E. Zawacki
Wendy Bohon
Scott Johnson
Donna J. Charlevoix
With TikTok emerging as one of the most popular social media platforms, there is significant potential for science communicators to capitalize on this success and to share their science with a broad, engaged audience. While videos of chemistry and physics experiments are prominent among educational science content on TikTok, videos related to the geosciences are comparatively lacking, as is an analysis of what types of geoscience videos perform well on TikTok. To increase the visibility of the geosciences and geophysics on TikTok and to determine best strategies for geoscience communication on the app, we created a TikTok account called “Terra Explore” (@TerraExplore). The Terra Explore account is a joint effort between science communication specialists at UNAVCO, IRIS (Incorporated Research Institutions for Seismology), and OpenTopography. We produced 48 educational geoscience videos over a 4-month period between October 2021 and February 2022. We evaluated the performance of each video based on its reach, engagement, and average view duration to determine the qualities of a successful video. Our video topics primarily focused on seismology, earthquakes, topography, lidar (light detection and ranging), and GPS (Global Positioning System), in alignment with our organizational missions. Over this time period, our videos garnered over 2 million total views, and our account gained over 12 000 followers. The videos that received the most views received nearly all (∼ 97 %) of their views from the For You page, TikTok's algorithmic recommendation feed. We found that short videos (< 30 s) had a high average view duration, but longer videos (> 60 s) had the highest engagement rates. Lecture-style videos that were approximately 60 s in length had more success in both reach and engagement. Our videos that received the highest number of views featured content that was related to a recent newsworthy event (e.g., an earthquake) or that explained location-based geology of a recognizable area. Our results highlight the algorithm-driven nature of TikTok, which results in a low barrier to entry and success for new science communication creators.
- Article
(3158 KB) - Full-text XML
-
Supplement
(704 KB) - BibTeX
- EndNote


Given the current popularity and ubiquity of various social media platforms, scientists have a unique opportunity to directly interface with a diverse public audience. Not only can scientists use social media to improve the public perception of science, but they can also work to combat the growing tide of scientific misunderstanding and misinformation (Hilary and Dumebi, 2021; Shu et al., 2020). Over the last decade, scientists have found success using social media, especially Twitter, to share scientific discoveries (Côté and Darling, 2018; Schmitt and Jäschke, 2017; Smith, 2015) and to affect social change (Jahng and Lee, 2018). However, the social media landscape is frequently changing, and scientists must adapt to new changes and trends to effectively reach an audience.
Over the past two years, TikTok has dominated the social media landscape and currently boasts over 1 billion monthly active users (TikTok, 2021a). On TikTok, users create and interact with short-form video content (∼ 15 s to 3 min). TikTok is especially popular among a younger demographic, with 25 % of users in the US being under the age of 19 (Statista Research Department, 2022a). With the growing popularity of TikTok among users of all ages, TikTok presents an excellent opportunity to strategically examine how scientists can use social media to broaden their reach and to create a more scientifically literate public. On TikTok, science communication is highly personalized, as science practitioners are presented in an approachable and relatable way (Zeng et al., 2020).
Of the STEM (science, technology, engineering, and mathematics) disciplines, the geosciences are especially relatable; essentially, everyone has personal experience with geoscience-related information in their daily lives. Effective communication of geoscience topics is important, because the geosciences are intrinsically linked to the human and natural world, and it is beneficial for everyone in society to understand the basics of geoscience. Increased awareness and understanding of geohazards like earthquakes, landslides, floods, and global climate change can help to improve personal safety and to increase support for public policy. Additionally, geohazards are often the subject of considerable misinformation – persistent rumors that Yellowstone is about to catastrophically erupt serves as a frequent example – so providing high-quality, scientifically accurate information is especially important.
Recognizing the substantial potential for geoscience communication on TikTok, we created a TikTok account called “Terra Explore” (@TerraExplore) to share educational geoscience and geophysics videos. With these videos, we sought to not only enhance the visibility of geoscience and geophysics on TikTok but also to assess the best strategies for science communication on the platform and to evaluate what factors may impact how well a video performs on the app. We analyzed the reach (how many individuals saw the video), the engagement (the number of interactions with the content, e.g., “likes” or “comments”), and the average view duration of each video we posted to determine the qualities of a successful educational geoscience TikTok video. The longer that someone watches a video and the more engagement the video receives demonstrates interest in the video and the impact of the science communication, which will likely be rewarded within the algorithm with expanded video reach. Through this work, we are able to determine the factors of a video that help to maximize the reach and potential for geoscience communication on TikTok.
TikTok is a short-form video app that allows users to create videos using music, filters, text, and camera effects on their mobile phones. The app is free to download on Apple and Google Play stores. While TikTok videos were originally all less than a minute long, TikTok increased the upper limit to 3 min during the late summer of 2021 (Kirchhoff, 2021). There is now also the limited ability to upload a single 10 min video file from your device to TikTok. The COVID-19 global pandemic served as a catalyst for the growth and success of TikTok among different demographics (Feldkamp, 2021). During the first quarter of 2020, TikTok had more than 315 million installs across the Apple and Google Play app stores, which was the most downloads ever for an app in a single quarter (Briskman, 2020). This was a significant increase from the 219 million installs during the fourth quarter of 2019 (Statista Research Department, 2022b). During the first quarter of 2022, TikTok was the most downloaded app worldwide (Sensor Tower, 2022).
TikTok provides two primary feeds on which a user can watch content: Following and For You. Upon opening the app, videos immediately begin playing on the For You page. Users can toggle between the two feeds at the top of the screen. TikTok uses AI algorithmic recommendations to determine what videos are shown on a user's For You page – these videos are often based on the user's profile settings, their location, and their activity on the app (Smith, 2021). In order to help users discover new content categories and creators as well as to avoid a repetitive experience, TikTok also provides diverse recommendations on the For You page (TikTok, 2020). The For You page is notable and unique amongst social media feeds, as videos with extremely few views (∼ 10 views) can be recommended, thus guaranteeing a potential audience for every post regardless of the number of account followers. Based on TikTok's internal data, 69 % of a user's time on the app is spent on the For You page (Stokel-Walker, 2020), making it the primary way users view and discover new content. Only videos from accounts that someone follows are shown on the Following feed, although these videos may also be shown on the For You page. Additionally, videos can be viewed on a creator's profile page or by searching video hashtags or sounds. While TikTok does not publicly disclose any information regarding how their AI recommendation algorithm functions, independent data analysis of trending videos on TikTok found that a higher level of video engagement through likes, comments, and shares leads to a higher chance of the algorithm showing the video to more people via the For You page (Klug et al., 2021).
Despite the common perception that TikTok is a “dance app” for kids, there is an abundance of educational content on the app that is widely consumed. Research shows that youths agree that TikTok serves as a window for online learning and aids in educational development (Azman et al., 2021). This positive educational potential led TikTok to be integrated into various aspects of instruction in higher education (Draganić et al., 2021; Escamilla-Fajardo et al., 2021; Radin and Light, 2022). In addition, studies show that TikTok allows non-expert users to participate in scientific discussions – such as those related to climate change – that oftentimes only take place among expert-level scientists and journalists (Basch et al., 2022; Hautea et al., 2021).
The TikTok leadership has also worked to strengthen and promote educational content on the app. In May of 2020, TikTok launched their “#LearnOnTikTok” campaign, where they partnered with 800 public figures, educational institutions, and professional experts to bring learning material to TikTok (Thoensen, 2020). These partnerships included notable science communicators such as Bill Nye and Neil deGrasse Tyson. While the campaign partnered with specific creators, anyone on TikTok can create videos and use the #LearnOnTikTok hashtag. As of February 2022, videos using the “LearnOnTikTok” hashtag have a collective 240.4 billion views. The success of the #LearnOnTikTok campaign demonstrates the desire for consumption of educational material on the platform and provides an ideal opportunity for science communicators to capitalize on a platform with a large user base. By leveraging this already well-known and popular hashtag, geoscientists can promote their content to a receptive audience, potentially increasing knowledge of and interest in geoscience topics.
The manner in which science content is presented on TikTok – lecture style vs. demonstration – influences user engagement. Habibi and Salim (2021) evaluated the engagement of lecture-style and experimental educational science videos from one account on TikTok, largely related to biology, and found that scientific experiments presented in dynamic ways received the most engagement. Hayes et al. (2020) observed that TikTok videos of at-home chemistry experiments can increase knowledge of and interest in chemistry for viewers. In addition to videos showing chemistry experiments, Hight et al. (2021) found that students enjoyed creating and consuming content on TikTok that featured anthropomorphized chemistry concepts. Based on an analysis of memetic science content on TikTok, Zeng et al. (2020) found that the presence of science on TikTok is dominated by chemistry and physics experiments.
Thus far, the geosciences have been excluded from evaluations of science content and science communication on TikTok. Much of geoscience-related content on TikTok is created by young individuals who have recently or are currently completing undergraduate or graduate degrees in the geosciences. Videos typically feature geology-related “memes” or jokes, showing what's inside a rock when you break it open, or explanations of geoscience topics. Content related to geology and geophysics on TikTok has significantly fewer views than content related to physics, biology, and chemistry (Table 1). Unlike chemistry and physics, the geosciences do not as easily lend themselves to at-home experiment-based content, but the geosciences do allow for unique, hands-on demonstrations as well as the potential for “field trip”-style presentations. Additionally, geoscience is a discipline that every person has had some level of interaction with (soil, geohazards, GPS on their phone, etc.). Our aim was to not only enhance the visibility of geoscience and geophysics content on TikTok but also to determine and evaluate the best strategies for geoscience communication on TikTok.
Table 1Number of total video views on TikTok for different science-related hashtags as of October 2021, before our project began. Within the app, TikTok denotes the total number of video views per hashtag.

In October 2021, we created an account called “Terra Explore” to evaluate the potential of TikTok for geoscience communication (Fig. 1a). Between 8 October 2021 and 6 February 2022, we published 48 videos. The “Terra Explore” name is a nod to the many ways scientists explore Earth (Terra) using geoscience tools and techniques. The Terra Explore account is a joint effort led by science communication specialists from UNAVCO, IRIS (Incorporated Research Institutions for Seismology), and OpenTopography. UNAVCO and IRIS are non-profit, university-governed consortiums that operate the GAGE and SAGE facilities (respectively) on behalf of the National Science Foundation (NSF), serving the geophysics community. OpenTopography is co-managed by the San Diego Supercomputer Center at the University of California San Diego, UNAVCO, and Arizona State University and facilitates community access to high-resolution, Earth-science-oriented topography data and related tools and resources, also on behalf of NSF.
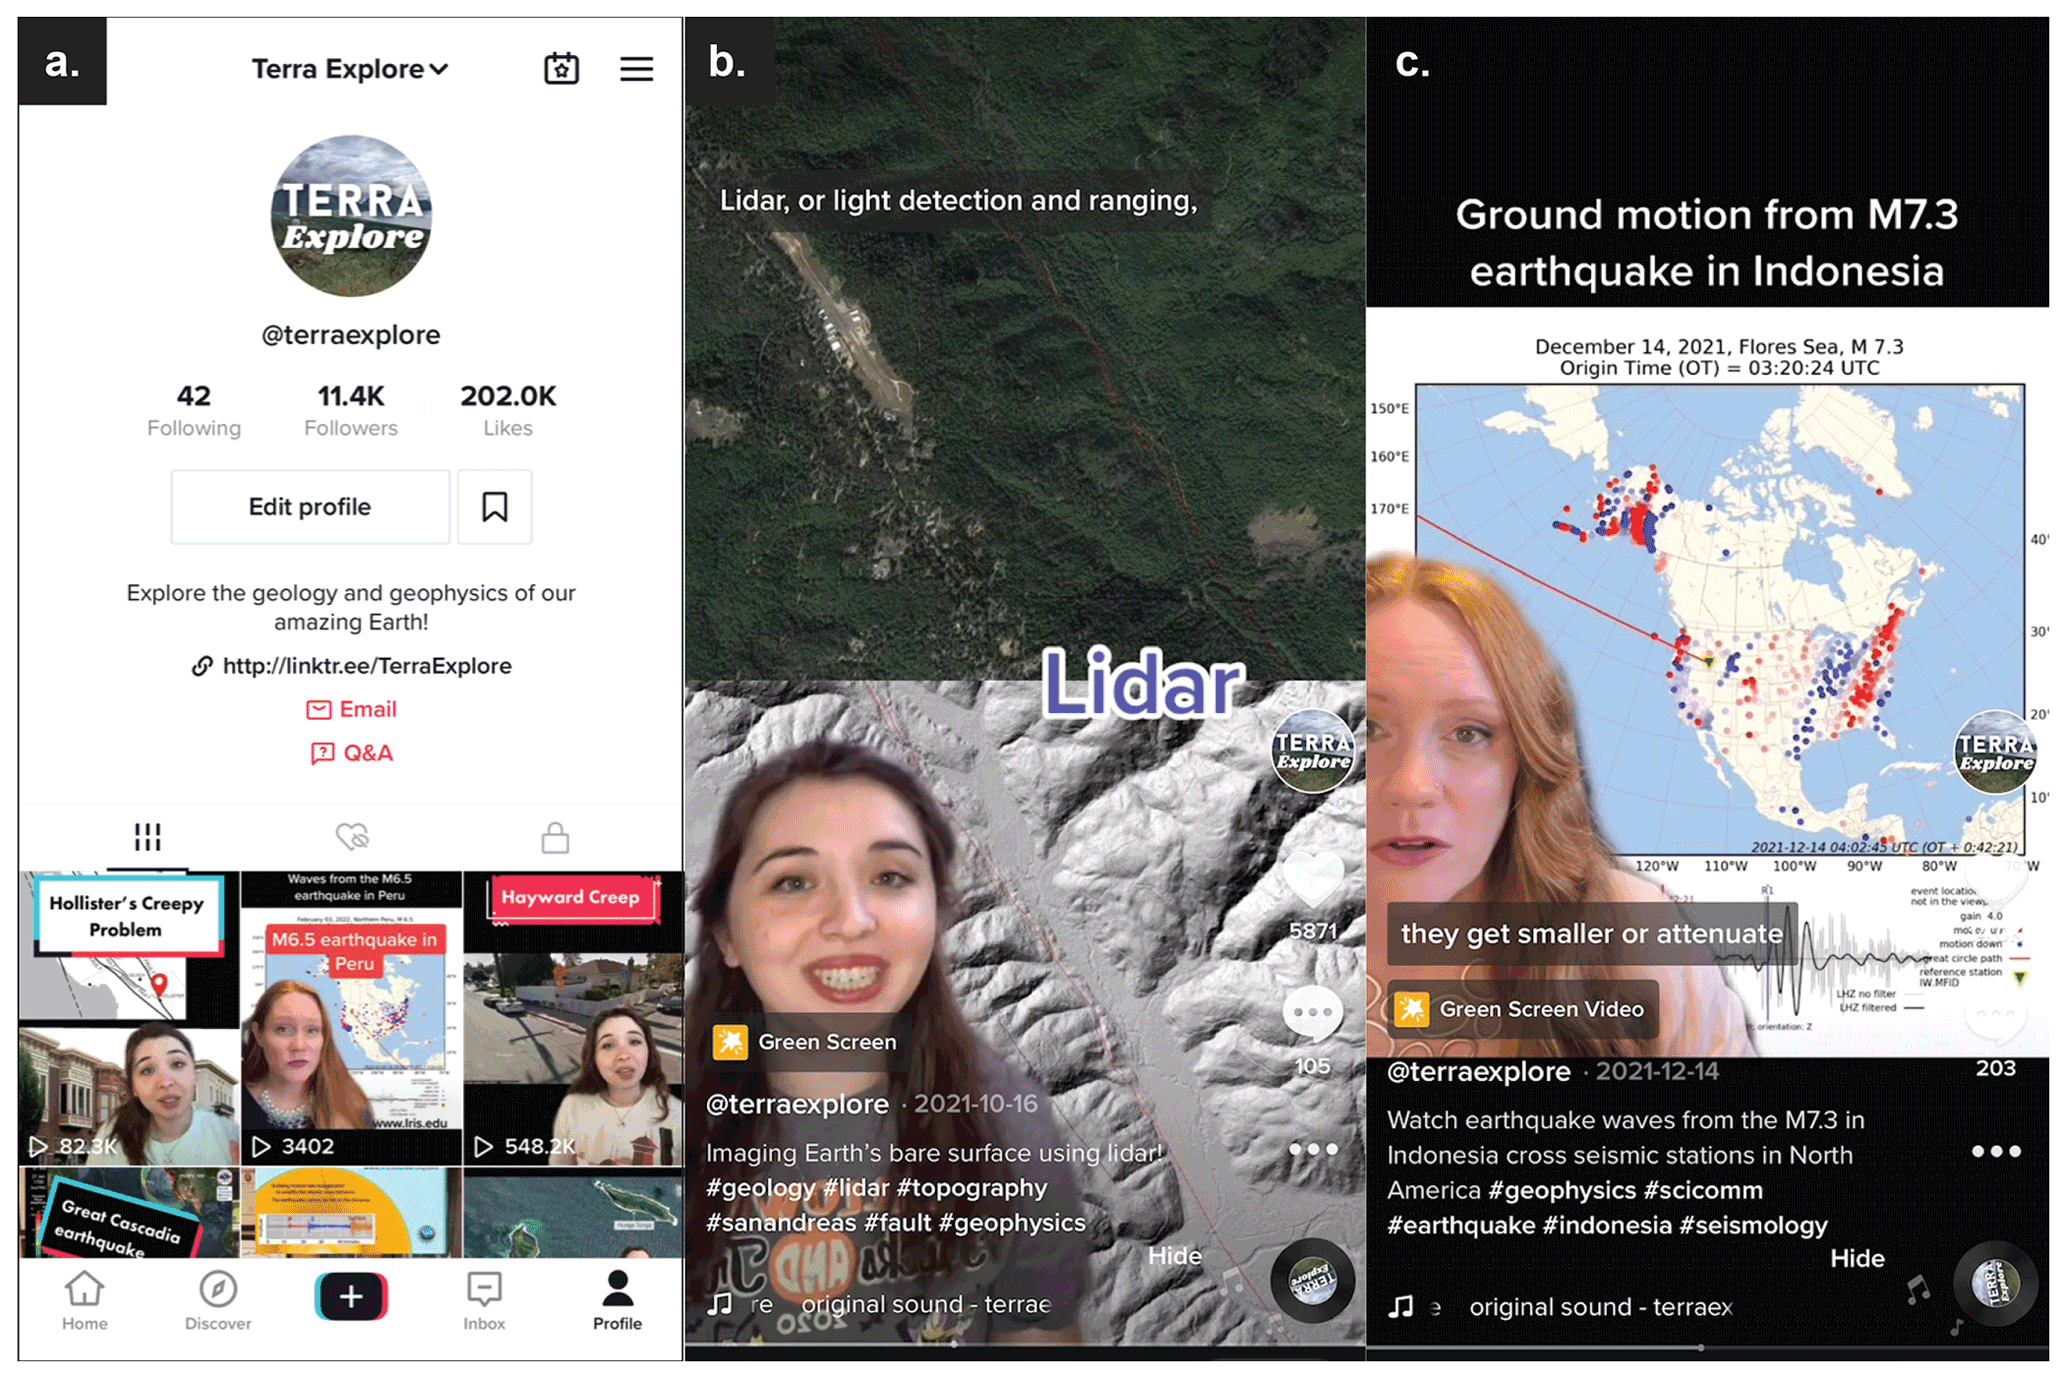
Figure 1(a) Representative screenshot of the Terra Explore account. Our profile page has a Linktree that provides external links to the UNAVCO, IRIS, and OpenTopography websites. (b) Screenshot of typical video using the “green screen” effect. (c) Example screenshot of a GMV video.
Our primary aim with the Terra Explore account was to determine the best strategies for geoscience communication on TikTok and to increase the presence of geoscience and geophysics content, ideally targeting users aged 19 and under as well as female users. Our videos featured three rotating, front-facing hosts and were typically done in a “lecture-style” format, where the host talks directly to the audience, explaining a geoscience topic while using engaging background visuals. Two of the hosts are female and presented the majority of the videos, and one is male. We primarily used TikTok's “green screen” feature, in addition to image and text overlays, to add visual imagery to videos (Fig. 1b). TikToks were filmed in individual home offices using simple equipment such as iPhone or Android devices, small lights, and low-cost lavalier microphones. We used TikTok's built-in captioning feature to provide captions on all of our videos to increase their accessibility.
We largely produced content related to our organizations' missions. Video topics primarily focused on seismology, earthquakes, topography, lidar (light detection and ranging), and GPS (Global Positioning System). We often used and incorporated existing educational graphics and animations produced by IRIS and UNAVCO. The videos we produced ranged between 9 s and 2 min 30 s in duration, with an average video duration of 57 s. Each video post contained a short description and approximately five relevant hashtags. Due to staff time limitations, we did not set a specific video posting schedule but averaged between one to four videos posted per week, with the most videos posted during the first 2 months of the project. A number of videos were cross-posted and promoted on UNAVCO, IRIS, and OpenTopography's other social media accounts.
Our video content largely did not include TikTok “memes” or sounds. “Memes” are among the most common videos on TikTok and use viral audio clips that are transformed and applied to different visual imagery, capitalizing on popular culture or shared experiences. Given the educational aspect of our videos, we chose to follow a more traditional video format, where the video host speaks directly to the audience as a teacher would to a classroom.
The most common type of video we produced presented ground motion visualizations (GMVs) for notable earthquakes of magnitude 6 or higher (Fig. 1c). These GMV animations were already being produced by IRIS and disseminated through other social media channels. On the Terra Explore TikTok, the front-facing video host explains what is shown in the animation: earthquake waves pass across seismic stations in North America, and we can see a representation of the ground moving up and down (although the movements are too small to feel). Videos were timely in that they were typically posted the day of or the day after the earthquake occurred. As the content and style of these GMV videos were largely identical, they provided a way to more clearly evaluate specific factors that may affect a video's performance.
We used TikTok's built-in account analytics to download and record video and account metrics for the period between 8 October 2021 and 6 February 2022 to evaluate the performance of each video and to analyze what factors may impact the success of a video. With our analyses, we largely sought to evaluate the features of geoscience content that users watch the most and engage with the most on TikTok as well as to establish what may impact the performance of a video within the algorithm. (Does the length of a video matter? The time of day it is posted at?) We began collecting data upon video publication and continued until the end of the reporting period, ensuring that there was a minimum of two weeks of available data per video. We found that videos typically received the majority of views and engagement within the first week after publication; thus, this timeframe is generally sufficient to observe video trends.
We collected all of the summary data for each individual video that TikTok provides: video views, likes, comments, shares, total cumulative play time, average duration the video was watched, percentage of viewers who watched the full video, unique reached audience, the percentage of video views by section (For You, personal profile, Following, hashtags), and the percentage of views by region or country. Prior to August 2022, TikTok did not provide information on the gender or the age of users who view a video; however, following that date, they now provide this information for videos created.
We evaluated the videos based on reach and engagement metrics as well as average video view duration. We used metrics of reach (number of unique users the video was seen by) and engagement (likes, comments, and shares) to calculate the engagement rate of each video. The engagement rate is calculated as the engagement parameter as a percentage of total reach (e.g., likes audience reached × 100). We hypothesize that the videos with the highest engagement rates and longest view durations will receive the highest views and reach (Klug et al., 2021). Longer view duration indicates greater interest in the video and subject, and engaging with the video through likes, comments, or shares demonstrates additional interest, indicating that the science communication was successful and impactful. This interest and engagement with the video is likely to be rewarded within the algorithm, with the video being shown to more people on the For You page.
We performed correlation analyses of variables related to views, engagement rate, and view duration to evaluate any trends in video performance. We calculated the Pearson correlation coefficient to determine the correlation between variables, and we calculated p values to determine the statistical significance of each relationship (p ≤ 0.05 is selected to indicate statistical significance). All individual plots and values from the correlation analyses are available in the Supplement.
We also recorded weekly account metrics, including total video views, profile views, total account likes, total comments, total shares, total followers, new followers, gender of followers, and region or country of followers. TikTok reports gender as a binary percentage of male and female followers. Of these metrics, we most closely evaluated the gender percentage of followers over time to see how well we were able to reach specific demographics.
6.1 Video and account metrics
During the 4-month test period, the Terra Explore account gained over 12 000 followers, and the 48 videos published garnered 2 106 504 views, 3579 comments, and 5144 shares. The videos had a combined 22 297 h of watch time. Individual video views ranged between 522 views and 684 100 views, with a median of approximately 2400 views. Seven videos received over 90 000 views, and 30 videos received less than 3000 views. Videos were uploaded at various times throughout the day, and the videos that received the most views (> 90 000) were uploaded either in the morning or early afternoon Mountain Standard Time (MST, UTC−7) (Fig. 2). However, there was no statistically significant correlation between video upload time and the number of video views (p > 0.05). We did not spread video publication evenly throughout the week, and the greatest number of videos were posted on Tuesdays. Videos that were published on Wednesdays and Thursdays received fewer views than other days of the week, with videos published on Mondays receiving the most cumulative views on average (Fig. 3).
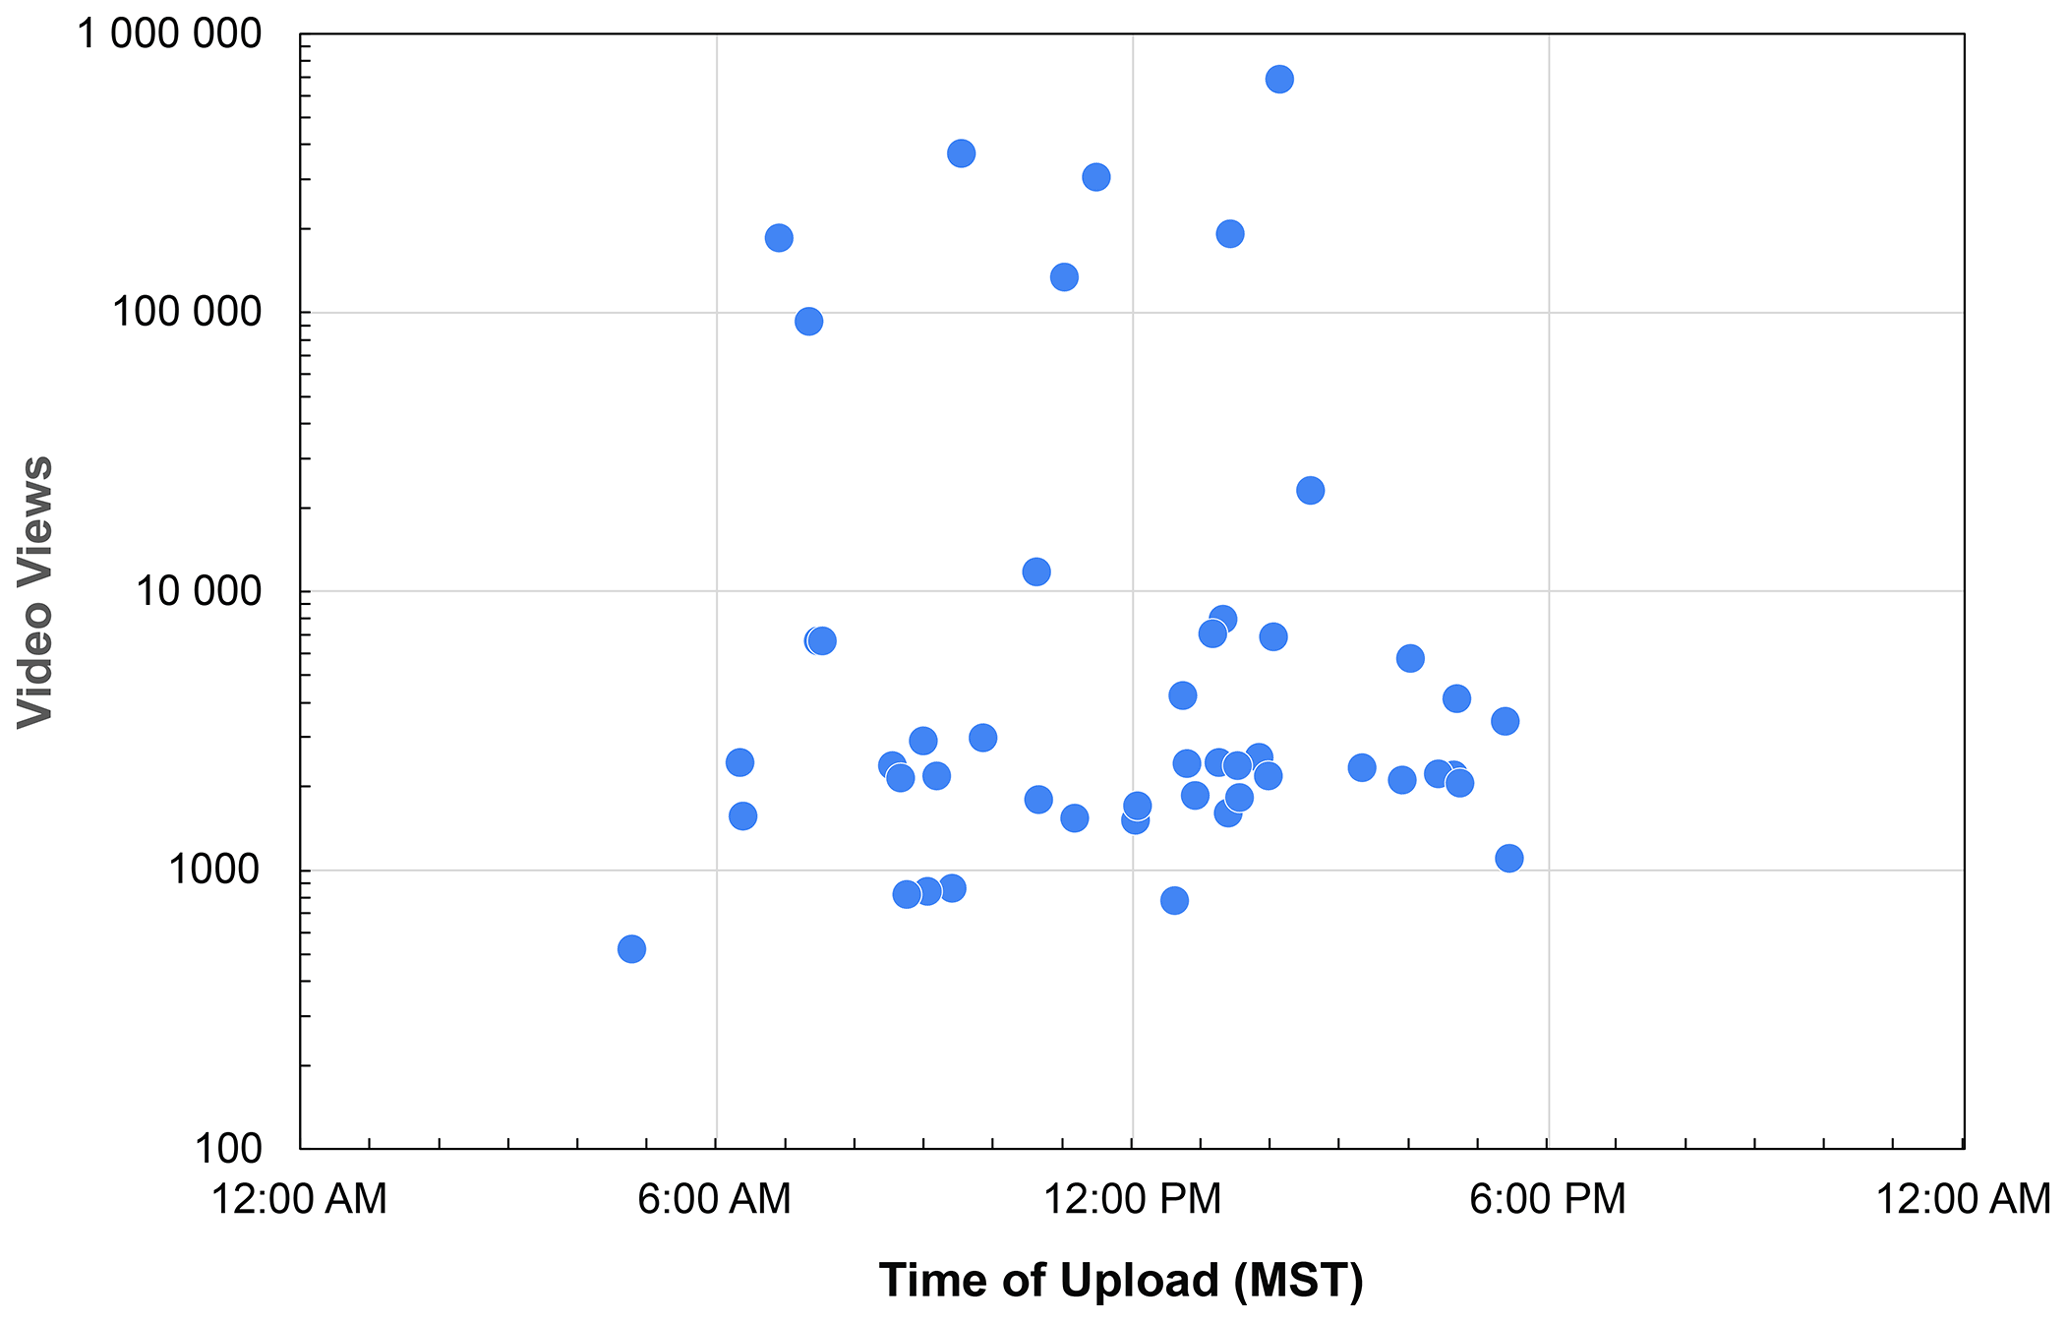
Figure 2Time of video upload in Mountain Standard Time (MST, UTC−7) and the number of views the video received (on logarithmic scale). Videos that received > 90 000 were uploaded in the morning or early afternoon MST (UTC−7). There is no statistically significant correlation between the time of video upload and the number of video views (p > 0.05).
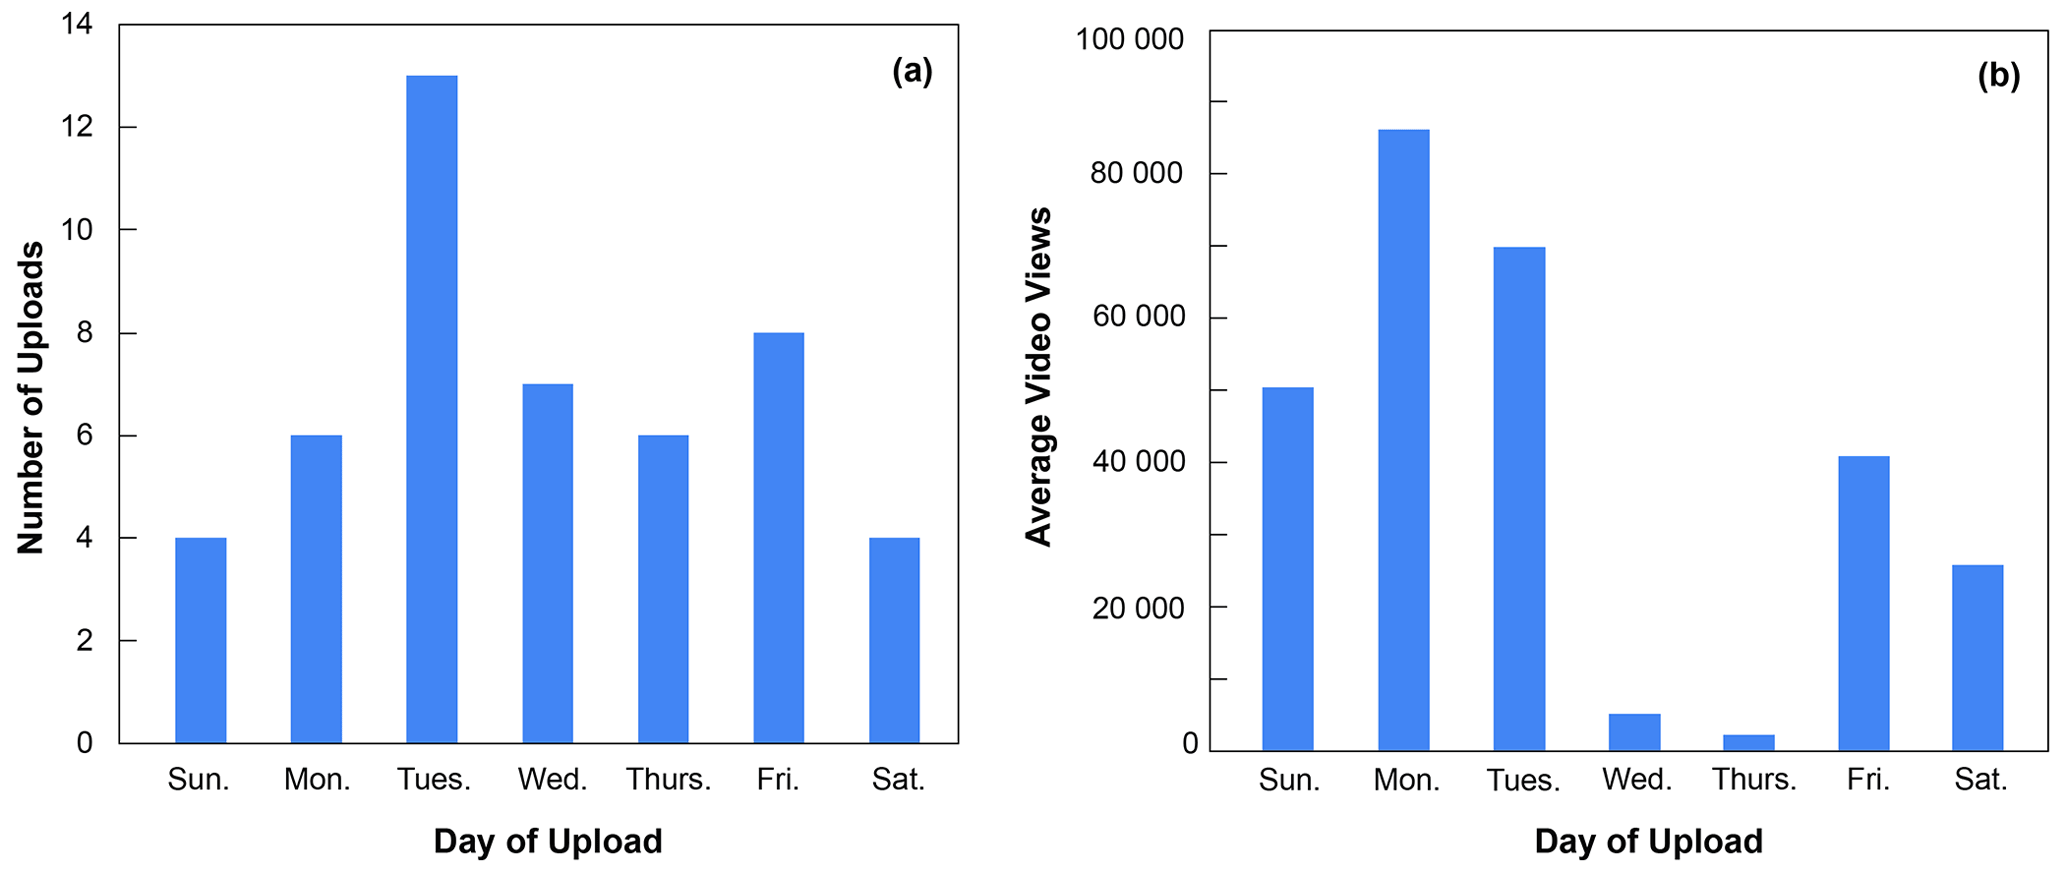
Figure 3(a) The number of videos uploaded per day of the week. (b) The average total number of video views received based on the day of video upload. Videos that were posted on Wednesdays and Thursday received the lowest number of views on average.
Table 2Top 10 most-viewed videos between 8 October 2021 and 6 February 2022 on the Terra Explore and corresponding metrics. GMV: ground motion visualization, M: earthquake magnitude. ER %: engagement rate (metric audience reached × 100). All videos had an average video view duration of 40 % or higher. These videos correspond to nos. 1–10 in Fig. 4.
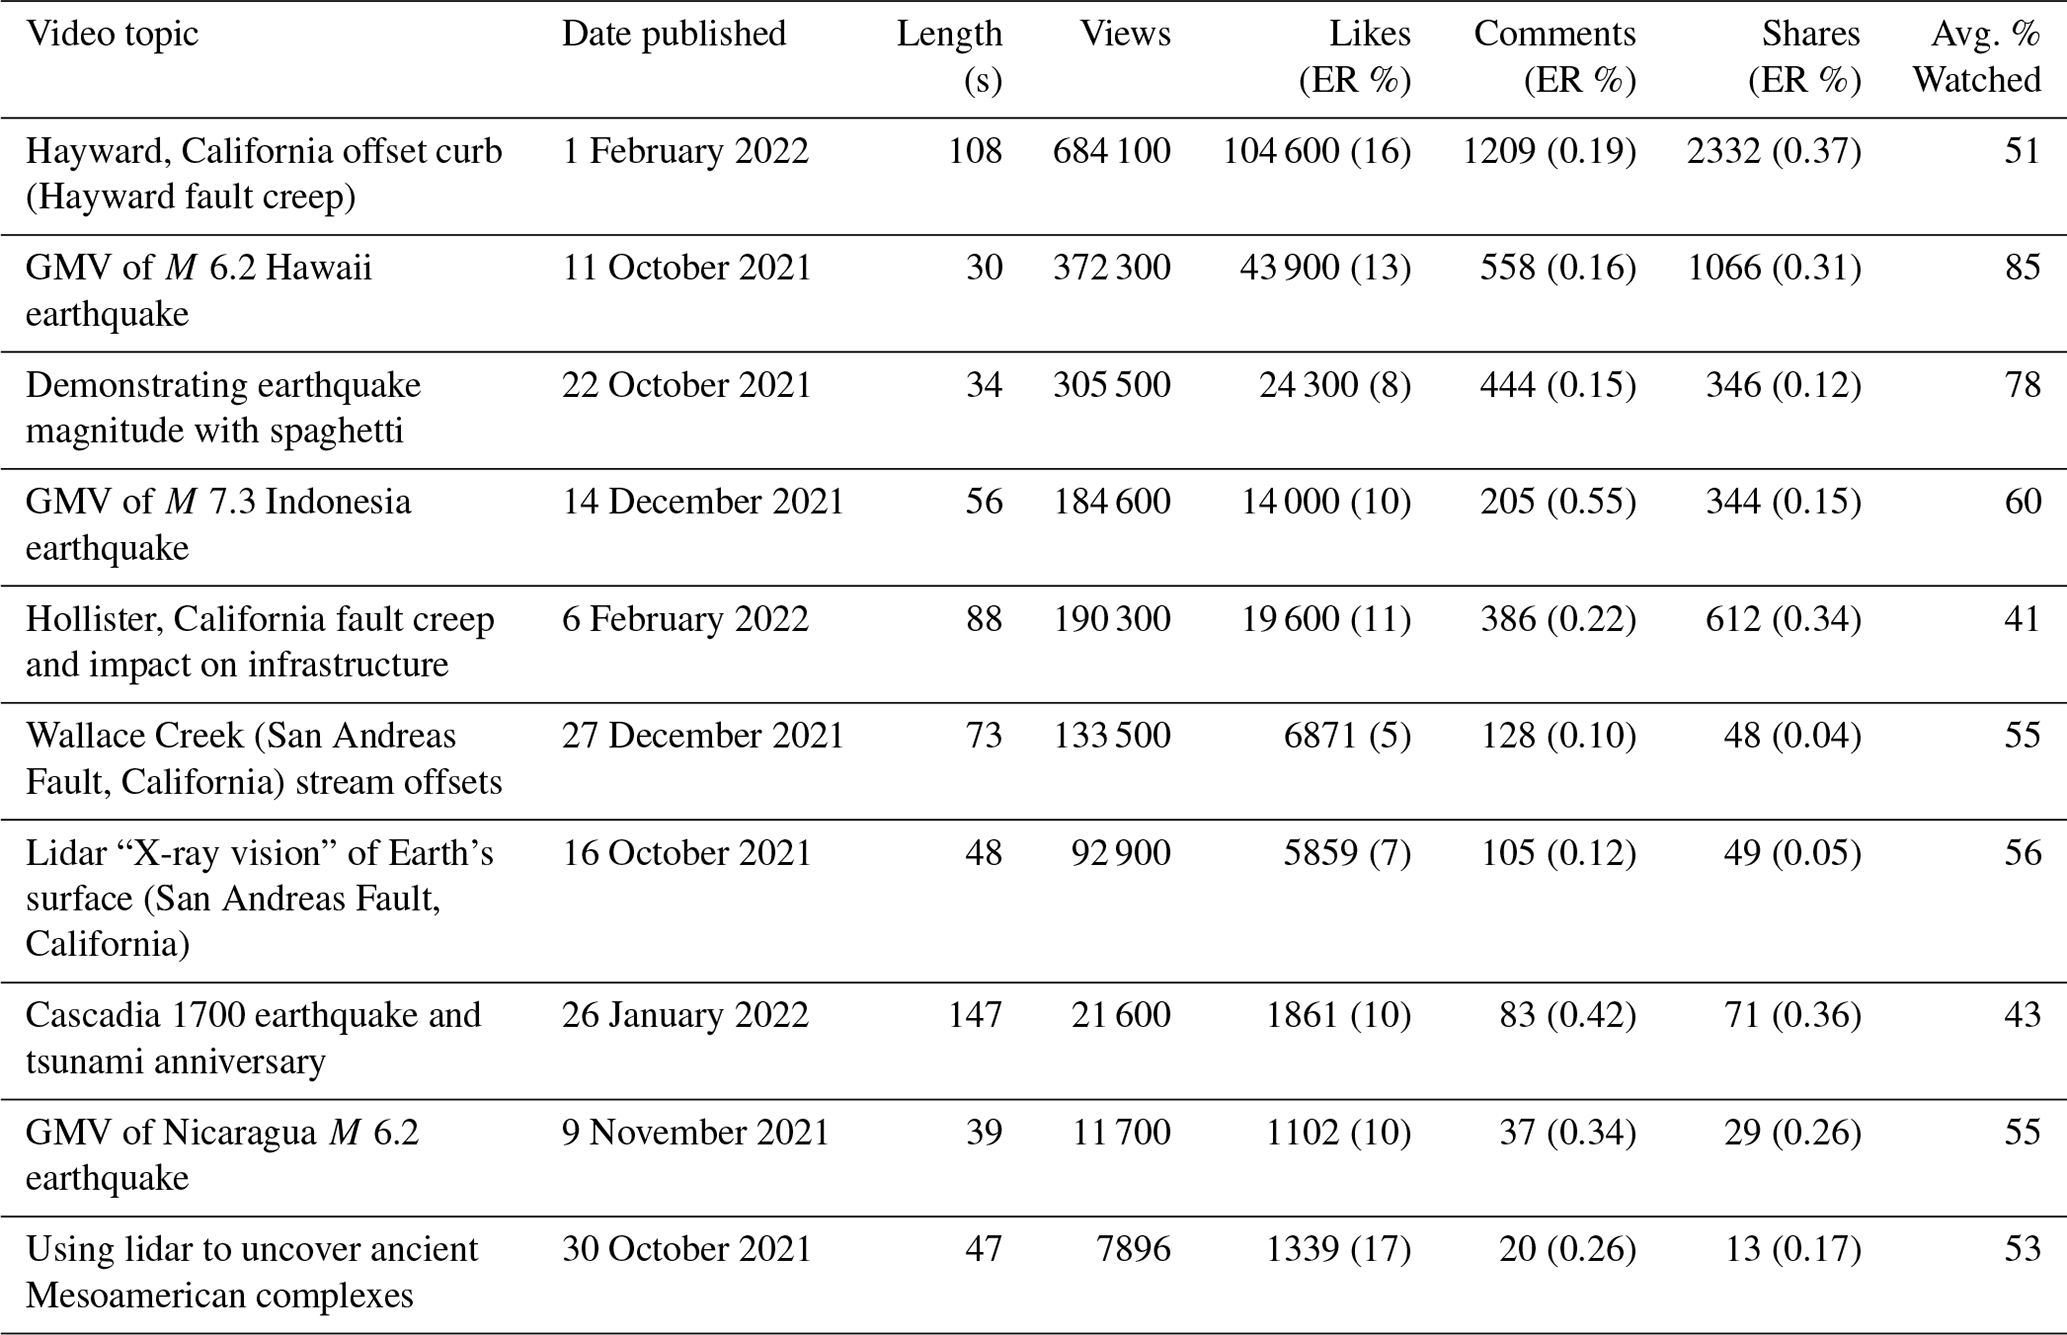
Table 3The 10 least-viewed videos and corresponding metrics on the Terra Explore account between 8 October 2021 and 6 February 2022. ER: engagement rate (metric audience reached × 100). These videos correspond to nos. 39–48 in Fig. 4.
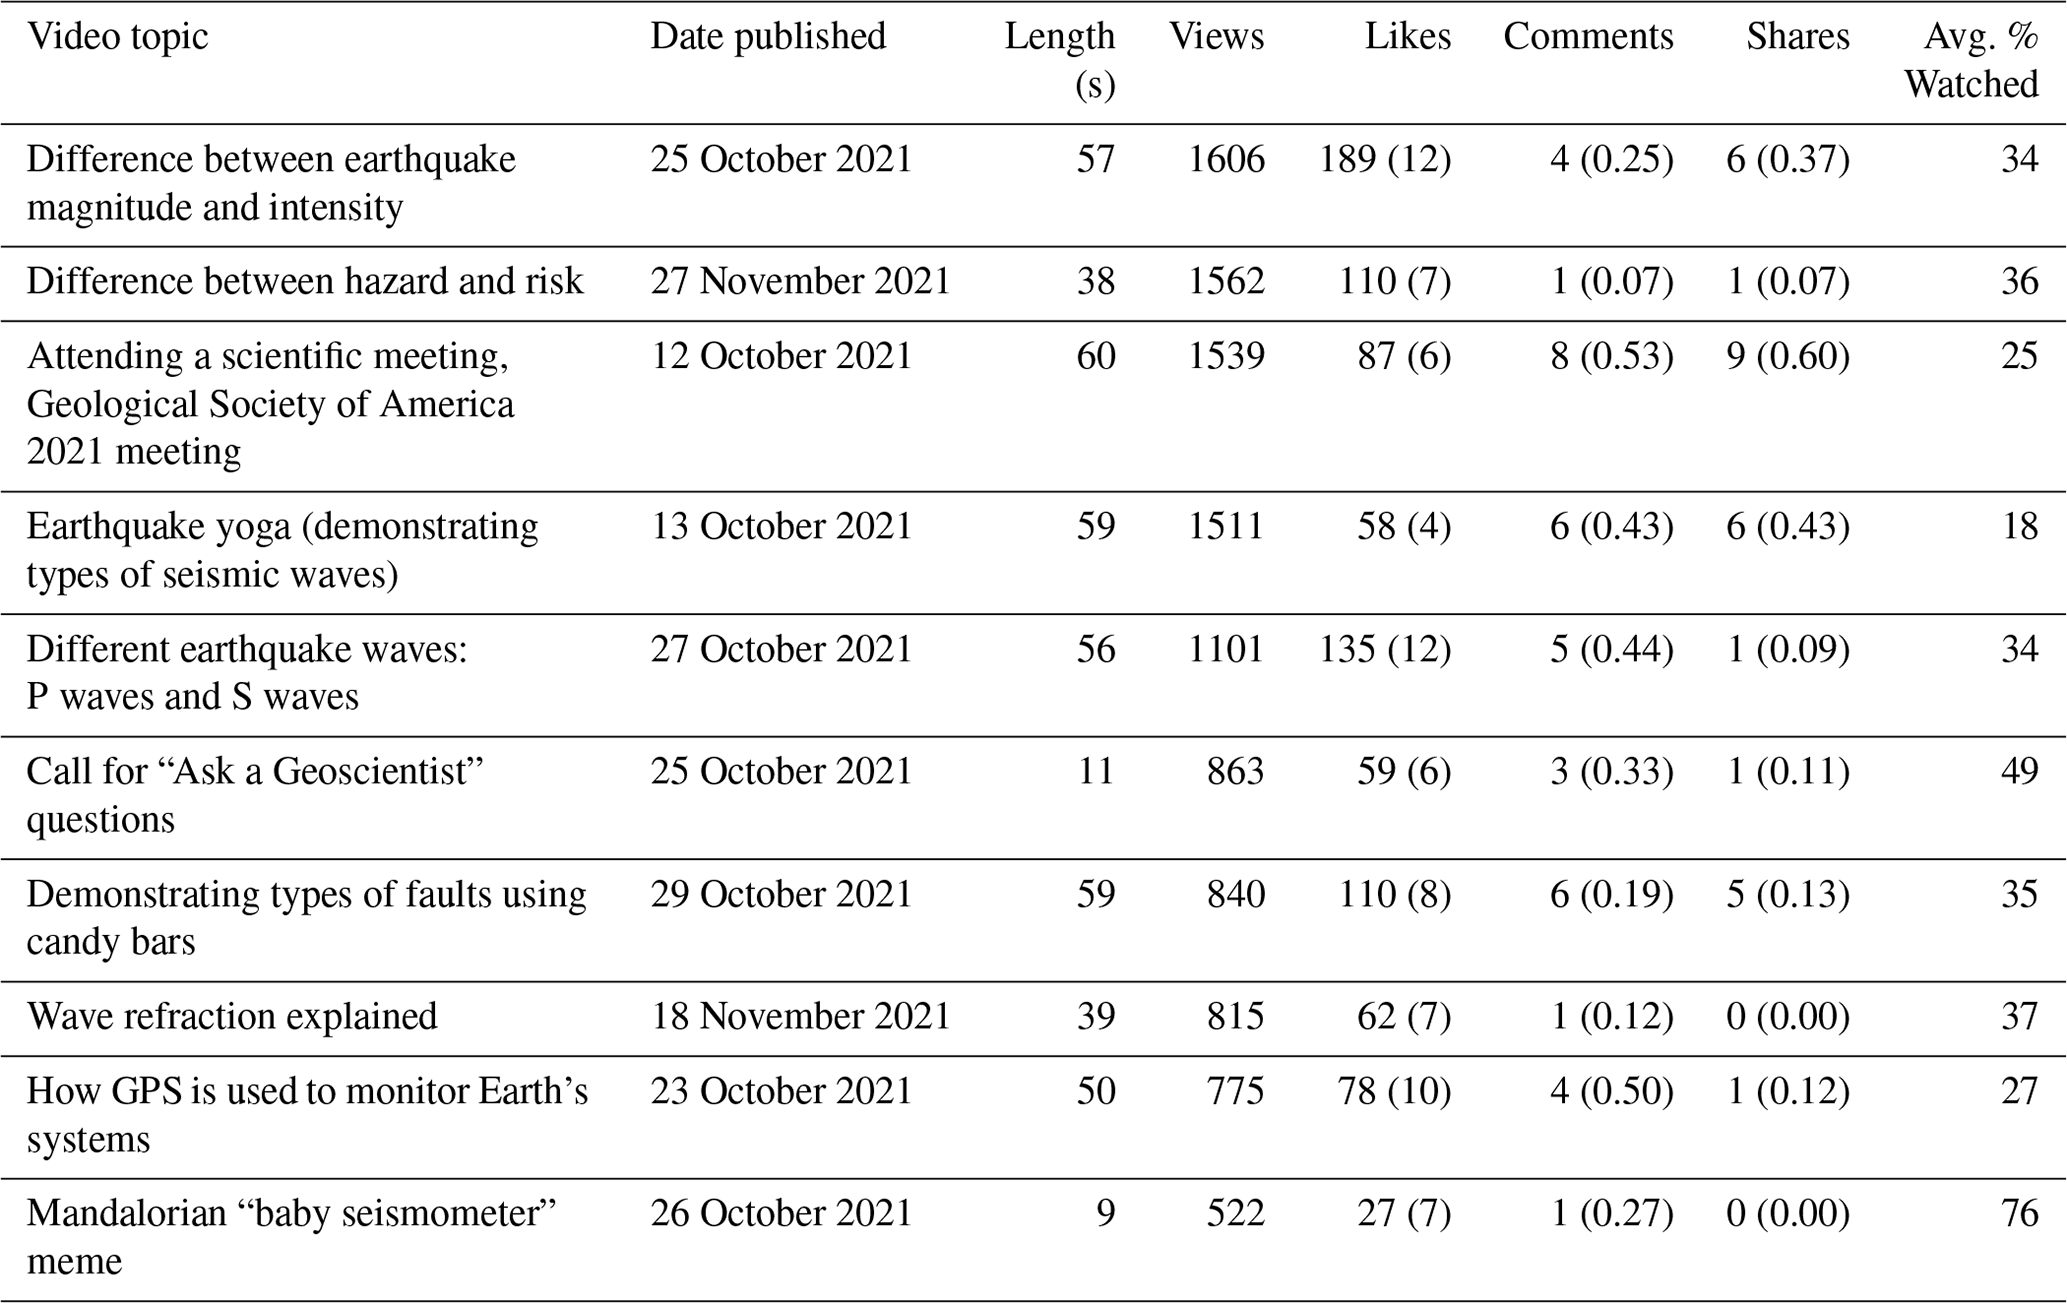
Tables 2 and 3 record the topic and metrics of our 10 most-viewed and 10 least-viewed videos. Our highest viewed video described an offset curb in Hayward, California that was famous among geologists for recording the continual slow motion along the Hayward Fault (part of the San Andreas fault system). Three of our 10 most-viewed videos were GMVs, one was a demonstration, and the rest were lecture-style videos. The lecture-style videos were either related to discussing a geologic topic related to a specific location or a recent newsworthy event or anniversary. Our 10 least viewed videos included five lecture-style videos, two demonstration videos, one in-person video, one miscellaneous video, and one meme-style video. These lecture-style videos were all explainer videos of topics related to seismology or geodesy. Our least-viewed videos were all published in either October or November 2021, when we first began our account. However, our second and third most-viewed videos were also published during this timeframe. Our top 10 most-viewed videos averaged 67 s in length and had an average video view duration of 58 %, while our 10 least-viewed videos averaged 44 s in length and had an average video view duration of 37 %. The top 10 most-viewed videos had an average engagement rate of 11 % for likes, while the 10 least-viewed videos had an average engagement rate of 8 % for likes.
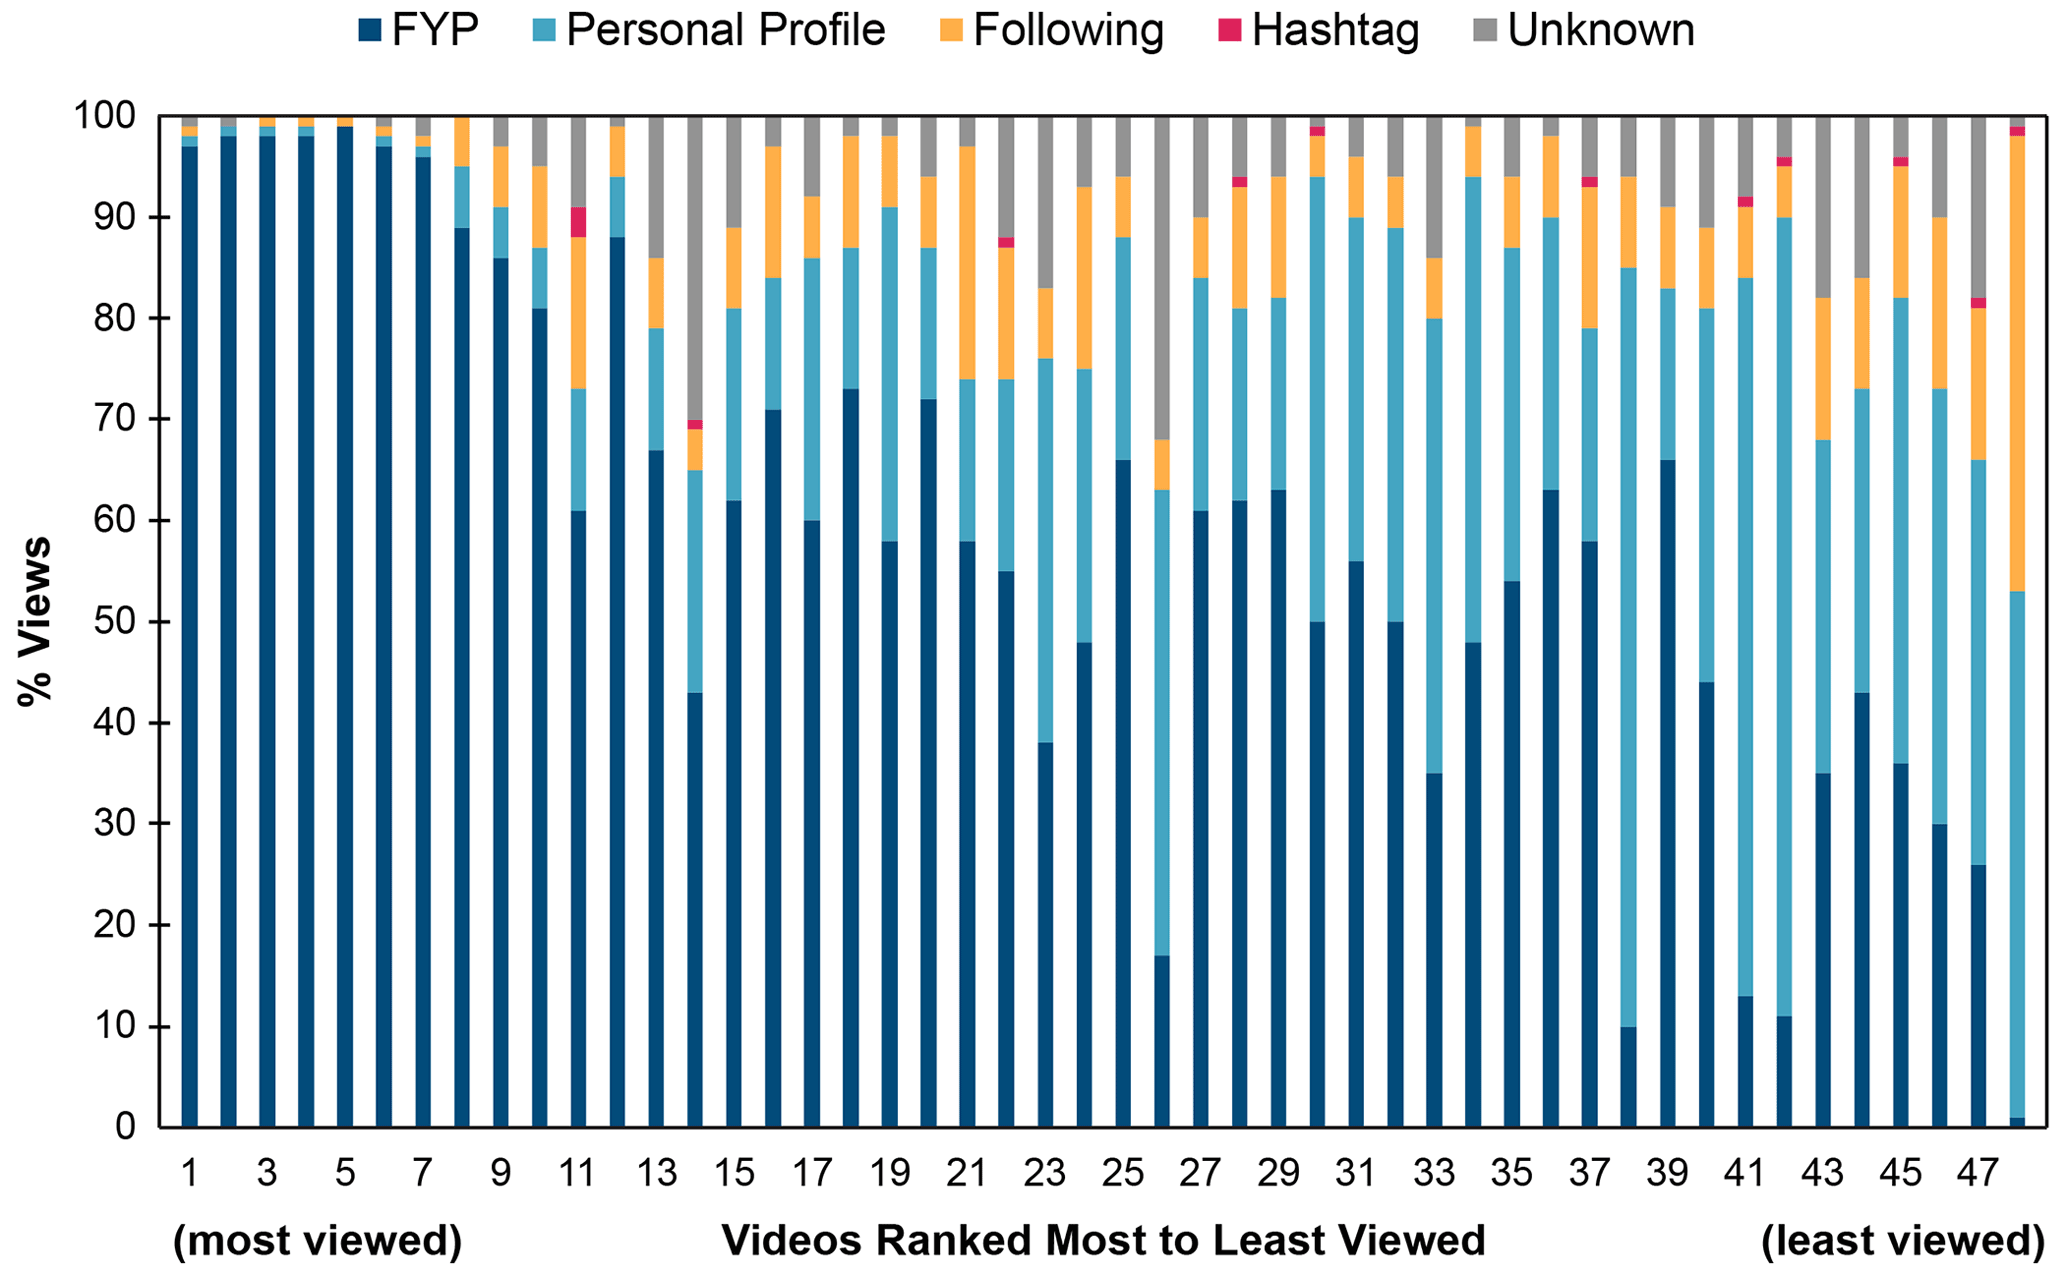
Figure 4Percentage of video views by section (For You page, personal profile, Following, hashtag, unknown), with videos ranked from the most (1) to the least (48) viewed (see Tables 2 and 3 for the 10 most and 10 least-viewed videos). The videos with the highest number of views received nearly all (∼ 97 %) of their views from the For You page. The seven most-viewed videos each received over 90 000 views.
Of the account's over 2.1 million video views, 95 % of those views came from videos shown on the For You page. Nearly twice as many videos were viewed on the Terra Explore profile page than on the Following feed. Videos were rarely discovered by a user directly searching for a specific hashtag (Table 4). Our most-viewed videos received nearly all (∼ 97 %) of their views from the For You page. Videos with fewer views were shown to fewer users on the For You page and received a higher percentage of views from the Terra Explore profile page or the Following feed (Fig. 4).
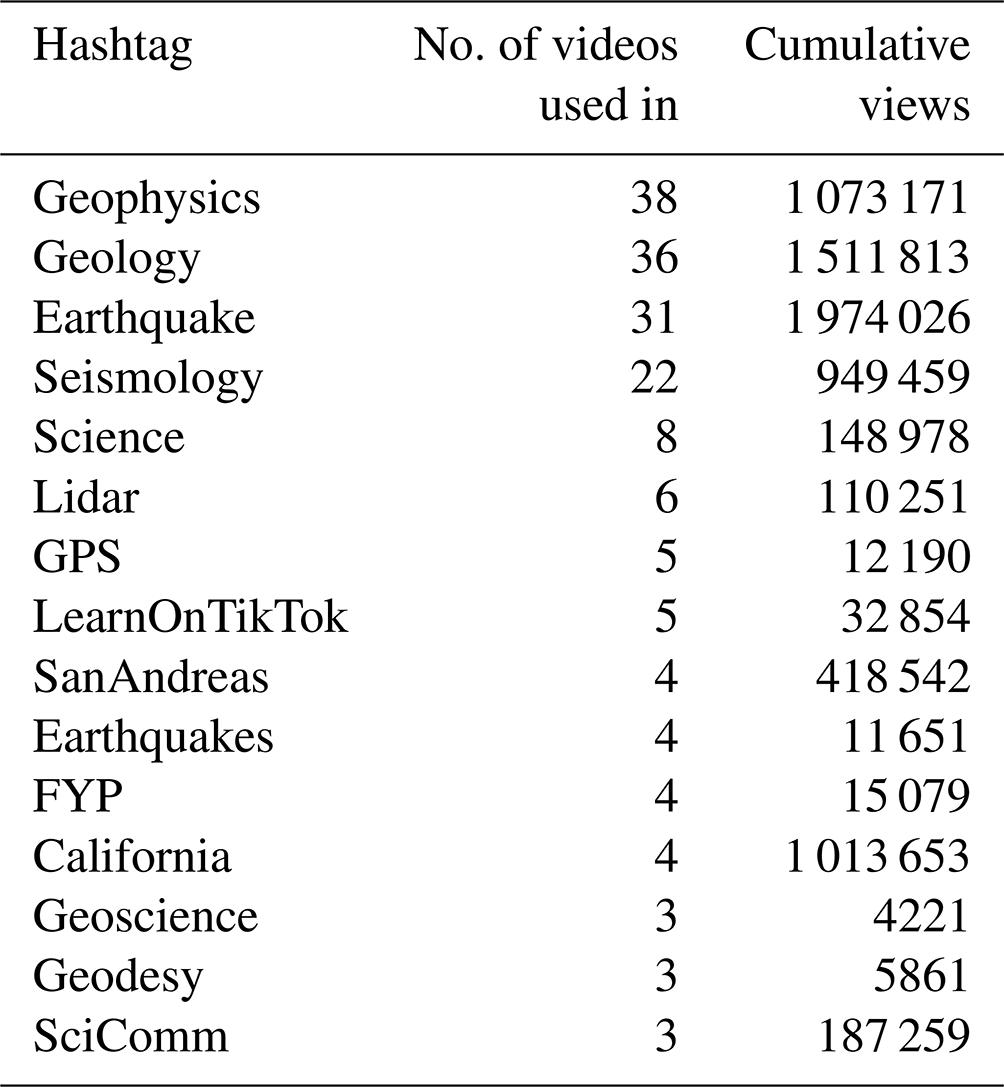
Table 4Top 15 most commonly used hashtags on the Terra Explore videos, indicating the number of videos they were used on and the cumulative views associated with hashtag use. (FYP: For You page.)
A total of 85 % of the account's followers are located within the United States, followed by 3 % from Canada; 84 % of the total number of video views came from users located within the United States, with each individual video averaging 78 % of its views from users in the United States. Canada was the second highest video viewer region on 22 videos, Australia on 17 videos, the United Kingdom on 5, and the Philippines on 4, with the secondary country yielding, on average, 5 % of a video's views. As of February 2022, the Terra Explore account had 36.5 % female and 63.5 % male followers. This percentage remained relatively unchanged over the 1-month duration of video posts.
6.2 Video view duration and engagement rate
The average percentage of time a video was viewed was 44 % of its duration, and on average, 19 % of users watched the full duration of a video. We evaluated the relationship between the average view duration of a video (%) and the number of video views based on the length of the video (< 30 s, 30 s to 1 min, 1 to 2 min, and > 2 min in duration) to assess whether longer watch times resulted in greater promotion to other users, resulting in higher views (Fig. 5). Amongst all videos, there is a weak positive correlation that is statistically significant between the average video view duration and number of video views (r = 0.37, p = 0.008). Amongst the individual video length populations, only videos between 30 s to 1 min long showed a statistically significant correlation between average video view duration and number of video views (r = 0.57, p = 0.002). Videos < 30 s averaged the highest average view duration (63 %). However, there is a statistically significant negative correlation between the average video view duration and the length of a video (r = −0.41, p = 0.004) (Fig. S6 in the Supplement), indicating that the average view duration is, in part, tied to the length of the video itself.
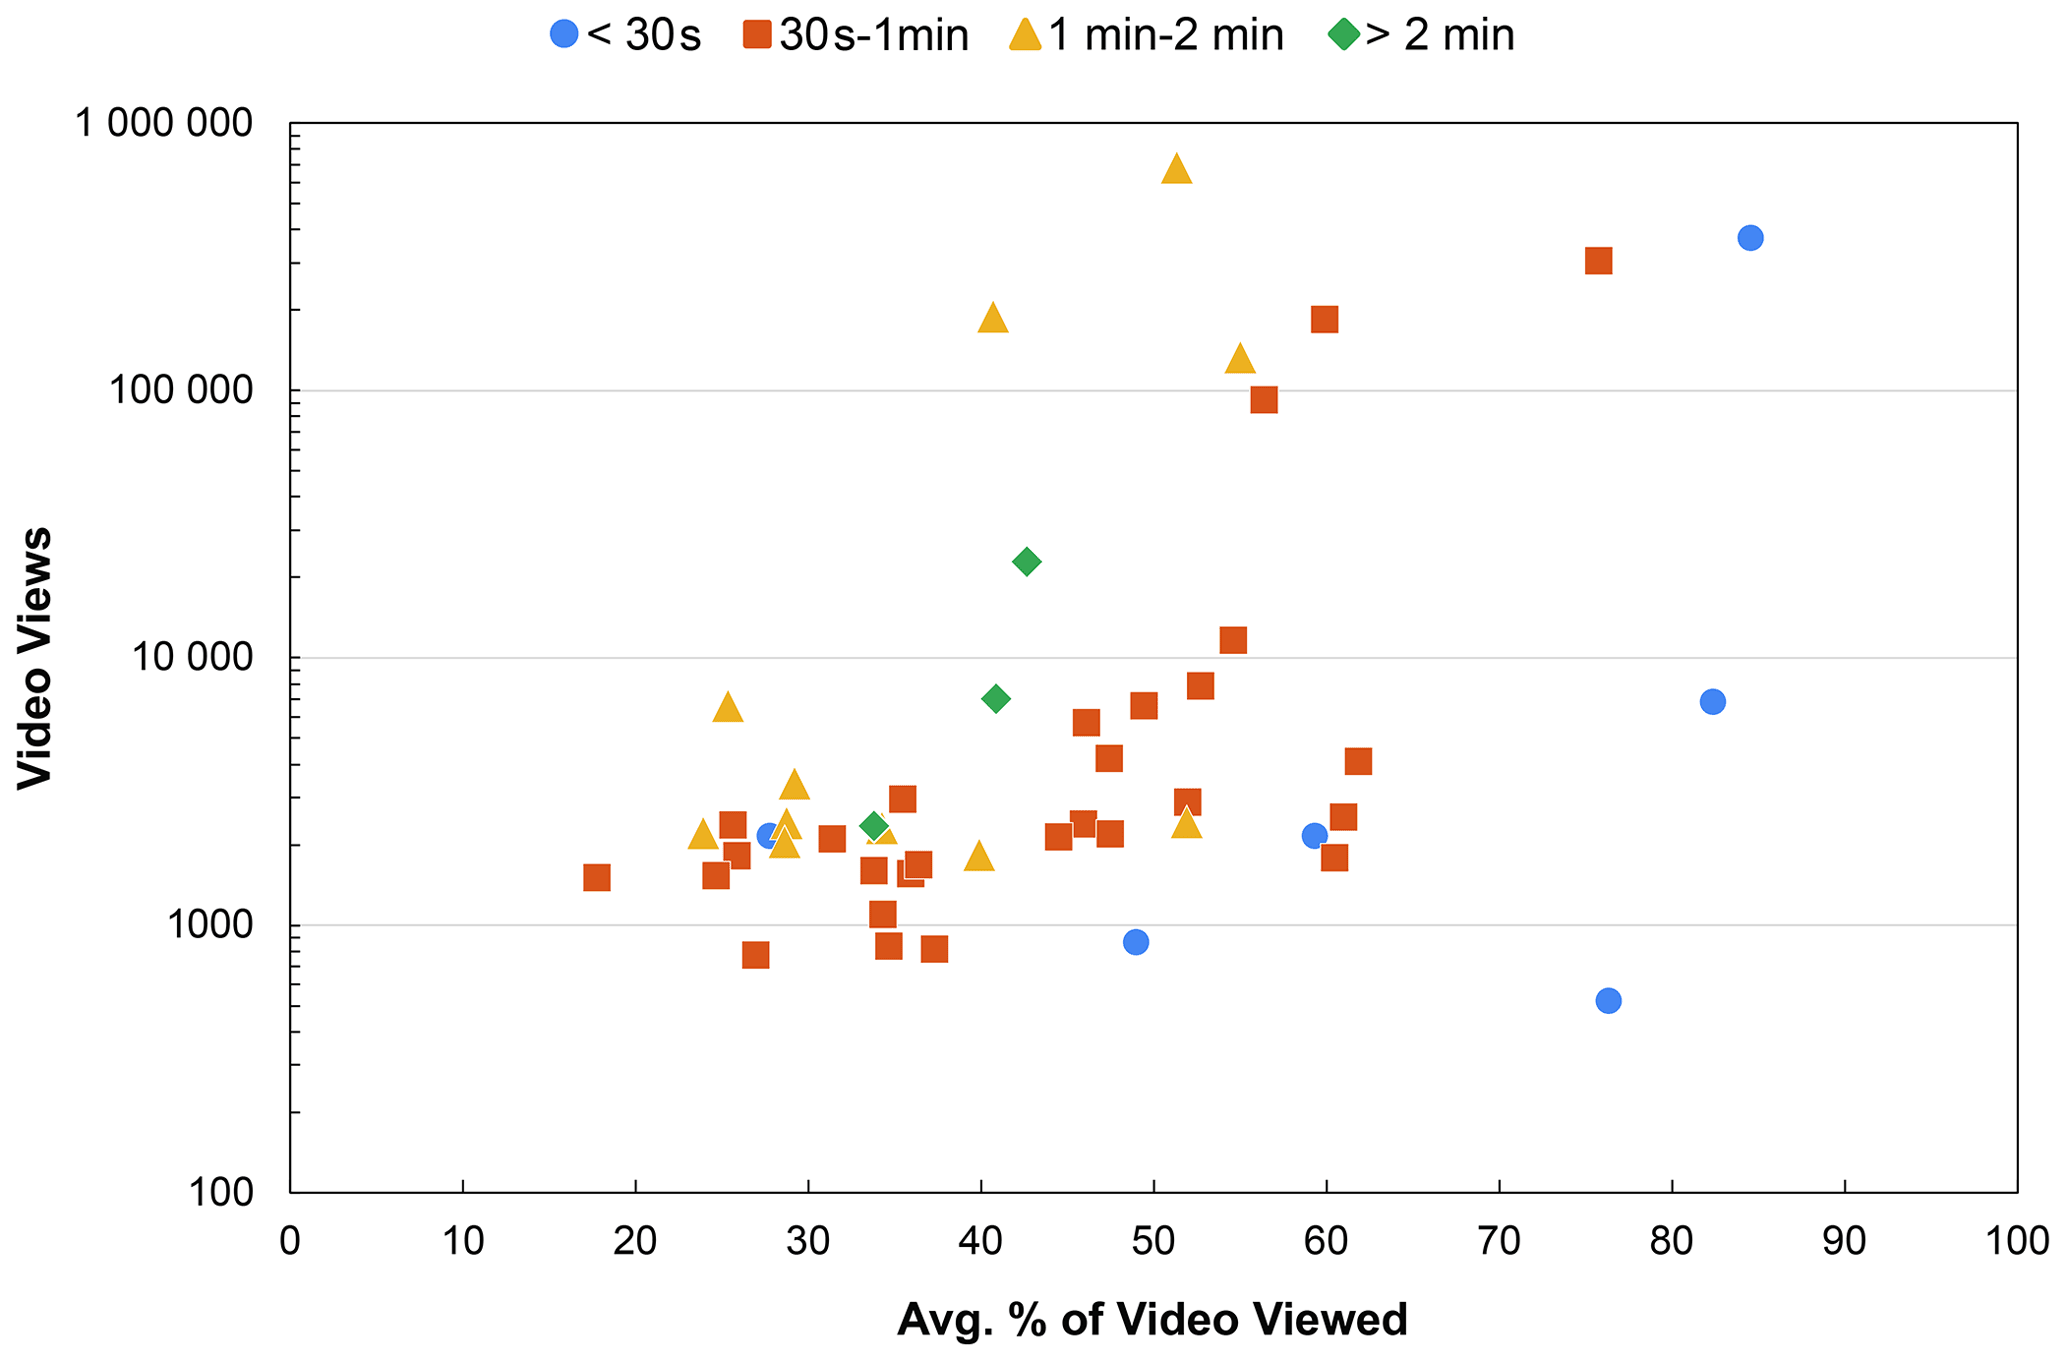
Figure 5Average percentage of the video viewed based on the length of the video (< 30 s, 30 s to 1 min, 1 to 2 min, and > 2 min) compared to the number of video views. Note that video views are shown on a logarithmic scale. There is a weak positive correlation that is statistically significant (r = 0.37, p = 0.008). See Supplement for full correlation analysis.
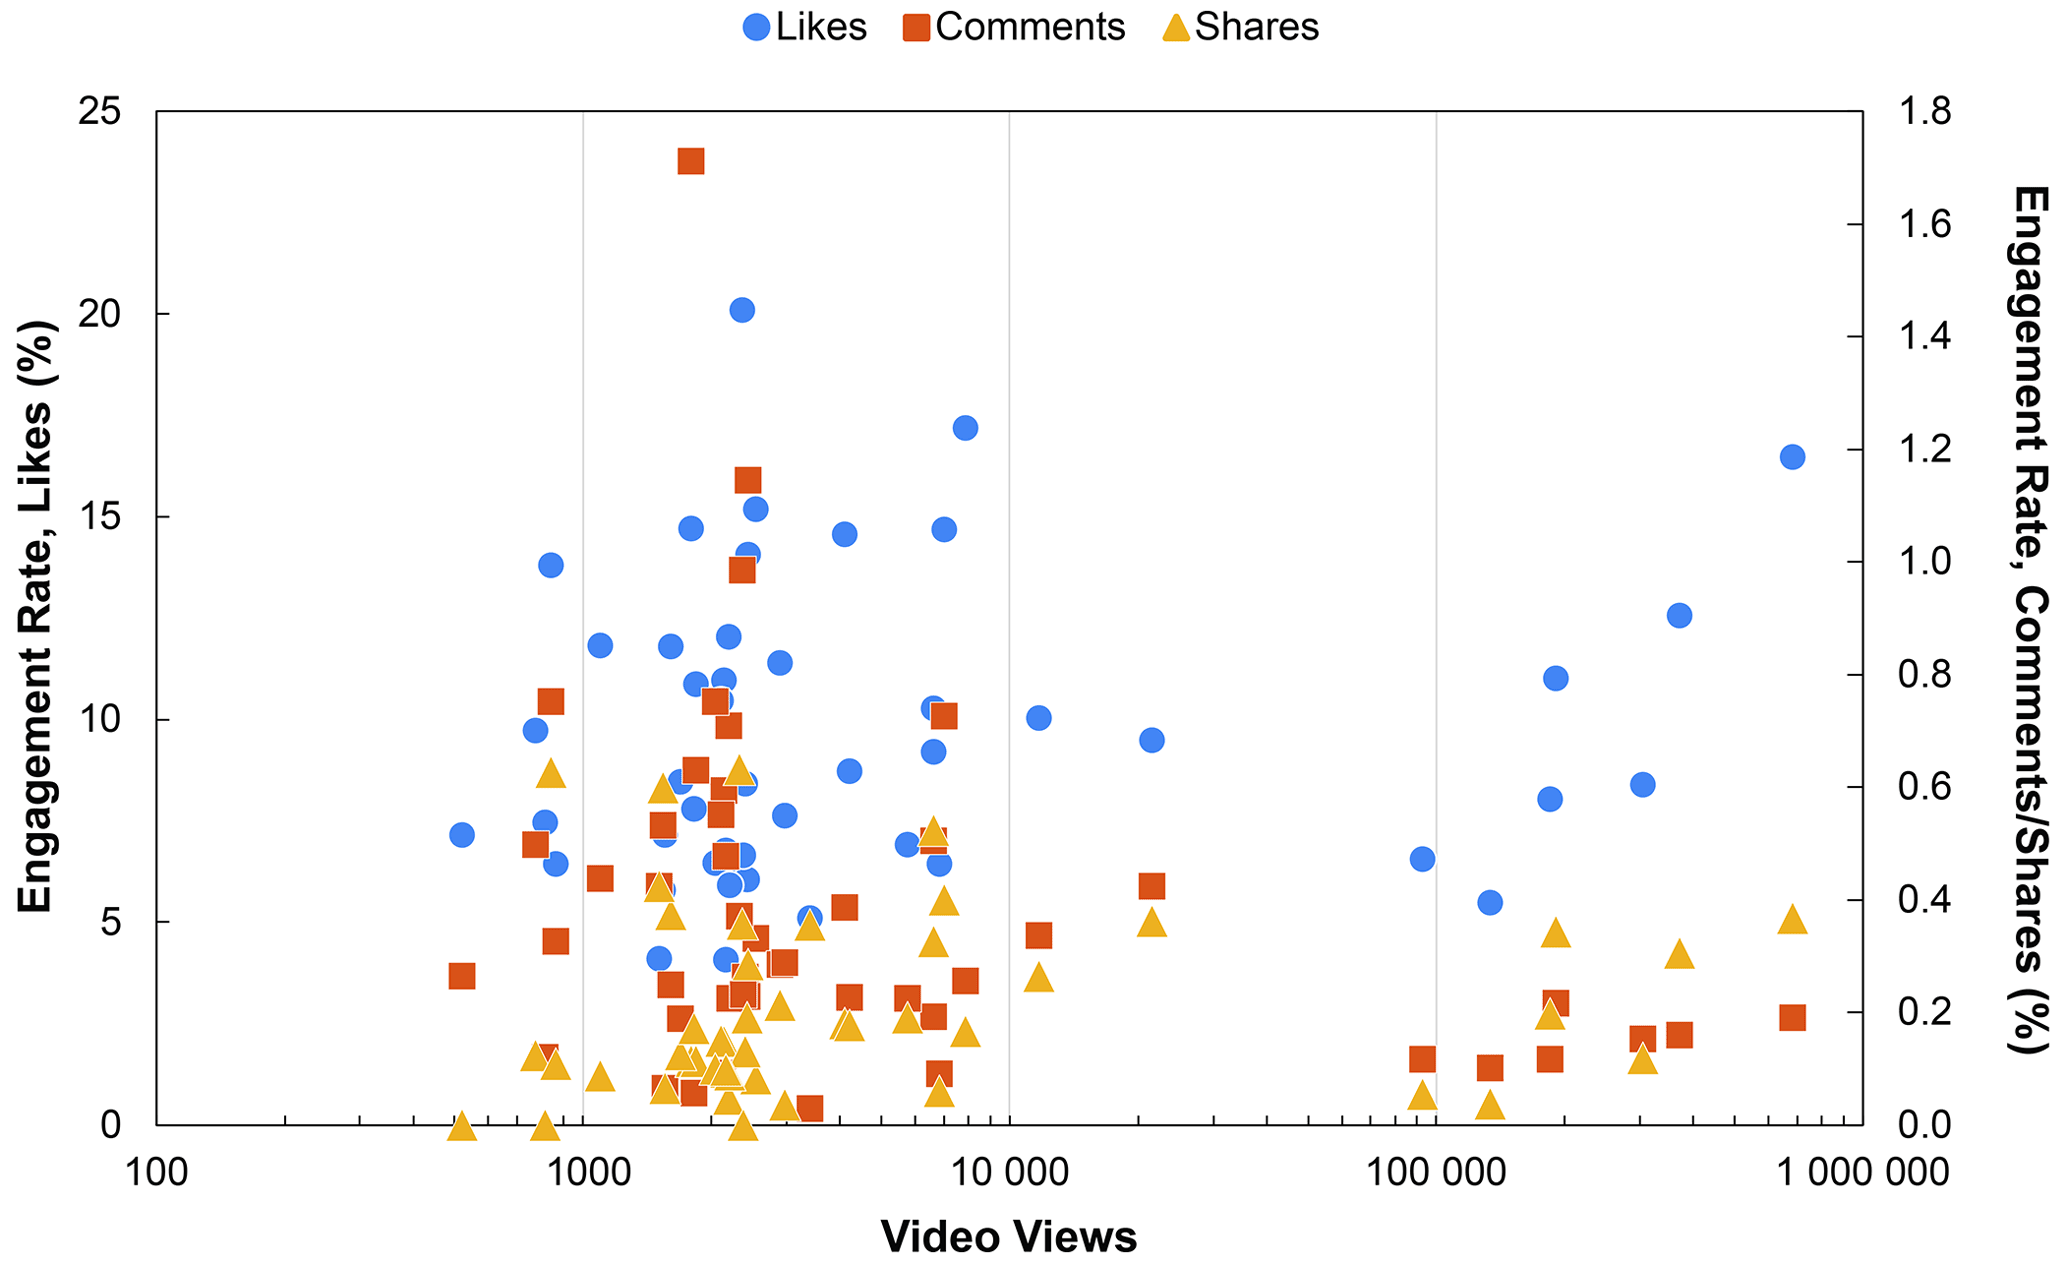
Figure 6Engagement rate of likes, comments, and shares from each video compared with video views (plotted on a log scale). There is a statistically significant strong positive correlation between the number of video views and the engagement rate of likes for videos with over 90 000 views (r = 0.90, p = 0.006) but no statistically significant correlation between the number of video views and the engagement rate of likes for videos with less than 90 000 views (p > 0.05). There is no statistically significant correlation between the number of video views and the engagement rate of comments or shares (p > 0.05). See Supplement for full correlation analysis.
Videos had average engagement rates of 10 %, 0.38 %, and 0.21 % for likes, comments, and shares, respectively. These engagement rates are similar to the engagement rates of other analyzed educational science content on TikTok (Habibi and Salim, 2021). We found a statistically significant strong positive correlation between the number of video views and the engagement rate of likes for videos with over 90 000 views (r = 0.90, p = 0.006). However, there is no statistically significant correlation between the number of video views and the engagement rate of likes for videos with fewer than 90 000 views (p > 0.05). We also observe no statistically significant correlation between the number of video views and the engagement rate of comments or shares (p > 0.05) (Fig. 6). Therefore, videos that received a large number of views (> 90 000) did not necessarily have a higher engagement rate than videos with far fewer views (∼ 2000).
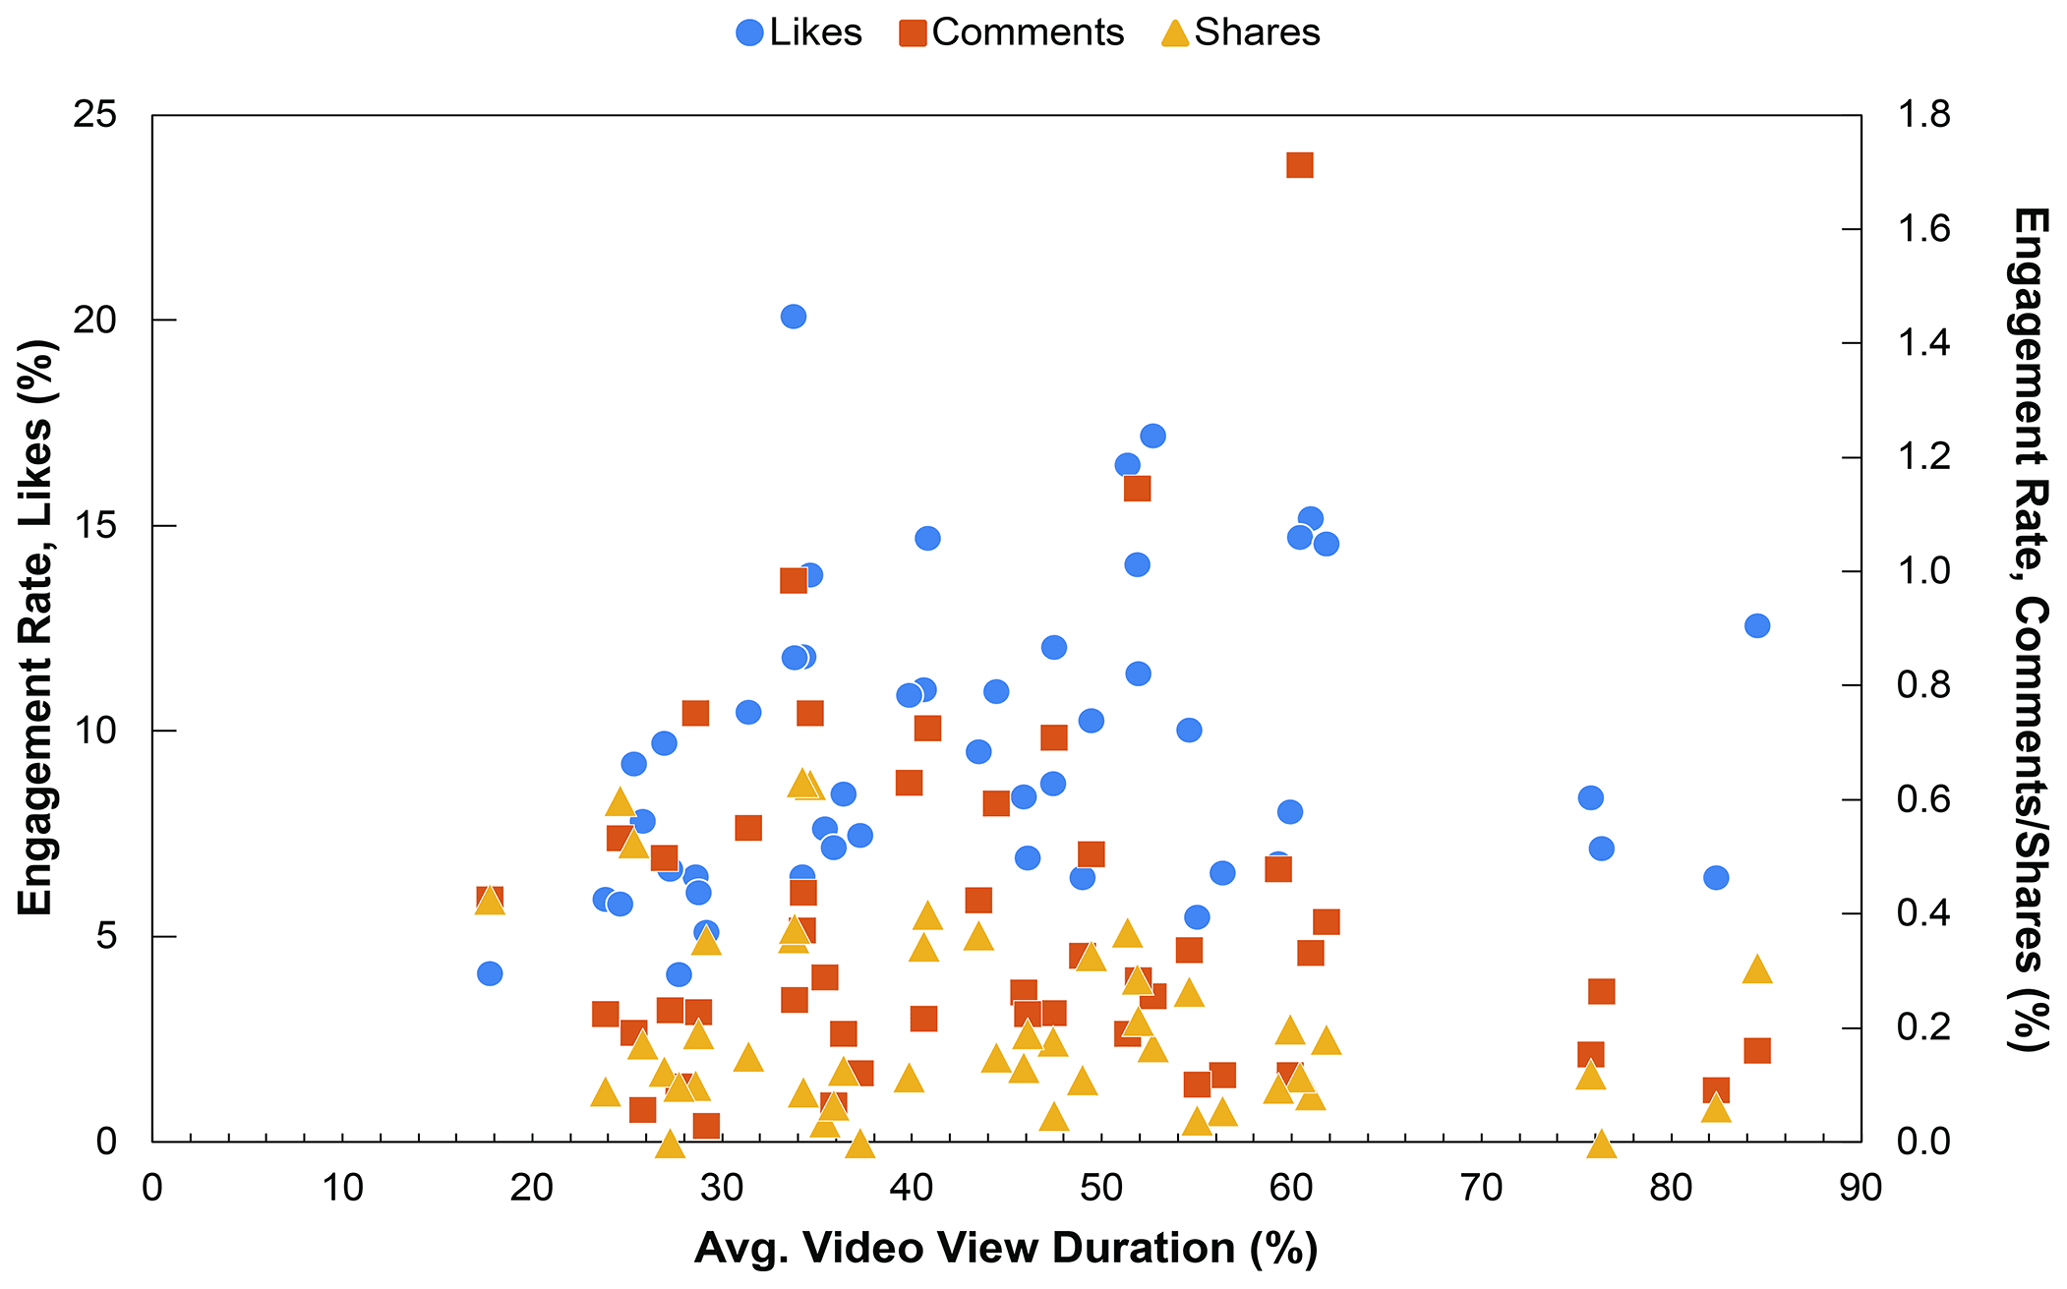
Figure 7Engagement rates from each video compared with the average view duration (%) of the video. There is no statistically significant correlation with the average view duration and any engagement rate metric (p > 0.05). See Supplement for full correlation analysis.
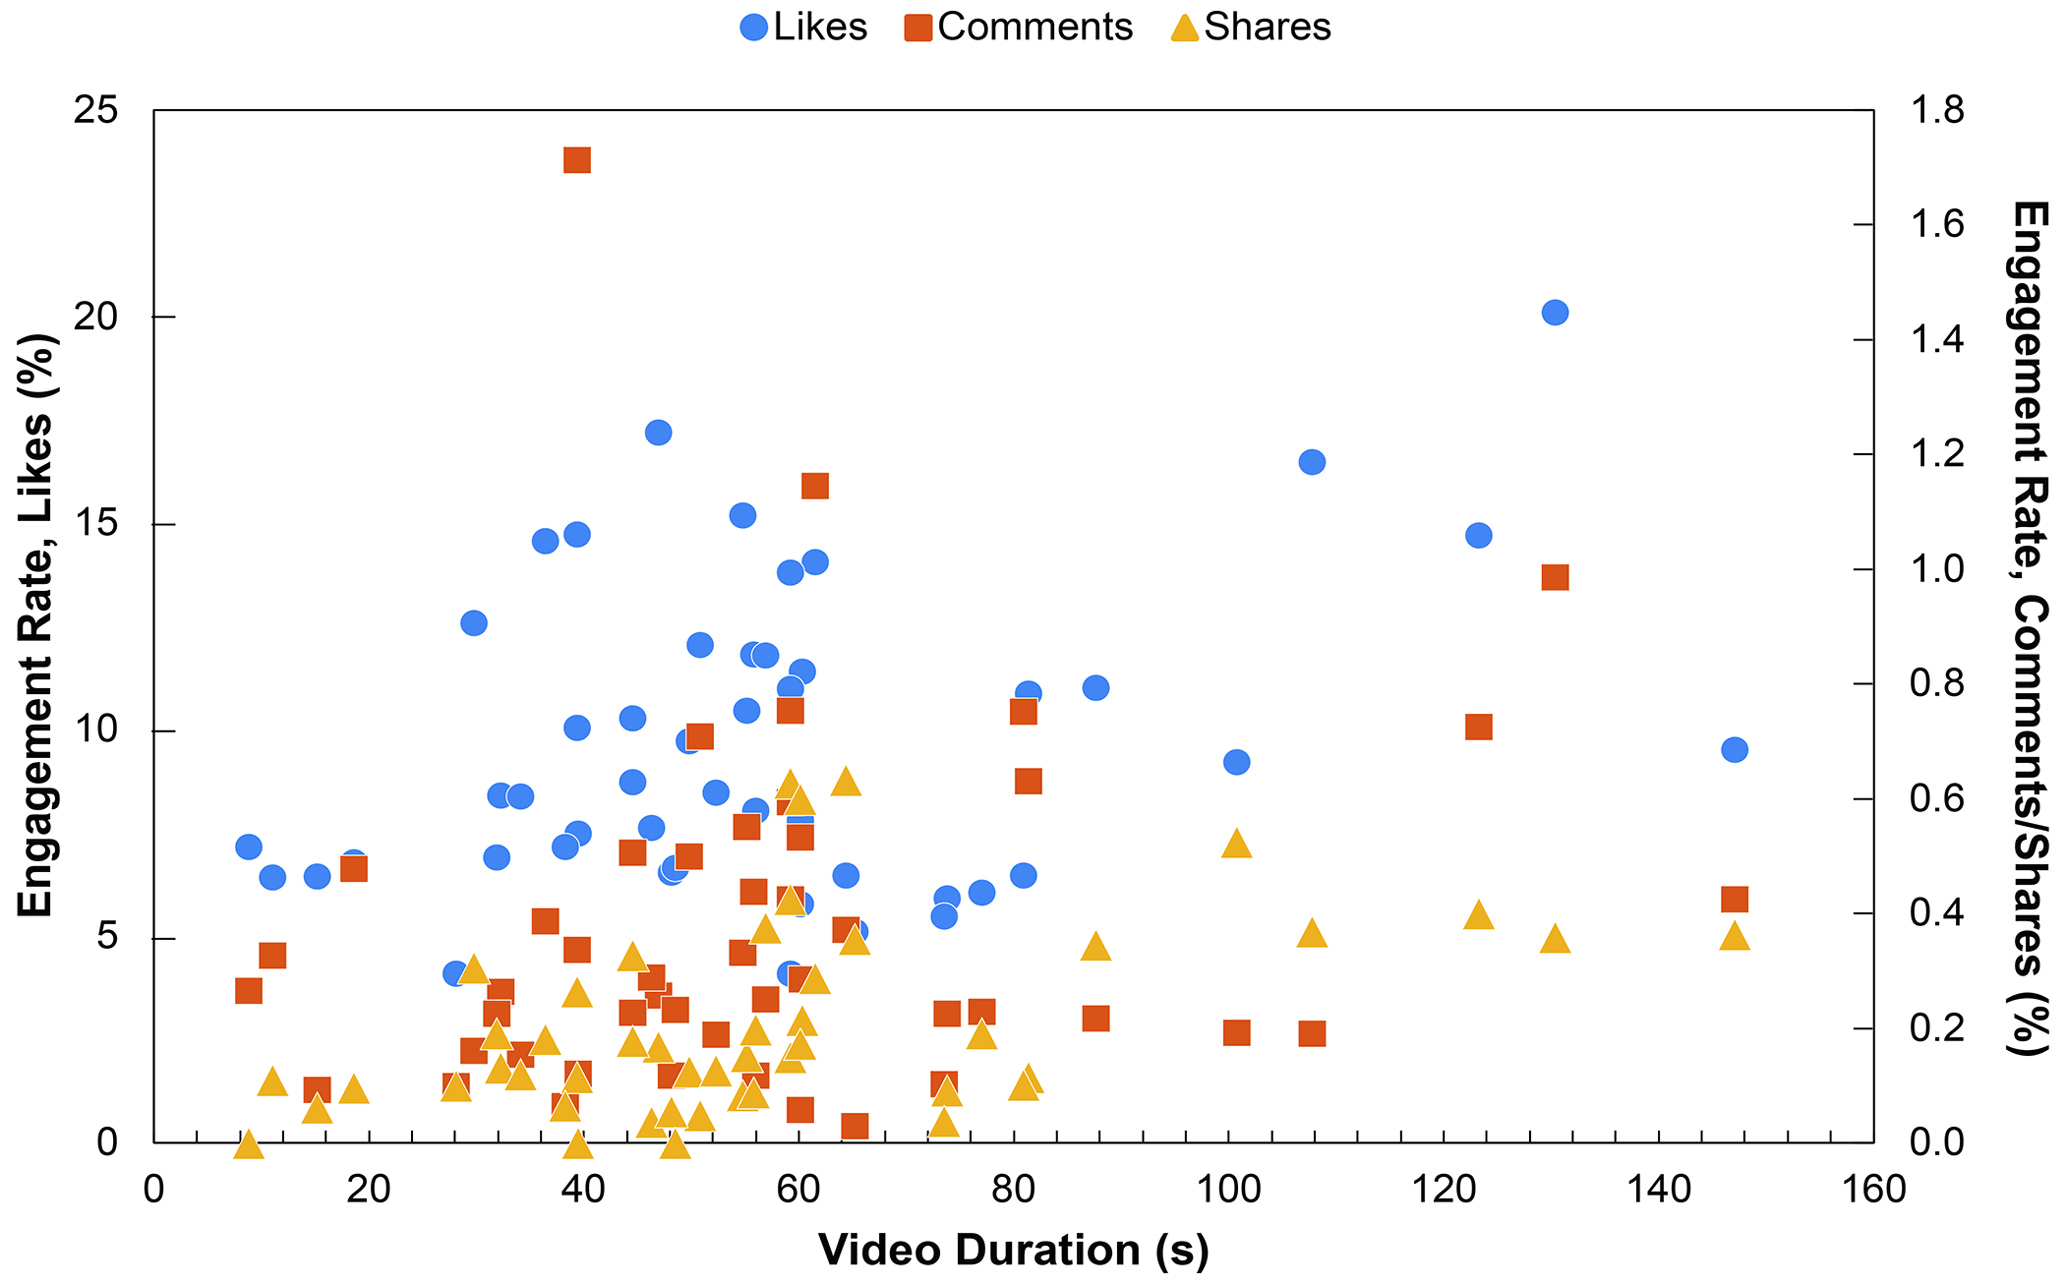
Figure 8Engagement rates from each video compared with the duration of the video. Short videos under 20 s have a lower overall engagement rate than longer videos do. There is a weak positive correlation that is statistically significant between the length of a video and the engagement rate of likes (r = 0.34, p = 0.017) and a weak to moderate positive relationship that is statistically significant between video length and the engagement rate of shares (r = 0.46, p = 0.001). There is no statistically significant correlation between video length and the engagement rate of comments (p > 0.05). See Supplement for full correlation analysis.
We observed no statistically significant correlation between the average video view duration (%) and the engagement rate of likes, comments, or shares (p > 0.05) (Fig. 7), two factors that are hypothesized to strongly impact the reach (views) a video can receive. Just because a user watches more of a video does not indicate that they are more likely to engage with the video. However, our analyses indicated that the average video view duration is, in part, tied to the length of the video. In looking at video length, we found a weak positive correlation that is statistically significant between the length of a video and the engagement rate of likes (r = 0.34, p = 0.017). There was no statistically significant correlation between video length and the engagement rate of comments (p > 0.05), but there was a weak to moderate positive relationship that is statistically significant between video length and the engagement rate of shares (r = 0.46, p = 0.001). Thus, longer videos tended to have higher engagement rates (Fig. 8).
6.3 Hashtags
Across our 48 published videos, we used a total of 81 unique hashtags. Our videos most commonly used the hashtags “geophysics”, “geology”, and “earthquake” (Table 4). Even though the hashtags “geophysics” and “geology” were used on the most videos, videos that used the hashtag “earthquake” generated the most cumulative views. Hashtags like “SanAndreas” and “California” that were only used in four videos were also associated with a large number of views.
Only one video had higher than 1 % of its views come directly from searching for hashtags or clicking on a hashtag to view videos (video ranked number 11 on Fig. 5). That video, explaining the Hunga Tonga-Hunga Ha`apai volcanic eruption in January 2022, received 3 % of its views from direct hashtag searches. This post included the hashtags “HungaTonga” and “Tonga”, from which the views were likely derived.
Between October 2021 and February 2022, the cumulative views of all videos using the “geology” hashtag across TikTok increased by 167.5 million views, with Terra Explore videos contributing 9 % of those views, and the “geophysics” hashtag increased by 1.2 million views, with Terra Explore videos contributing 89 % of those views.
6.4 GMV videos
Nine of the 48 videos produced featured ground motion visualizations (GMVs) of recent notable earthquakes. All nine of the GMV videos highlighted earthquakes that were of magnitude 6 or larger. GMV videos were uploaded the day of or the day after an earthquake occurred and were posted approximately twice a month during this 4-month duration. Views for these videos ranged between 2106 and 372 300 views. Eight videos were under 60 s in length, and one was 100 s long. The videos with the most views had a duration between 30–60 s, but there is no statistically significant correlation between video length and the number of views (p > 0.05) (Fig. 9a). We found that there is a strong positive statistically significant correlation between the average video view duration and the number of video views (r = 0.847, p = 0.004) (Fig. 9b). There was no statistically significant correlation between the number of video views and the engagement rate of likes, comments, or shares (p > 0.05) (Fig. 9c). Videos were posted at different times during the day, with the videos that received the most views being posted in the morning Mountain Standard Time (MST, UTC−7). However, there is no statistically significant correlation between time posted and number of views (p > 0.05) (Fig. 9d). Regardless of the global location where the earthquake occurred, on average, 84 % of each videos' views came from users located within the United States. Therefore, these GMV videos were largely not being shown to users in countries where the earthquake occurred but rather shown to users in North America (where the visualization is focused).
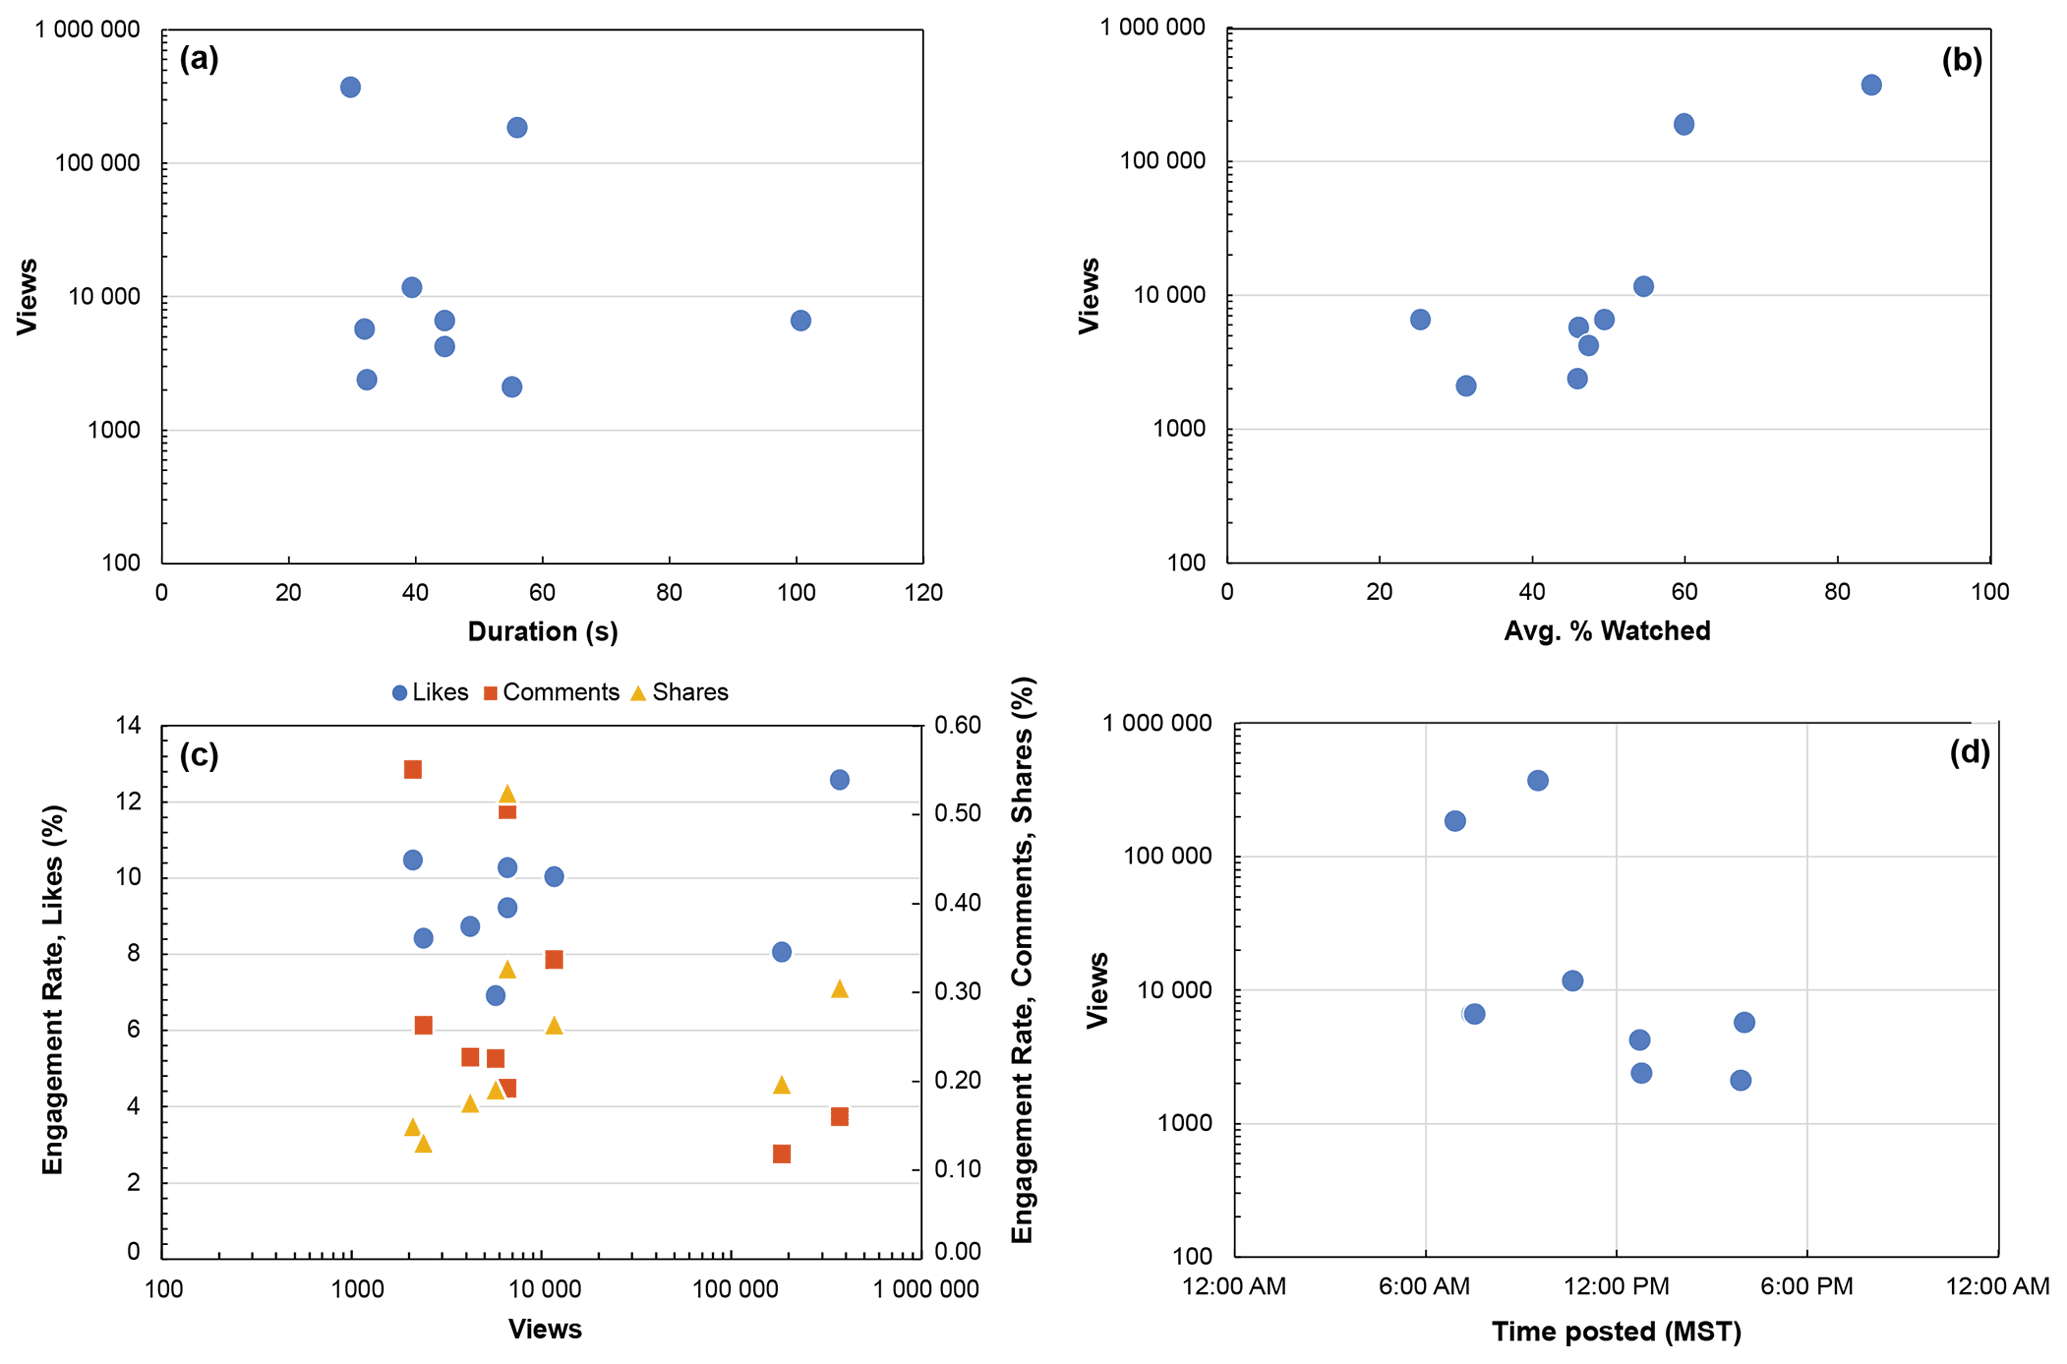
Figure 9Video views of GMV videos on a log scale compared with (a) the duration of the video, (b) the average duration a video was watched, (c) the engagement rates of the video, and (d) the time of day the video was posted (MST, UTC−7). There is a strong positive statistically significant correlation between the average video view duration and the number of video views (r = 0.847, p = 0.004), but there is no statistically significant correlation (p > 0.05) between the other parameters. See Supplement for full correlation analyses.
7.1 Video views and viewership
The vast number of video views received from the For You page rather than the Following feed demonstrates that content on TikTok is primarily consumed from the For You page and that the success of a video largely hinges on whether it will continue to be shown to more users on this algorithmic feed. Our findings are in accordance with TikTok's internal data that users spend the majority of time (nearly 70 %) on the For You page on the app (Stokel-Walker, 2020). With users spending less time on the Following feed, this feed provides a lower overall source of video views. Even when a person is following an account, those videos can still be shown on the For You page. The view, although coming from a follower, would still be marked as a view from the For You page. Our findings support other work showing that video views on TikTok are less dependent on the number of followers or subscribers as compared to other platforms like YouTube (Guinaudeau et al., 2022). While the number of followers can support the credibility of an account, a large number of followers is not required to reach a large viewership on TikTok, and having a high number of followers on TikTok does not guarantee equally high video views.
Short videos (∼ 20 s or less) on TikTok may have a higher potential to accumulate views, as they can easily be played in a “loop” like a GIF, but our data suggest that users are more likely to engage and interact with longer (> 60 s) educational science videos (Fig. 8). Even though some of these longer videos did not perform particularly well in terms of view counts (Fig. 6), they still tended to have relatively high engagement rates. Videos < 20 s had an average engagement rate of 6.5 % for likes, whereas videos between 40 s and 2 minutes had an average engagement rate of 10 % for likes. While it is suspected that higher engagement rates on TikTok videos lead to higher views (Klug et al., 2021), we did not observe any clear relationship between the number of video views and the engagement rate (Fig. 6). We found that there was a strong positive correlation between the number of views and the engagement rate of likes only for our most highly viewed videos (videos with > 90 000 views). High engagement rates on videos with lower view counts may come from people who are following the account and have an expressed interest in the subject.
The lack of any discernible relationship between the average view duration of a video and the engagement rate (Fig. 7) demonstrates that these two factors are not coupled and suggests that a video likely needs both a high engagement rate and a high view duration to be promoted within algorithmic feeds. Our top 10 most-viewed videos had an average view duration of 58 % and an average engagement rate of 11 % for likes (Table 2), which is greater than the average view duration of 44 % and 10 % likes across all of our videos. Unlike platforms like YouTube, where users select which video to view, users on TikTok choose whether to continue viewing a video they were automatically shown. While some highly interested users may watch the majority of the video and engage with it, if too many users quickly scroll away, it will negatively impact the average view duration of the video and its reach. If the intent of the science content is to maximize the engagement level from the viewer, then producing longer (> 60 s) lecture-style videos is preferable. However, the reach of the video may be sacrificed with longer videos if too many users scroll away from the video too quickly. Thus, the communication objectives should dictate what video type and duration is used.
Unlike platforms such as Twitter, where users may search for a specific hashtag to view content related to a topic (Chang and Iyer, 2012), viewer behavior in regard to educational science content on TikTok largely does not entail searching for specific hashtags to view content, unless related to a specific newsworthy event. On average, only 0.02 % of our video views came directly from hashtag searches. Thus, hashtags appear most useful in categorizing content, which may aid in its algorithmic discovery on the For You page – although the factors used in TikTok's algorithm have not been publicly disclosed. The use of a hashtag itself will not necessarily determine the popularity of a video, but rather, the hashtag is reflective of the content and subject matter of the video.
We also found that there was little relationship between the time a video was posted and how well it performed (Figs. 2, 9d). Post time optimization is the concept of posting social media content at a time when most users or followers are active and online and likely to see the content, thus increasing its potential reach. As the majority of our account's followers are located within the United States, we focused our posting during daytime hours within the US before followers would log off for the night. However, it would be interesting, especially if wanting to attract an international audience, to see how videos perform if they are posted during nighttime hours in the US. We anticipate that videos should be posted at a time local to when the desired or majority audience is primarily online.
7.2 Generating high video reach and engagement
While intrinsic features such as the length of the video may impact engagement metrics, the content of the video itself is an equally important consideration when attempting to reach a wide audience and generate high engagement. Based on our most-viewed videos (Table 2), we found that videos with the highest reach focused on recent newsworthy events (e.g., an earthquake) or discussed specific location-based geology. These findings support pedagogical research that suggests that recent, real-world incident examples should be included when teaching geoscience or environmental science topics to increase student engagement and interest (Singh et al., 2022).
Given our organizational missions, a high percentage of our video content focused on earthquakes and seismology, with all notable recent earthquakes being covered in GMV videos. These videos generated high interest by providing real-time information about earthquakes in the news, shown in a data visualization format that was likely novel to the public. User comments on GMV videos typically expressed how it was a unique, interesting visualization that they had not seen before. Additionally, by showing the motion recorded on seismometers across North America, where the vast majority of our followers are located, users in those areas were able to view how the ground moved near them, adding a level of personal, location-based interest. User comments also often expressed interest in the distribution of seismic instruments in North America.
We also found high reach and engagement with videos covering other relevant, newsworthy geology topics. For example, we produced videos covering the January 2022 Hunga Tonga-Hunga Ha`apai volcanic eruption and the anniversary of the January 1700 Cascadia earthquake and tsunami. These videos were our eleventh and eighth most-viewed videos, respectively, and were presented in a “lecture style” that primarily used image overlays. Comments left on these videos typically expressed that the users enjoyed the overview of information and how it was conveyed. The Hunga Tonga video was also shown to a wider international audience, with only 66 % of views coming from users located in the United States. Thus, if the focus of the video is on a specific international location or event, the video may be served to a broader audience. Research from educational geoscience videos on YouTube also suggests that short, timely videos about natural hazards are useful for engaging the public, especially those who live near where the hazards occur (Wang et al., 2022).
Videos describing geologic processes or features were most successful when they were tied to a specific, recognizable location. These videos were done in a “lecture style”, typically using “green screen” backgrounds and image overlays. Based on user comments, videos that were about a geologic feature in a specific location that were tagged with location indicators (e.g., #Hayward #California; #Hollister #California) were shown to many people who live in those cities. Although these users may not have previously interacted with or shown interest in geoscience content, we hypothesize that location-based information was used to deliver these videos to their For You page. Based on these video comments, the high engagement was generated in part by users from those geographic locations. Many commented that they were from the locations being covered; some recognized features in the town they were familiar with, and others learned something new and interesting about the geology of where they live.
In spite of these data, there is still complexity in understanding why certain videos perform better than others. For example, we produced two demonstration videos using food as analogs for geologic concepts. A video using spaghetti strands to demonstrate earthquake magnitude received 305 500 views and was our third most-viewed video (Table 2), while a video using Halloween candy bars to demonstrate types of faults received only 840 views and was our fourth least-viewed video (Table 3). Both of these videos presented concepts that were made easy for the viewer to understand by using common food items, and they were both posted on the same day of the week (Friday) and before noon MST (19:00 UTC). It is possible that for demonstration videos like these – which are more analogous to chemistry or physics content showing experiments – that a shorter video duration is better for achieving high reach and engagement. The earthquake spaghetti video was 34 s long, while the candy bar faults video was 59 s long. A viewer may be more likely to watch a longer lecture-style video but may prefer shorter, dynamic demonstration videos.
7.3 Gender of viewers and target audiences
Although we used the hashtags #WomenInSTEM and #WomenInScience on a number of videos, the majority of the Terra Explore account's followers remained male (∼ 64 % male). Given the fact that 61 % of users on TikTok are female (Statista Research Department, 2021), the gender breakdown of our followers is not representative of the demographics of TikTok users. The large percentage (25 %) of TikTok users that are under the age of 19 (Statista Research Department, 2022a) represents a critical demographic for maintaining interest in STEM. Research has shown that STEM interest begins to decline in middle school (ages 11–13), especially for girls (Archer et al., 2013; Riegle-Crumb and Morton, 2017; Sadler et al., 2012). Additionally, many students have little exposure to the geosciences during their primary and secondary education (grades K–12 in the US) (Dodick and Orion, 2003; Lewis and Baker, 2010; Ridky, 2002), which means that young girls are often left without geoscience role models. Through TikTok, we can engage with this critical demographic and hope to inspire young women to continue an interest in pursuing STEM and to see themselves as future STEM professionals.
However, the presentation of material by female scientists and the use of hashtags like #WomenInSTEM or #WomenInScience on TikTok may not be enough to gain female followers and viewership; the content itself may also have to focus on gender to be shown on women's For You pages. Experience from the lead author's personal TikTok account suggests that women may be more likely to receive videos about gender discrimination and gender disparity on their For You page than educational science content, even if they are interested in science. The lead author made a video on their personal TikTok account discussing how their follower base had become overwhelmingly male (75 % male followers) and used the #WomenInSTEM hashtag. The video gained wide female viewership, leading to a large increase in followers and flipping the percentage of followers to 86.1 % female. The second author also had a similar experience on their personal TikTok after making a series of posts about the IF/THEN organization and International Women's Day, with male following decreasing from 65 % to 17 %.
As TikTok did not provide information about the age of followers or viewers for videos posted prior to August 2022, we are unable to evaluate the full demographics of who our videos reach. Future work may benefit from creating and analyzing new videos where the gender percentage and age of viewers are reported or from using the paid “promote” feature that allows accounts to target specific demographics.
7.4 Ethics of TikTok data usage
When conducting research on social media platforms, it is necessary to address the ethical issues related to privacy, anonymity, and consent of human subjects (Vitak et al., 2016). Kanthawala et al. (2022) discuss the specific ethical considerations related to research on TikTok, given its heavier dependence on algorithmic curation and its younger user base. More so than other social media platforms, TikTok has faced scrutiny over the data that it collects from its users and user security. TikTok has previously paid USD 92 million to settle dozens of lawsuits that allege that users' personal data was tracked and sold to advertisers in violation of state and federal law (Allyn, 2021). Additionally, there has been scrutiny over the biometric data, including “faceprints” and “voiceprints”, that TikTok can now collect from users (McCluskey, 2021).
According to TikTok's privacy policy, TikTok collects information that the user provides when creating an account, such as their name, age, and email, as well as information from other sources, such as linked social media accounts and third-party services, and device information, including the user's approximate location (TikTok, 2021b). By creating a user account and agreeing to the terms and conditions, TikTok users provide their consent to have their information collected. However, many users are unlikely to read the privacy policy when creating an account and will not be aware of what they are consenting to.
Although TikTok provides analytical information about the gender breakdown of an account's followers, users do not provide information on their gender when registering for an account. We hypothesize that TikTok either acquires gender information through connected social media accounts or assumes the gender of an account based on a user's activity on the app. We are therefore unable to determine how accurate the information provided on the gender of followers is and whether users are aware that this information is assumed or collected on their behalf. However, we have no reason to believe that this information would be inaccurate due to TikTok's heavy data mining and the fact that this same demographic information is also provided to million-dollar corporations for targeted advertising campaigns.
The information and data we analyze in this study are restricted to video view duration and engagement metrics and are not related to in-depth personal user information that TikTok may collect. We do not evaluate or analyze the individual followers of the Terra Explore account or include specific comments from any users, providing full anonymity. The data on video views, likes, comments, and shares are fully publicly available to all users, and only total cumulative play time, average duration the video was watched, percentage of viewers who watched the full video, and the percentage of video views by section and region is private to the account user. Therefore, the data used are largely public, and there is minimal risk to the individual users from this research. While TikTok as a platform may have larger ethical concerns that are beyond the scope of this study, we argue that the data used in this research are ethical.
7.5 Potential for science communication on TikTok
Data collected over this 4-month time span demonstrates that TikTok provides significant potential for the reach and growth of science communication. As a brand-new account, the second video we posted gained over 165 000 views within the first few days and now has over 370 000 views. The algorithm-driven (rather than follower-driven) nature of TikTok creates a low barrier of entry for new creators. An account does not have to focus on creating a large following in order to achieve a wide reach. Additionally, there are no materials required to produce content other than a mobile smartphone with a camera. However, given that views from the Following feed constitute a low overall percentage of views, there may be pressure to constantly produce “viral” videos that are shown widely on the For You page. Having a large number of followers does not guarantee that a video will be seen by a large number of people.
Despite potential shortcomings, TikTok presents an opportunity to deliver educational science videos to wide audiences with relatively little effort. All six Terra Explore videos related to lidar were cross-posted on OpenTopography's YouTube channel as “Shorts”, which is YouTube's TikTok-like short-form video category. The OpenTopography YouTube channel had 1900 subscribers at this time. These videos received an average of only 35 views on YouTube, while the same videos received between 2422 and 133 500 views on TikTok. Starting in February 2022, we began cross-posting GMV videos for recent earthquakes on IRIS's Instagram account as “Reels”, Instagram's TikTok-like video category. The IRIS Instagram account has approximately 2300 followers as of fall 2022. The exact same videos received, on average, 5 times more views on TikTok than they did on Instagram. The vast discrepancy in views of the exact same videos posted on different platforms highlights the benefits of TikTok's recommendation algorithm in reaching a wide audience.
A potential challenge is that TikTok videos require an engaging, charismatic video presenter: two people could create the same video, but one video might perform significantly better if one host has a more natural, charismatic presentation style. We have not evaluated how this factor impacts video performance. In addition to the content of the video itself, practice in the presentation style of videos (which is beyond the scope of this study) is also an important component for science communicators to consider. Additionally, we acknowledge that TikTok's recommendation algorithm may change over time, although we do not anticipate such significant changes would occur in such a short amount of time that it would invalidate our results. Future studies will benefit from continued analysis of video content as well as a more qualitative evaluation of the impact and effectiveness of the science communication.
We thus recommend the following for the best chances of high reach and engagement with science communication on TikTok.
-
Produce lecture-style videos using green screen and image overlay effects that are approximately 60 s or longer in duration.
-
Produce demonstration or experiment-style videos that are ≤ 30 s in duration.
-
Choose video topics that can be related to recent newsworthy events or are tied to a specific place or location.
-
Include gender-related topics to reach a wider female audience.
-
Select hashtags that are relevant to the video topic, especially ones including locations to provide additional algorithmic video context.
-
Pay attention to videos that receive the majority of their views from the For You page and work to replicate those qualities.
As we continue to run the Terra Explore account, we plan to expand the scope of the geoscience topics that we cover and to continue analyses of how to best maximize reach and engagement from these videos. While the geoscience content of our videos has been largely focused on earthquakes thus far, we plan to include discussions of other natural hazards like volcanic eruptions, floods, and landslides. This expansion segues into an opportunity to produce content related to climate and climate change. Encouraging science curiosity helps to neutralize polarization on topics like climate change (Kahan et al., 2017), and TikTok provides an ideal platform to promote such curiosity.
While all of our videos analyzed thus far were created in home offices, we believe producing content from the field could generate high video views and user engagement. Instead of merely showing photos, field-based videos could present and highlight seismic or GPS instruments and their installation and maintenance, geologic features you can see in the field, or how drones are used in geoscience, among many other possibilities. Five field-based videos that we created between April to September 2022, after our analytical study period, received between 3620 and 779 100 views on TikTok. Given the more costly and time-intensive nature of producing videos on location, a full analysis of their metrics would be necessary to see if they have higher reach and engagement than similar videos produced in home offices.
To better reach target audiences, like young women and girls, and to improve the overall diversity of scientists shown in popular media, we would like to produce a “Meet the Scientist” video series to highlight female and non-binary geoscientists, sharing both their research and experiences. These types of videos would complement and expand on the IF/THEN “Women in Geoscience” video series available on the IRIS YouTube channel that features women in the geosciences sharing their work and interests. The geosciences remain one of the least racially and ethnically diverse out of all the STEM fields (Bernard and Cooperdock, 2018), and “Meet the Scientist” interviews featuring underrepresented scientists on TikTok will help to increase the visibility of minoritized scientists and to show the broad diversity of scientists and careers that exist in geoscience.
TikTok offers significant potential for the reach and growth of science communication content. TikTok functions primarily on a model of algorithmic recommendations rather than a follower-based model, which provides a low barrier to entry for new creators. Although the exact nature of the TikTok algorithm is unknown and therefore somewhat challenging terms of in reaching target audiences, new age and gender analytics that were released in August 2022 may provide additional insight into the demographics that are engaging with content. In the assessment of our geoscience content, lecture-style videos that were approximately one-minute long yielded the highest reach and engagement. Video topics that discussed recent newsworthy events (i.e., earthquakes) or that discussed specific location-based geology resulted in the highest reach and engagement. Shorter-form content (< 30 s) did not perform as well, unless it was a demonstration-style video, which would be more analogous to the physics and chemistry experiments that are commonly seen on TikTok. Unlike other platforms, user behavior on TikTok does not entail searching for or browsing specific hashtags to view educational science videos. Rather, videos are predominantly viewed via the For You page, and hashtags provide a way to categorize and describe content – information which may or may not be used by TikTok's AI to show the video to audiences. Although this study focuses on the geosciences, we anticipate that our findings will be broadly applicable to other scientific disciplines and will allow science communicators to achieve success in reaching broad audiences.
The video data analyzed in this study are accessible at https://doi.org/10.6084/m9.figshare.20069333 (Zawacki, 2022).
The supplement related to this article is available online at: https://doi.org/10.5194/gc-5-363-2022-supplement.
The Terra Explore videos analyzed here were created by EEZ and WB as well as by SJ. DJC provided project administration and coordination. EEZ collected and analyzed the data and wrote the primary draft. WB, SJ, and DJC contributed to the writing, review, and editing.
The contact author has declared that none of the authors has any competing interests.
The data used in this study are largely public, and there is minimal risk to the individual users from this research. While TikTok as a platform may have larger ethical concerns that are beyond the scope of this study, we argue that the data used in this research are ethical.
Publisher's note: Copernicus Publications remains neutral with regard to jurisdictional claims in published maps and institutional affiliations.
We thank two anonymous reviewers for their helpful comments on an earlier version of this manuscript. We thank Zhiang Chen for assistance with the correlation analyses. We thank Christopher Crosby for project guidance.
This research has been supported by the National Science Foundation (grant nos. 1724794, 1948997, 1948994, and 1948857).
This paper was edited by Solmaz Mohadjer and reviewed by two anonymous referees.
Allyn, B.: TikTok to Pay $92 Million to Settle Class-Action Suit over “Theft” of Personal Data, NPR, https://www.npr.org/2021/02/25/971460327/tiktok-to-pay-92-million-to-settle-class-action-suit-over-theft-of-personal-data (last access: 14 June 2022), 2021.
Archer, L., DeWitt, J., Osborne, J., Dillon, J., Willis, B., and Wong, B.: “Not girly, not sexy, not glamorous”: Primary school girls' and parents' constructions of science aspirations, Pedagogy Cult. Soc., 21, 171–194, https://doi.org/10.1080/14681366.2012.748676, 2013.
Azman, A. N., Rezal, N. S. A., Zulkeifli, N. Y., Mat, N. A. S., Saari, I. S., and Ab Hamid, A. S.: Acceptance of TikTok on the Youth towards Education Development, Borneo Int. J., 4, 19–25, 2021.
Basch, C. H., Yalamanchili, B., and Fera, J.: #Climate Change on TikTok: A Content Analysis of Videos, J. Community Health, 47, 163–167, https://doi.org/10.1007/s10900-021-01031-x, 2022.
Bernard, R. E. and Cooperdock, E. H.: No progress on diversity in 40 years, Nat. Geosci., 11, 292–295, https://doi.org/10.1038/s41561-018-0116-6, 2018.
Briskman, J.: Sensor Tower's Q1 2020 Data Digest: Exploring COVID-19's Impact on the Global App Ecosystem, Sensor Tower, https://sensortower.com/blog/q1-2020-data-digest (last access: 15 February 2022), 2020.
Chang, H. C. and Iyer, H.: Trends in Twitter hashtag applications: Design features for value-added dimensions to future library catalogues, Libr. Trends, 61, 248–258, 2012.
Côté, I. M. and Darling, E. S.: Scientists on Twitter: Preaching to the choir or singing from the rooftops?, Facets, 3, 682–694, https://doi.org/10.1139/facets-2018-0002, 2018.
Dodick, J. and Orion, N.: Geology as an historical science: Its perception within science and the education system, Sci. Educ., 12, 197–211, https://doi.org/10.1023/A:1023096001250, 2003.
Draganić, K., Marić, M., and Lukač, D.: An application of TikTok in higher education, in: E-Business Technologies Conference Proceedings, Belgrade, Serbia, 10–11 June 2021, 114–119, https://ebt.rs/journals/index.php/conf-proc/article/view/75 (last access: 11 February 2022), 2021.
Escamilla-Fajardo, P., Alguacil, M., and López-Carril, S.: Incorporating TikTok in higher education: Pedagogical perspectives from a corporal expression sport sciences course, J. Hosp. Leis. Sports Tour. Educ., 28, 100302, https://doi.org/10.1016/j.jhlste.2021.100302, 2021.
Feldkamp, J.: The rise of TikTok: The Evolution of a social media platform during COVID-19, in: Digital Responses to Covid-19, edited by: Hovestadt, C., Recker, J., Richter, J., and Werder, K., Springer, Cham, 73–85, https://doi.org/10.1007/978-3-030-66611-8_6, 2021.
Guinaudeau, B., Vottax, F., and Munger, K.: Fifteen Seconds of Fame: TikTok and the Supply Side of Social Video, Comp. Commun. Res., 4, 463–485, https://doi.org/10.5117/CCR2022.2.004.GUIN, 2022.
Habibi, S. A. and Salim, L.: Static vs. dynamic methods of delivery for science communication: A critical analysis of user engagement with science on social media, PloS One, 16, e0248507, https://doi.org/10.1371/journal.pone.0248507, 2021.
Hautea, S., Parks, P., Takahashi, B., and Zeng, J.: Showing they care (or don't): Affective publics and ambivalent climate activism on TikTok, Soc. Media Soc., 7, 20563051211012344, https://doi.org/10.1177/20563051211012344, 2021.
Hayes, C., Stott, K., Lamb, K. J., and Hurst, G. A.: “Making every second count”: utilizing TikTok and systems thinking to facilitate scientific public engagement and contextualization of chemistry at home, J. Chem. Educ., 97, 3858–3866, https://doi.org/10.1021/acs.jchemed.0c00511, 2020.
Hight, M. O., Nguyen, N. Q., and Su, T. A.: Chemical anthropomorphism: acting out general chemistry concepts in social media videos facilitates student-centered learning and public engagement, J. Chem. Educ., 98, 1283–1289, https://doi.org/10.1021/acs.jchemed.0c01139, 2021.
Hilary, I. O. and Dumebi, O. O.: Social Media as a Tool for Misinformation and Disinformation Management, Ling. Cult. Rev., 5, 496–505, https://doi.org/10.21744/lingcure.v5nS1.1435, 2021.
Jahng, M. R. and Lee, N.: When scientists tweet for social changes: Dialogic communication and collective mobilization strategies by Flint water study scientists on Twitter, Sci. Commun., 40, 89–108, https://doi.org/10.1177/1075547017751948, 2018.
Kahan, D. M., Landrum, A., Carpenter, K., Helft, L., and Hall Jamieson, K.: Science curiosity and political information processing, Polit. Psychol., 38, 179–199, https://doi.org/10.1111/pops.12396, 2017.
Kanthawala, S., Cotter, K., Foyle, K., and DeCook, J. R.: It's the Methodology For Me: A Systematic Review of Early Approaches to Studying TikTok, in: Proceedings of the 55th Hawaii International Conference on System Sciences, Online, 4–7 January 2022, https://hdl.handle.net/10125/79716, last access: 26 August 2022.
Kirchhoff, D.: More Tok on the Clock: Introducing longer videos on TikTok, TikTok Newsroom, https://newsroom.tiktok.com/en-us/longer-videos (last access: 14 February 2022), 2021.
Klug, D., Qin, Y., Evans, M., and Kaufman, G.: Trick and please. A mixed-method study on user assumptions about the TikTok algorithm, in: 13th ACM Web Science Conference 2021, Online, 21–25 June 2021, https://doi.org/10.1145/3447535.3462512, 2021.
Lewis, E. B. and Baker, D. R.: A call for a new geoscience education research agenda, J. Res. Sci. Teach., 47, 121–129, https://doi.org/10.1002/tea.20320, 2010.
McCluskey, M.: TikTok Has Started Collecting Your “Faceprints” and “Voiceprints.” Here's What It Could Do With Them, Time, https://time.com/6071773/tiktok-faceprints-voiceprints-privacy/ (last access: 14 June 2022), 2021.
Radin, A. G. and Light, C. J.: TikTok: An emergent opportunity for teaching and learning science communication online, J. Microbiol. Biol. Educ., 23, e00236-21, https://doi.org/10.1128/jmbe.00236-21, 2022.
Ridky, R.: Why We Need a Corps of Earth Science Educators, Geotimes, 47, 16–19, 2002.
Riegle-Crumb, C. and Morton, K.: Gendered expectations: Examining how peers shape female students' intent to pursue STEM fields, Front. Psychol., 8, 329, https://doi.org/10.3389/fpsyg.2017.00329, 2017.
Sadler, P. M., Sonnert, G., Hazari, Z., and Tai, R.: Stability and volatility of STEM career interest in high school: A gender study, Sci. Educ., 96, 411–427, https://doi.org/10.1002/sce.21007, 2012.
Schmitt, M. and Jäschke, R.: What do computer scientists tweet? Analyzing the link-sharing practice on Twitter, PloS One, 12, e0179630, https://doi.org/10.1371/journal.pone.0179630, 2017.
Sensor Tower: Q1 2022: Store Intelligence Data Digest, Sensor Tower, https://go.sensortower.com/rs/351-RWH-315/images/Sensor-Tower-Q1-2022-Data-Digest.pdf, last access: 26 August 2022.
Shu K., Wang S., Lee D., and Liu H.: Mining Disinformation and Fake News: Concepts, Methods, and Recent Advancements, in: Disinformation, Misinformation, and Fake News in Social Media, edited by: Shu, K., Wang. S., Lee, D., and Liu, H., Springer, Cham, https://doi.org/10.1007/978-3-030-42699-6_1, 2020.
Singh, A., Khandaker, N., Zarine, A., Robbins, K. H., Jackson, S., and Ahmed, S.: Assessing student performance and interest from the start of the COVID-19 pandemic to present using engagement, attendance, and grades as indicators, GSA Connects 2022, Denver, Colorado, USA, 9–12 October 2022, https://doi.org/10.1130/abs/2022AM-379409, 2022.
Smith, A.: “Wow, I didn't know that before; thank you”: How scientists use Twitter for public engagement, J. Prom. Commun., 3, 320–339, 2015.
Smith, B.: How TikTok Reads Your Mind, New York Times, https://www.nytimes.com/2021/12/05/business/media/tiktok-algorithm.html (last access: 16 March 2022), 2021.
Statista Research Department: Distribution of monthly active TikTok users in the United States as of March 2021, by gender, Statista, https://www.statista.com/statistics/1095201/tiktok-users-gender-usa/ (last access: 14 February 2022), 2021.
Statista Research Department: Distribution of TikTok users in the United States as of September 2021, by age group, Statista, https://www.statista.com/statistics/1095186/tiktok-us-users-age/, last access: 14 February 2022a.
Statista Research Department: Number of first-time TikTok installs from 2nd quarter 2016 to 4th quarter 2021, Statista, https://www.statista.com/statistics/1078692/china-tiktok-worldwide-downloads-quarterly/, last access: 16 March 2022b.
Stokel-Walker, C.: Inside TikTok's latest big pitch to advertisers with new numbers showing time spent on the app and engagement metrics, Business Insider, https://www.businessinsider.com/leaked-tiktok-slides-engagement-time-spent-activity-2020-9 (last access: 8 February 2022), 2020.
Thoensen, B.: Investing to help our community #LearnOnTikTok, TikTok Newsroom, https://newsroom.tiktok.com/en-us/investing-to-help-our-community-learn-on-tiktok (last access: 8 February 2022), 2020.
TikTok: How TikTok Recommends Videos #ForYou, TikTok Newsroom, https://newsroom.tiktok.com/en-us/how-tiktok-recommends-videos-for-you/ (last access: 8 February 2022), 2020.
TikTok: Thanks a billion!, TikTok Newsroom, https://newsroom.tiktok.com/en-us/1-billion-people-on-tiktok (last access: 8 February 2022), 2021a.
TikTok: Privacy Policy, TikTok Legal, https://www.tiktok.com/legal/privacy-policy-us?lang=en (last access: 14 June 2022), 2021b.
Vitak, J., Shilton, K., and Ashktorab, Z.: Beyond the Belmont principles: Ethical challenges, practices, and beliefs in the online data research community, in: Proceedings of the 19th ACM Conference on Computer-Supported Cooperative Work & Social Computing, San Francisco, California, USA, 27 February–2 March 2016, 941–953, https://doi.org/10.1145/2818048.2820078, 2016.
Wang, N., Clowdus, Z., Sealander, A., and Stern, R.: Geonews: timely geoscience educational YouTube videos about recent geologic events, Geosci. Commun., 5, 125–142, https://doi.org/10.5194/gc-5-125-2022, 2022.
Zawacki, E.: TikTokData.xlsx, Figshare [data set], https://doi.org/10.6084/m9.figshare.20069333, 2022.
Zeng, J., Schäfer, M. S., and Allgaier, J.: Reposting “till Albert Einstein is TikTok famous”: The memetic construction of science on TikTok, Int. J. Commun., 15, 3216–3247, https://doi.org/10.5167/uzh-205429, 2020.
- Abstract
- Introduction
- Basics of TikTok
- Educational landscape on TikTok
- Account and video creation
- Methods
- Results
- Discussion
- Future plans
- Conclusions
- Data availability
- Author contributions
- Competing interests
- Ethical statement
- Disclaimer
- Acknowledgements
- Financial support
- Review statement
- References
- Supplement
Terra Explore. We produced 48 educational geoscience videos and evaluated each video’s performance. Our most-viewed videos received nearly all of their views from TikTok’s algorithmic recommendation feed, and the videos that received the most views were related to a recent newsworthy event (e.g., earthquake) or explained the geology of a recognizable area.
- Abstract
- Introduction
- Basics of TikTok
- Educational landscape on TikTok
- Account and video creation
- Methods
- Results
- Discussion
- Future plans
- Conclusions
- Data availability
- Author contributions
- Competing interests
- Ethical statement
- Disclaimer
- Acknowledgements
- Financial support
- Review statement
- References
- Supplement