the Creative Commons Attribution 4.0 License.
the Creative Commons Attribution 4.0 License.
 | 06 Oct 2022
Learning outcomes, learning support, and cohort cohesion on a virtual field trip: an analysis of student and staff perceptions
Jessica H. Pugsley
Lauren Kedar
Sarah R. Ledingham
Marianna Z. Skupinska
Tomasz K. Gluzinski
Megan L. Boath
The rise seen in the use of the virtual field trip in 2020 and 2021 due to the global COVID-19 pandemic was unprecedented. Virtual field trips aim to replicate the learning outcomes and experiences of actual field trips by providing a digital alternative to in-field courses. They provide valuable opportunities for those unable to visit the field and alternative learning experiences for those that can. However, understanding their efficacy in terms of learning outcomes, the effectiveness of the learning support offered, and cohort cohesion generally remains untested. Here, we show how negative aspects of a virtual field trip both pre- and post-course are countered by positive outcomes in terms of the breadth of learning outcomes and experience. As part of our analysis, we tested methods to mitigate barriers to inclusion and learning on a virtual field trip, including internet connectivity and hardware access; the use of printed workbooks; and limitations to interaction, support, and cohort cohesion. Our results show that, although negative perceptions (as evidenced by questionnaire responses) are dominant, with 71 % of the 27 pre-course respondents and 88 % of the 21 post-course respondents commenting on these aspects across both student and staff cohorts, positive aspects of virtual field trips (43 %–57 %) also feature highly. Students show a positive shift in their perception of online teaching and learning over the course, with positive comments moving from 19 % pre-course to 71 % post-course, whereas positive comments by staff are low both pre- and post-course (at 14 %). Printed workbooks, staff-to-student ratios, and interaction are received positively. Overall, we find that negative perceptions of virtual field trips pre- and post-course exist but that both students and staff also identify positive elements, including the breadth of learning outcomes, particularly regarding data synthesis and analysis. We suggest ways to learn from these findings in order to design virtual field trips that deliver effectively in blended learning environments for the benefit of all.
- Article
(6250 KB) - Full-text XML
-
Supplement
(1903 KB) - BibTeX
- EndNote


Geological fieldwork in the years 2020 and 2021 was significantly impacted by the COVID-19 global pandemic (Arthurs, 2021; Rotzien et al., 2021). In the UK, the pandemic resulted in the country going into “lockdown”, an effective stay-at-home order, restricting travel and social interaction, from late March 2020 (Iacobucci, 2020). Other countries were similarly affected. The result of this situation was that no geological fieldwork could be undertaken; thus, many undergraduate programmes that were heavily reliant on summer fieldwork were placed in jeopardy. For undergraduate students at the end of their penultimate BSc year, this placed them (and staff) in the difficult position of missed credits from Easter and early-summer field trips. With no likelihood of a summer mapping camp (or dissertation), students were on track to enter their final year with a significant credit deficit and minimal field experience.
Prior to the pandemic, virtual outcrops and virtual learning environments had slowly been developing over recent decades (Hurst, 1998; Tuthill and Klemm, 2002; Pringle et al., 2004; Trinks et al., 2005; Buckley et al., 2010; Çaliskan, 2011; Tibaldi et al., 2020), with increasing use and application in research (Casini et al., 2016; Cawood et al., 2017), teaching (Tibaldi et al., 2020; Bond and Cawood, 2021), and conservation (Martínez-Graña et al., 2013; Pasquaré Mariotto et al., 2021). However, prior to the above-mentioned lockdown situation, the effectiveness of virtual outcrops and virtual field trips had been little evaluated (compared with actual in-field experiences); for an early example, the reader is referred to Dohaney et al. (2012). Nevertheless, with an almost 100 % change in the sector from actual to virtual field trips overnight in early 2020, there are now a growing number of publications and papers in this area (Mead et al,. 2019; Whitmeyer and Dordevic, 2021; Bond and Cawood, 2021; Bos et al., 2021), of which papers in this volume are an example.
At the University of Aberdeen, UK, as at many global academic institutions, staff moved quickly to replace field training with virtual alternatives. In many respects, Aberdeen was well placed with existing expertise and resources in virtual outcrop model creation and use as well as with open-access models that could be used by the broader geological community (e.g. eRocK, https://www.e-rock.co.uk/, last access: 23 September 2022, see Cawood and Bond, 2019, and v3Geo, https://v3geo.com/, last access: 23 September 2022 see Buckley et al., 2022); in addition, Aberdeen possessed previous expertise in using online resources, such as the UK Virtual Microscope (http://www.virtualmicroscope.org/, last access: 23 September 2022, see Herodotou et al., 2018) and the Virtual Seismic Atlas. However, concerns remained regarding the efficacy of multiple aspects of online learning and virtual field trips.
Rather than focusing on the design and delivery of the geological elements of the virtual field trip, in this contribution we consider the issues of the effect of student and staff perceptions on learning outcomes, the provision of learning support, and cohort cohesion, with a view to learning to inform future virtual field trip delivery. An initial key concern was internet connectivity and digital infrastructure, which was pertinent to the course design and delivery; a subsequent concern was the lived experience of students in using online resources and learning through participation in a virtual field trip.
We were first interested in ensuring effective course design and examining the impact on student learning and student satisfaction/dissatisfaction with the course arising from the digital infrastructure. Internet connectivity and digital infrastructure have been identified as a barrier to education, with implications for equality, diversity, and inclusion (Laksana, 2021; Pearson and Reddy, 2021; Devkota, 2021; Ochieng and Gyasi, 2021); although many studies focused on these issues have been on developing countries, similar issues are found in the most advanced global economic countries (e.g. Sanders and Scanlon, 2021). Internet connectivity is essential for the delivery of online courses and for the real-time use of 3D virtual outcrop models during virtual field trips. In this regard, digital resources are particularly pertinent to the delivery of virtual field classes, as they can require significant internet speeds for live streaming. The rendering of 3D geological models also often requires “higher-end” graphics cards, causing specific challenges. Such digital capacities in education are an issue identified and outlined in detail by Abduvakhidov et al. (2021).
Our second focus – student perceptions of the challenges that they would face in completing a fully online virtual field course – was chosen because perceptions have important implications for learning ability and learning outcomes. Evidence from pedagogic studies show that student concerns around learning environments, cultures, and other stresses have an impact on learning ability and gains (Hess, 2002; Christie et al., 2008; Xia, 2009). Effectively, being placed in an unfamiliar environment increases the mental load and reduces the capacity for engagement in learning. Pre-fieldwork anxiety has been demonstrated for students who are, for example, unfamiliar with fieldwork and/or the outdoors or for students who are concerned about the use of shared facilities on a field trip (Boyle et al., 2007; Stokes and Boyle, 2009). Although familiar in one sense, working from home during COVID-19 was unfamiliar and uncertain, as was the delivery of a new and alternative course in a novel format using new software at short notice. Novel space has the potential to distract student participants from achieving the learning outcomes of the virtual field trip (Orion and Hofstein, 1994). The online environment also presents different challenges to learning, including a lack of connection, the possible absence of the development of a learning community (sensu Tinto, 2008), and the possible absence of a positive emotional setting for learning (Cleveland-Innes and Campbell, 2012). We refer to these aspects as “cohort cohesion” (as described by Wathington et al., 2010). We were interested in the students' perceptions of how their learning in this unfamiliar environment was affected.
Similarly, our third focus considered staff perceptions of the programme and delivery challenges. We were interested to see if student perceptions pre-course mirrored those of staff, if likely challenges identified by staff and the associated mitigation strategies were apparent and effective, and we were also interested in evaluating how perceptions of staff and students changed over the course of the programme.
To evaluate the three above-mentioned foci, we designed three online surveys (see Supplement). Here, we reflect on the outcomes of the three surveys, discussing the implications for learning and teaching in new formats, drawing out the potential benefits and challenges of different approaches, and examining how staff and student perceptions changed.
After the lockdown was announced, a group of staff worked as a team over the subsequent 6-week period to develop a 5-week training programme that would directly replace a 2-week field trip. The original field trip was designed for penultimate-year undergraduate students, in the Northwest Highlands of Scotland, and had previously acted as precursor to their final-year 6-week individual mapping dissertation. Significant consideration was given to the length and format of the replacement online training, with a longer programme eventually favoured for inclusion purposes, e.g. students ill with COVID, students working in critical supply chain jobs, and students with caring responsibilities (schools and other facilities were closed). This allowed a format of two recorded “kick-off” sessions a week, essentially 10 work elements over the 5-week period, with drop-in sessions at various times, including some evening sessions, to accommodate the diversity of individual situations and availability within the student cohort.
An initial exercise was undertaken amongst the staff team to consider the learning outcomes of the “actual” field trip and how these mapped onto the possibilities for delivery in a virtual environment. The learning outcomes for the original field trip were as follows: seeing rocks in their context in the field; making detailed observations of rock outcrops and fabrics; collecting structural data; completing sedimentary logging; interpreting and analysing structural data; interpreting and analysing sedimentary logs; building and maintaining a field notebook; field sketching; interpreting field observations to make predictions; interpreting field observations to build a geological history; and synthesizing datasets to create maps, cross sections, and evolutionary understanding as well as to carry out analysis of palaeoenvironments. Through the series of activities designed, the staff team felt that all of the learning outcomes could be achieved, apart from the above-mentioned physical aspect of “seeing rocks in their context in the field”, although this could be done virtually. Alongside the geological learning outcomes was the consideration of how academic and peer support could be used in a virtual environment to best achieve the learning outcomes and build cohort cohesion to aid learning. These latter elements were in many ways more challenging; the logistics of effective learning strategies with the external factors and uncertainty related to delivery during the early weeks of the COVID-19 pandemic, including a 5-week-long programme with the potential for fragmented learning and limited cohort interaction, were concerns. Mitigation measures to address these concerns were built into the programme design. Further concerns included the internet connectivity of the students and staff required to attend and deliver the programme.
2.1 Internet access
The issue of the potential impact of internet connectivity was addressed immediately to inform course design and delivery. An initial questionnaire was conducted to test students' internet connection speeds, with respect to download speed, upload speed, and latency (through a linked testing service); to determine what computer hardware they had access to; and to find out about their daily availability over the duration of the course. We were also conscious that the students would be facing potentially new and additional challenges during the course; thus, we included a free-form question entitled “Other Issues” in which we asked students to “...highlight any other issues that you feel you may have in completing the work (e.g. childcare commitments, key-working, lack of quiet space/time to work – note that these are just examples, this list is not exhaustive). Please give as much information as possible as to how any issues raised will likely affect you.”. This initial questionnaire was completed by all students in the course.
Students participating in the course were based in locations across the UK and Europe. Tests of the students' internet quality (download speed, upload speed, and latency) established that the overall quality of internet in the student cohort was poor compared with published data from SPEEDTEST (https://www.speedtest.net/, last access: May 2021), using results obtained for global averages in May 2020, and similarly from Ofcom for the UK (https://www.ofcom.org.uk; last access: May 2021), using results obtained for May 2020; the reader is referred to Fig. 1a for an overview of the internet speed data. The average UK upload speed in May 2020 falls out with the upper quartile of student speeds, and the UK average download speed at that time was bettered by the only student with an ethernet cable, who had the fastest download speed in the cohort. It is worth noting that students were asked to test internet connectivity at a time during the day when they were likely to be attending the programme. We also recognized that home internet at the time was under significant stress, with the potential for several working adults on video calls during the daytime on one home internet connection.
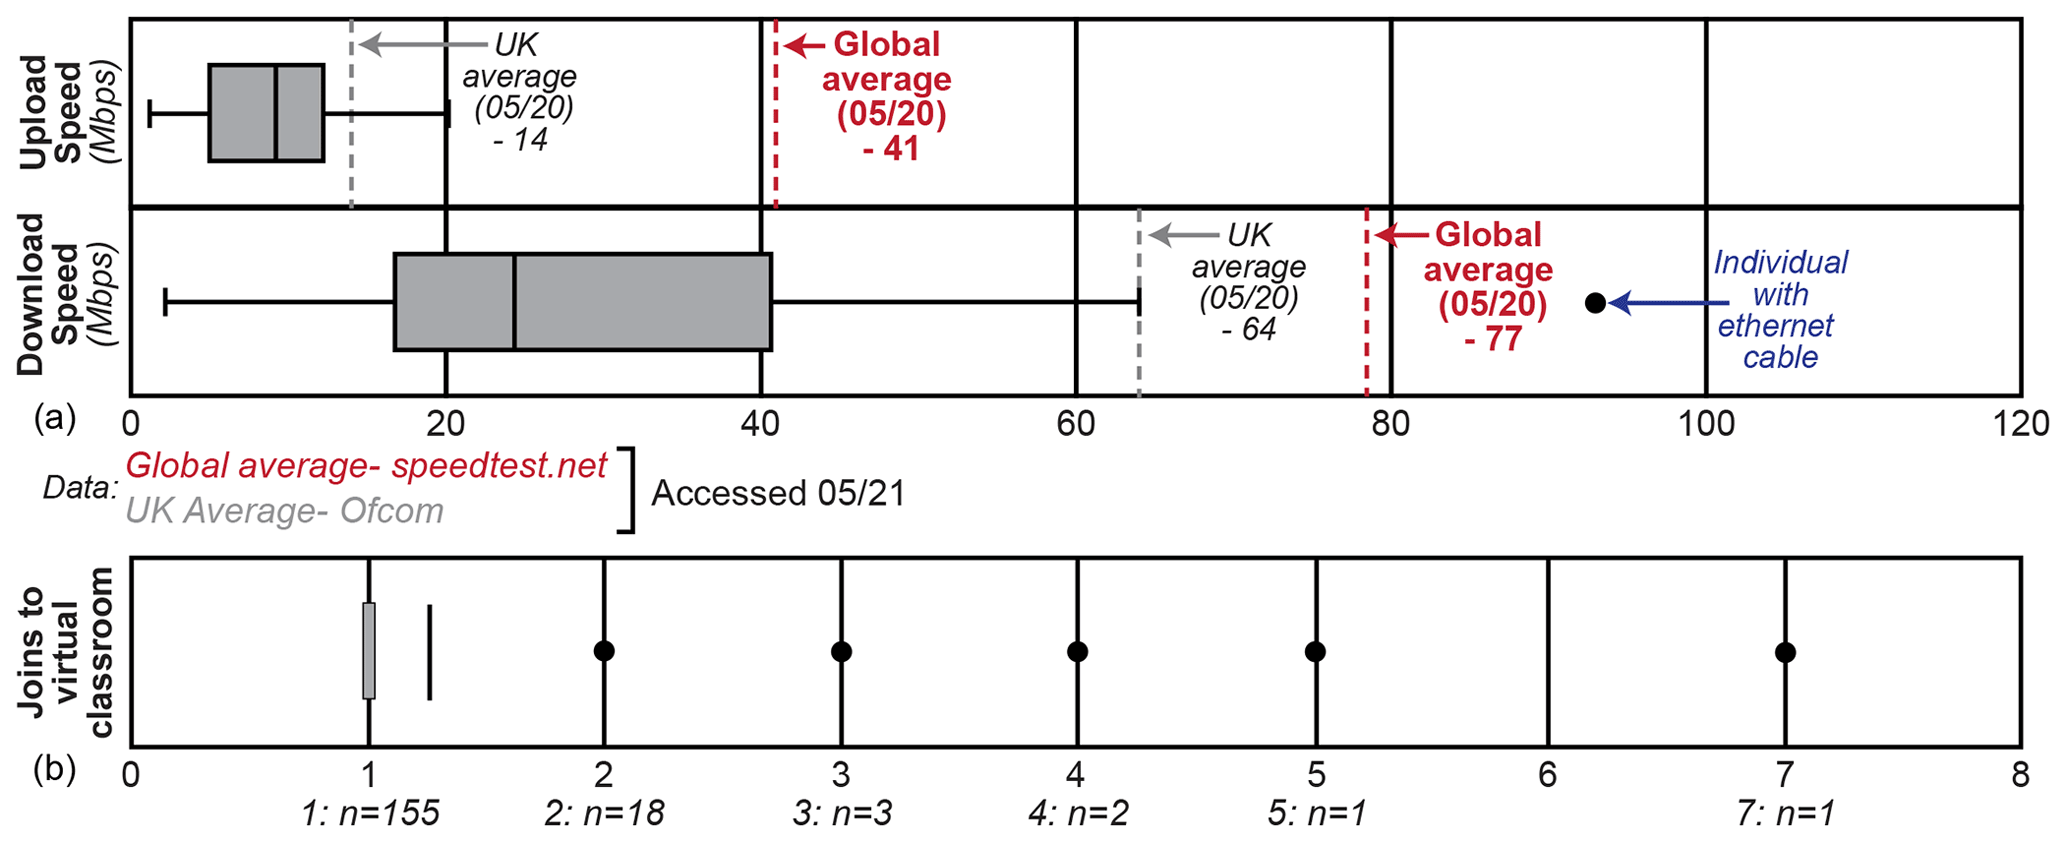
Figure 1Internet speed and connectivity data. (a) Student internet upload and download speeds, presented in megabits per second (Mbps) and plotted as full and interquartile ranges with the averages marked. The student cohort data are compared to UK and global averages for the same time period as the virtual field trip (May 2020). Note that the one student with an ethernet cable plots as an outlier with respect to download speeds. (b) Data from the online student classroom that summarize the number of joins per session to the virtual classroom to 22 live online sessions over the 5-week virtual field trip.
We also monitored connectivity during the live sessions, so that we could react dynamically to issues. It was clear from this monitoring that some participants had issues with connectivity, identified by a red poor-connection signal within the virtual classroom environment used for delivery. Evidence from the virtual classroom software suggests that these problems were, however, very limited, with most students connecting just once to live sessions (Fig. 1b). The data presented in Fig. 1b are for 22 live sessions over the duration of the 5-week virtual field trip. We assume that those joining once or twice are joining and leaving sessions at will, whereas those joining three or more times are having connectivity or software issues. Note that 155 of the 180 total joins to sessions were single joins, and 18 were double joins, with only 7 joins falling into the ≥3 category. This also implies that, for students who did on occasion experience issues, problems were not persistent over the virtual field trip.
A series of mitigation measures were designed into the course to minimize the potential impact of internet connectivity issues as well as to maximize the effectiveness of the hardware to which the students had access. Each live introductory session was recorded for student access after delivery. Similarly, question and answer sessions were also recorded. The only sessions not consistently recorded were smaller group sessions led by PhD students. A printed work booklet was sent to all students in advance of the course; it contained a timetable of activities, explanatory sheets for each session, information on formative and summative assessments, and session material (e.g. detailed photographs and maps). This helped mitigate potential internet and hardware issues, for example, to render 3D models and visualizing images; given that most of the students were working on laptops, with a single relatively small screen, it also allowed them to refer to material whilst engaging with the staff on a live video stream or looking at a virtual outcrop model. Some sessions required Google Earth, the session instructions (PDF format), virtual outcrop models, and detailed photographs; thus, access to some of that material in hard copy was useful, ensuring that more than one element could be considered at the same time.
2.2 Student availability and other issues
There was a range with respect to student availability, with some students undertaking essential-worker roles in critical-service sectors, whereas others were generally available. Other issues identified by the students were Wi-Fi variability, childcare, and the availability of a quiet working space; these issues were compounded by many students having returned to their family homes with multiple adults working from home (online) and/or the presence of younger siblings. Most of the mitigation measures that were put into place were focused on the length, frequency, and scheduling of sessions for the programme as well as the availability of session recordings for all, with clear supporting written explanations. The smaller group sessions were scheduled so that all students had live access to at least these sessions. The purpose of the small group sessions was, in-part, to allow a “safer” space (e.g. Gayle et al., 2013) in which students could ask questions in smaller groups and to a PhD student in order to breakdown potential issues around fear of speaking up in the larger full-class setting and to more senior staff members. Although, a “there's no such thing as a silly question” philosophy was imbued, the permeation and acceptance of such mitigation measures within student cohorts can be difficult.
3.1 Survey design
The main dataset analysed in this paper was sourced from two sets of online questionnaires completed by the students and staff participating in and delivering the course. Participation in the questionnaires was voluntary, and the University of Aberdeen ethical procedure was followed. The aim of the questionnaires was to inform our overarching research questions, which are as follows:
-
Did the participants and staff perceive that the learning outcomes were achieved?
-
Were effective measures put in place to support the learning outcomes and delivery?
-
Did the participants and staff perceive the peer–peer and academic support to be effective?
The first pre-course questionnaire focused on participants' perceptions of (i) the learning outcomes of the trip; (ii) the learning support (i.e. peer–peer and academic–student interactions); and (iii) some of the logistics and challenges associated with online distance learning, particularly virtual field trips. The questionnaire design and the statements for which perceptions were elicited were informed by the original field trip learning outcomes, and they were then further developed by staff discussions during the design of the programme that reflected concerns regarding the delivery of the learning outcomes and associated factors, such as cohort cohesion and logistics, and issues involved with virtual field trip delivery. The full set of the survey questions can be found in the Supplement. All of the questionnaires eliciting perceptions were answered anonymously.
The questionnaires started with two questions that elicited student and staff perceptions using an open-text-box response on the positive and negative aspects of a virtual field course. The questions were as follows:
-
What do you think the positive aspects of a virtual field course might be?
-
What do you think the negative aspects of a virtual field course might be?
Participants were then asked to express the extent to which they agreed with 25 statements (Supplement) using a Likert scale response between 1 and 5, corresponding to how much they agreed with the statement. We chose a mixed-methods approach with a Likert scale to allow for easy analysis of the survey, but we also included an open text box in which participants could add qualitative statements to elaborate on their quantitative answers. The open text allowed participants to highlight any areas that they felt were important but that had not been raised by the questionnaire statements. The student and staff questionnaires mirrored each other and were simply phrased for participation and delivery respectively. The second post-course questionnaire was circulated after the course and focused on the same statements as presented in the pre-course questionnaire, although from the new perspective of having completed the course or, for staff, having delivered it. It is important to note that not all student participants completed the pre-course questionnaire in advance of the course and that some students returned theirs after the first week of the course.
3.2 Survey analysis
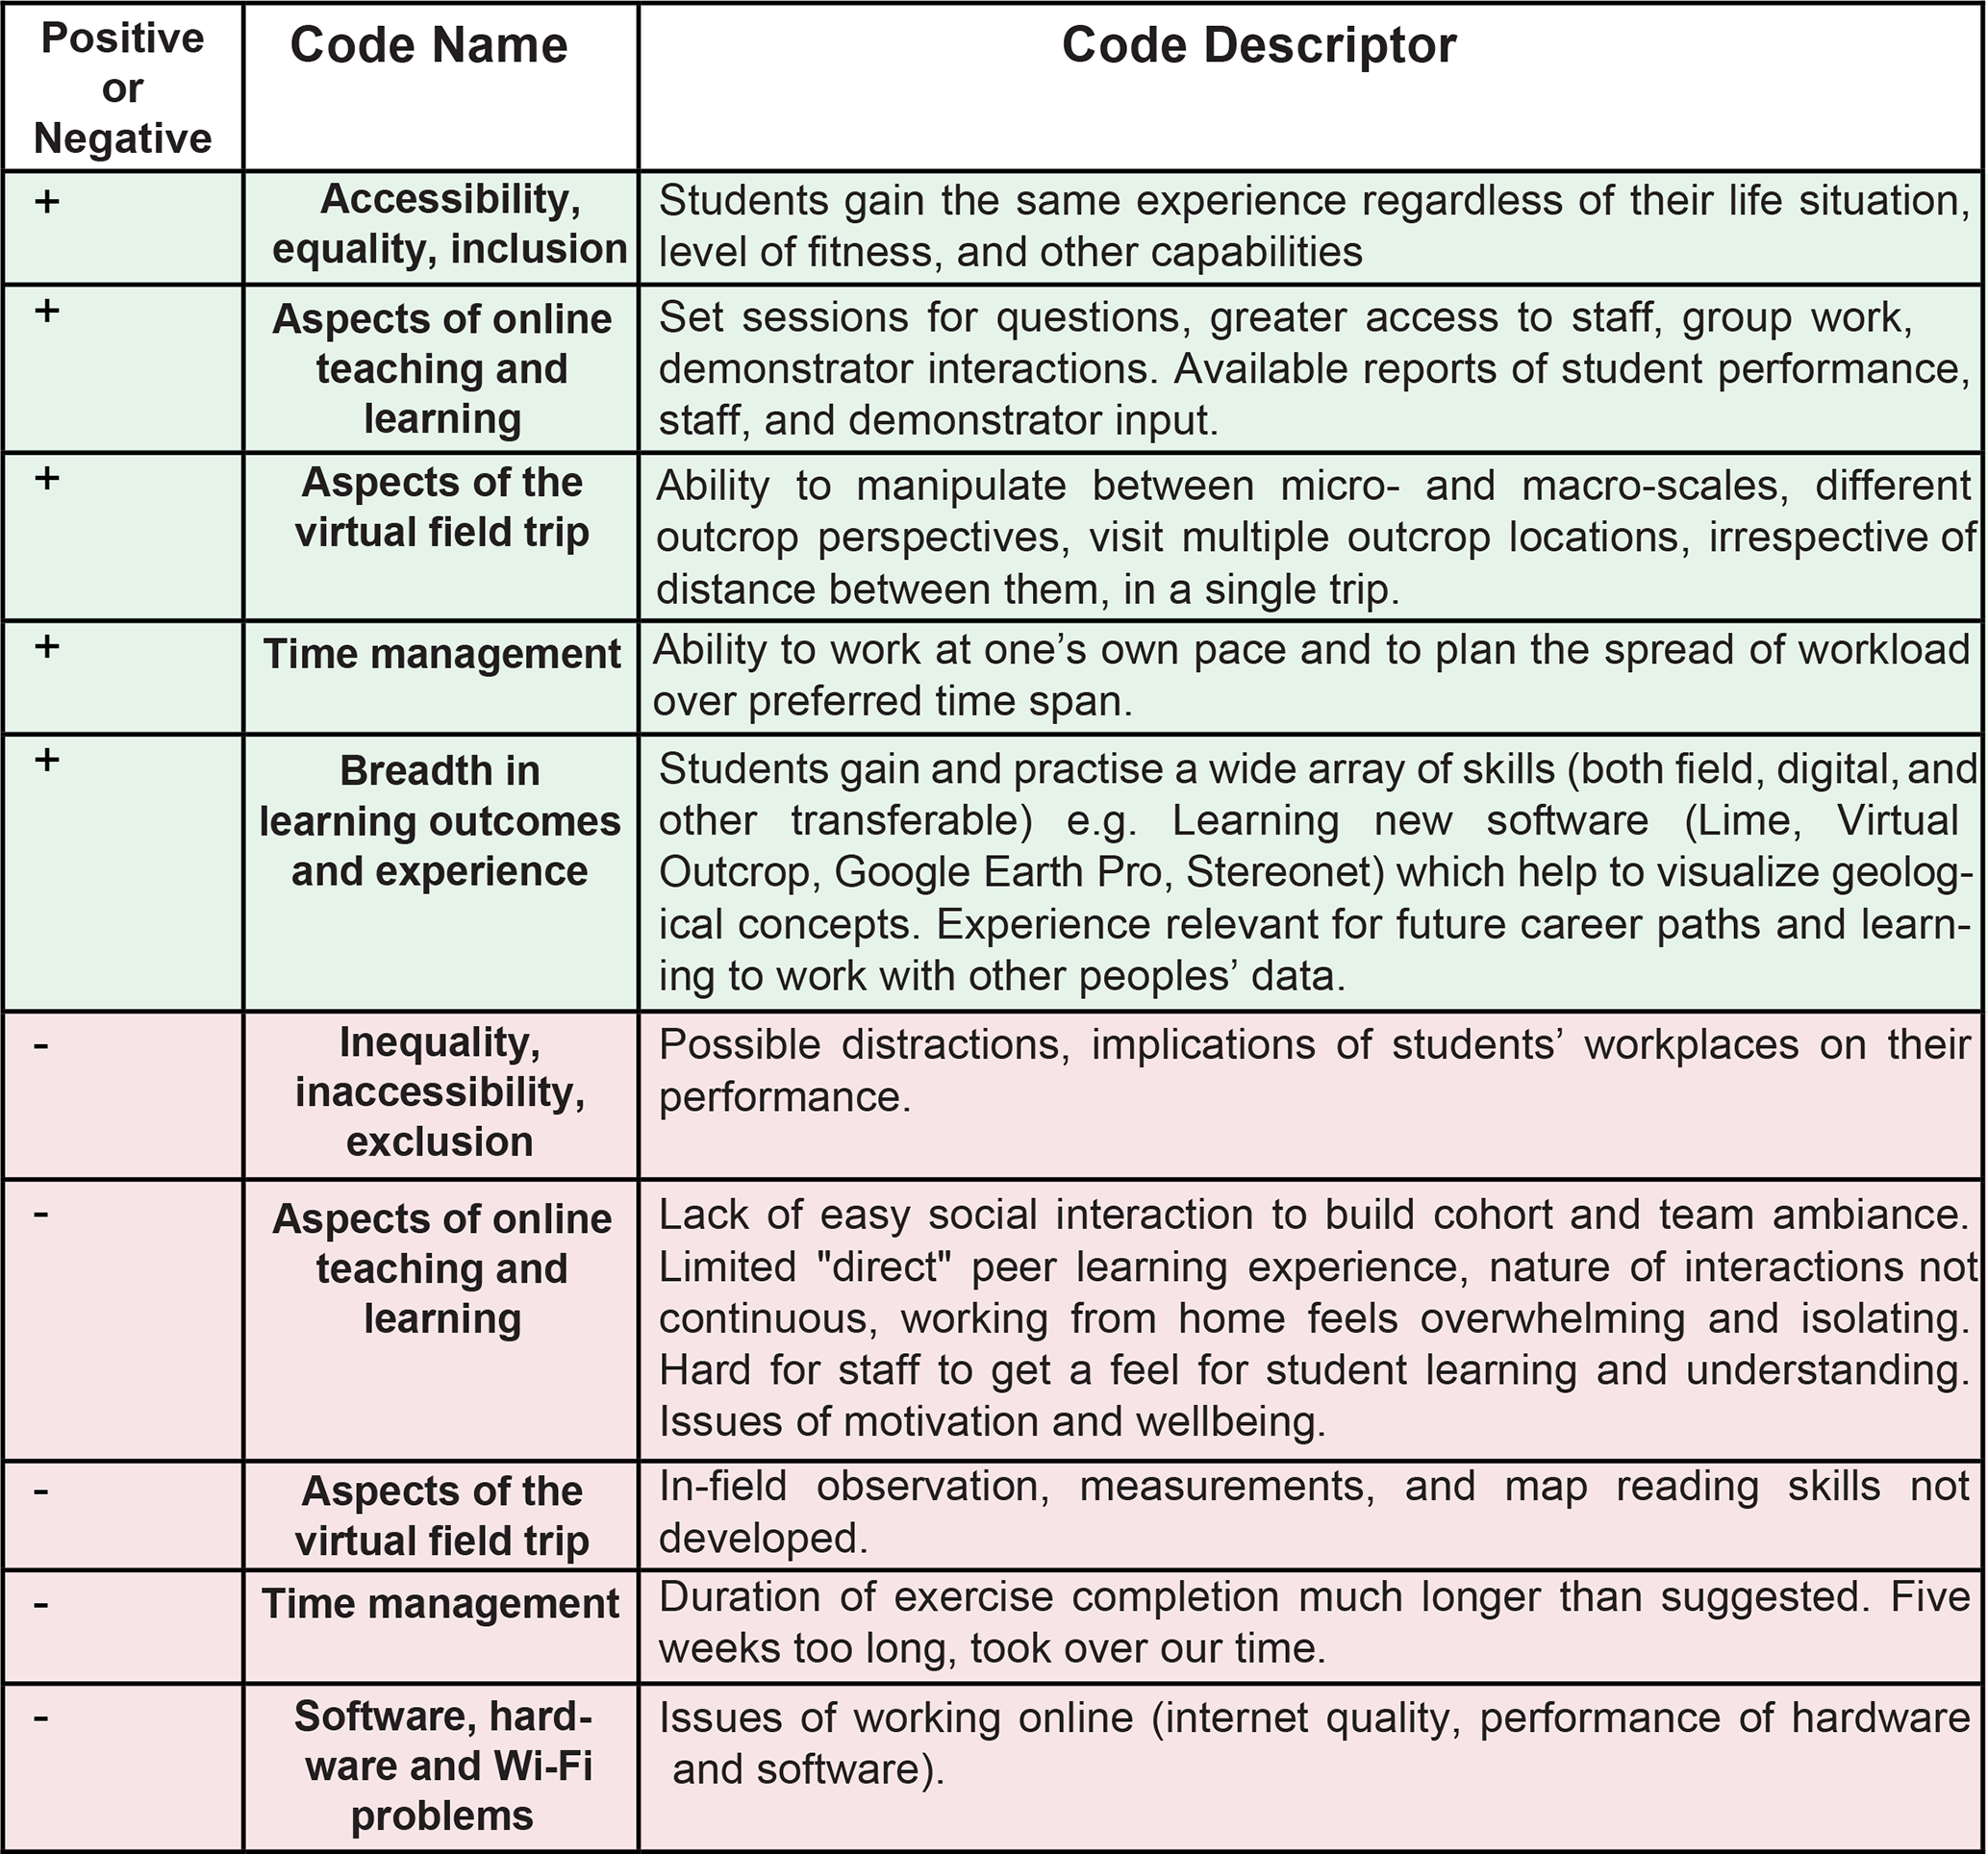
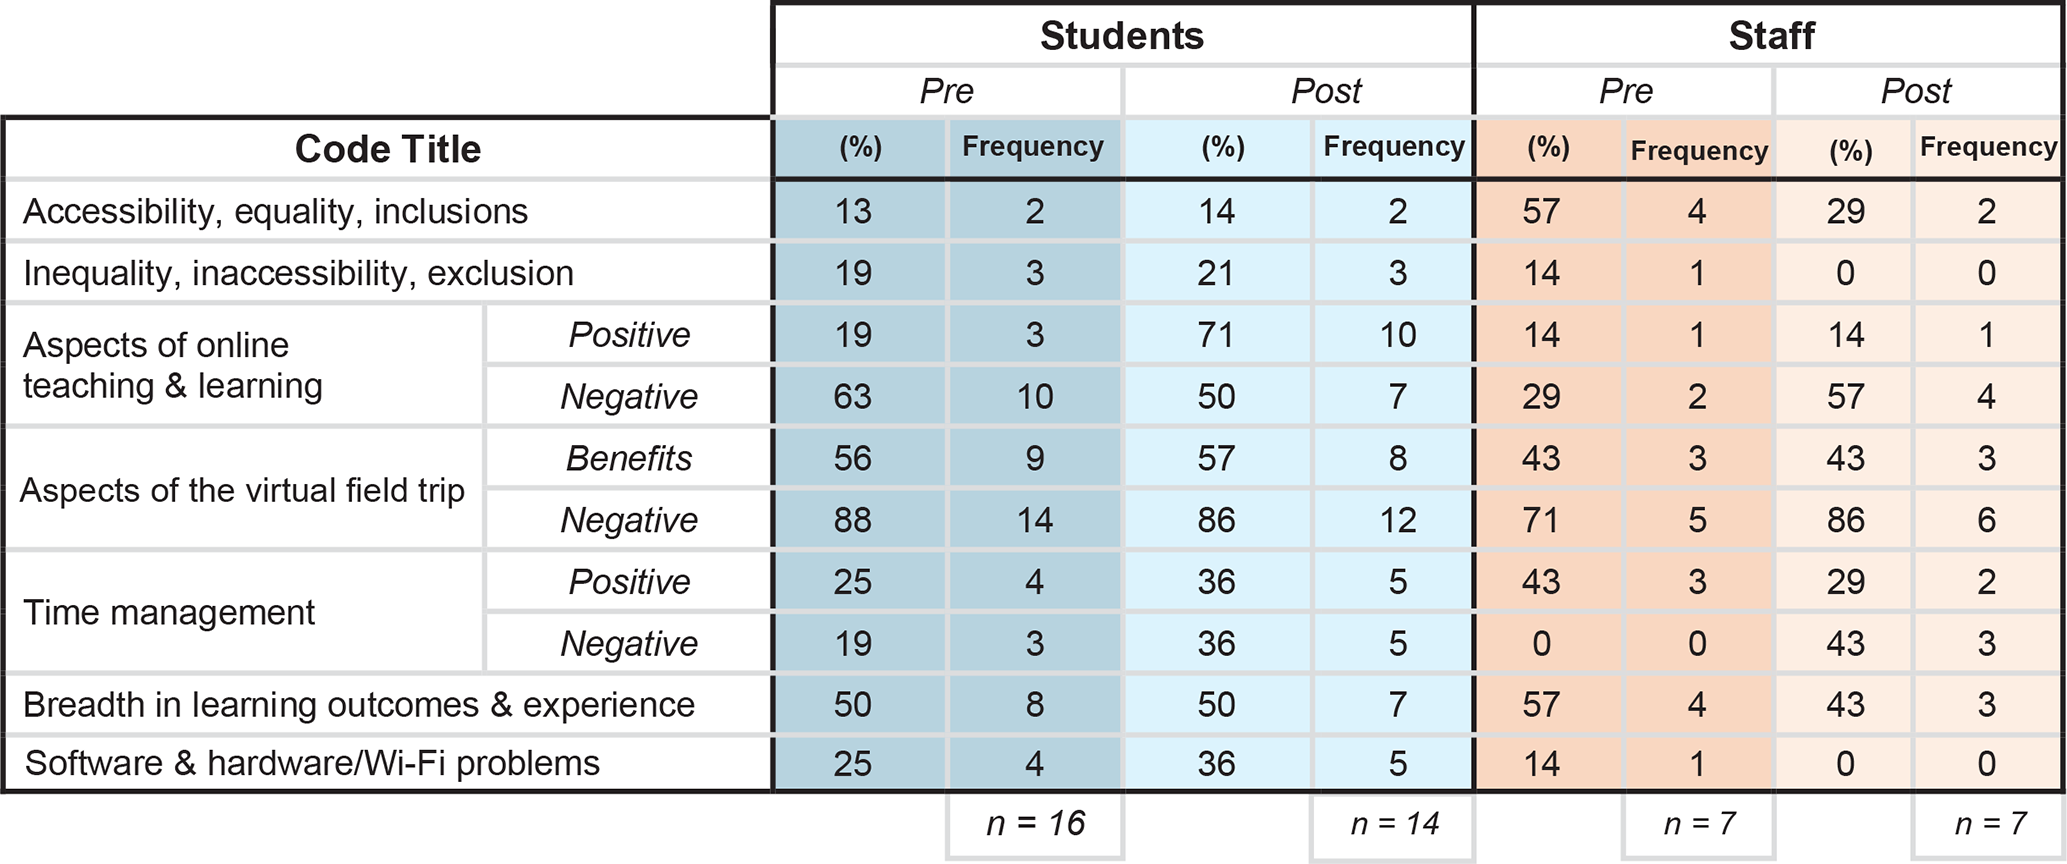
There were 22 students enrolled in the course and 11 staff members, consisting of 6 full-time staff members and 5 PhD student demonstrators. Different staff were involved in delivery for different weeks. For the pre-course questionnaire, there were 20 student respondents and 7 staff respondents; for the post-course questionnaire, there were 14 student respondents and 7 staff respondents. There were a couple of questions not answered by all respondents, these were “Building and maintaining a field notebook” in the pre-course questionnaire, which was not answered by one staff member, and “Collecting structural data” and “I think the ability for students (me) to engage in and complete work on the Virtual Field Trip will be affected by caring responsibilities” in the post-course questionnaire, which were both not answered by one student. Likert scale answers to the statements from all responding participants were summed, with median and interquartile ranges calculated and plotted in box-and-whisker format to show the range in the perceptions of staff and students pre- and post-course with respect to the 25 statements. We chose to present our Likert data in box-and-whisker format, as this shows the median, minimum, and maximum choices as well as the interquartile range, following Holzer et al. (2013) and Gregory et al. (2022). The full set of ordinal responses are presented in the Supplement. In contrast, the free-text comments required coding before analysis. The initial codes were developed by two of the author team, who defined a set of correlative codes that spanned the range of respondent opinions, both positive and negative. The coding was designed so that multiple codes could be assigned to each comment to capture the breadth of respondent perceptions during coding. Codes were then checked by the full author team to ensure that they were relevant and that their descriptors were explanatory. Detailed reflection and refinement resulted in a final set of 10 codes and associated descriptors (Table 1), which captured the critical elements of participants' comments. Codes were not explicitly designed to be paired; however, 8 of the 10 codes were effectively positive and negative pairs: accessibility, equality, and inclusion; time management; aspects of online teaching and learning; and aspects of the virtual field trip. The codes were then applied to the qualitative free-text responses, by the author team, as three pairs and one individual to generate a set of codes for each participants' free-text responses. The four sets of codes were then compared, and the discrepancies were minor. The full author team met, reviewed the codes, and agreed upon a final set of codes for each free-text response.
Table 1Summary of codes and descriptors for the qualitative text analysis; the table is colour-coded to display the positive (green) and negative (red) aspects.
First, we consider the responses to the quantitative statements and then go on to consider the qualitative free-text responses from participants to the first two questions posed and the open-question option. The full dataset is provided in the linked data repository, and all questionnaires are given in the Supplement.
4.1 Quantitative statements
Numerical responses were collated for each statement and plotted as box-and-whisker diagrams. Responses are collated into the three key themes: learning outcomes, peer–peer and academic support, and logistics. The key findings are shown in Figs. 2, 3, and 4 respectively, and they are grouped by statement to enable comparison between the student and staff responses and between pre- and post-course differences. As the questionnaires were anonymized, changes in individual opinion could not be tracked; however, by analysing the median and interquartile ranges (IQRs) of the sets of responses, it is possible to interpret the collective perceptions of the two cohorts (students and staff) both pre- and post-course and, thus, to track changes in perceptions with time. Differences between student and staff perceptions were observed for certain statements, and the key observations are described below. It should be noted that one student responded with the most negative option for all of the learning outcome statements; from their response to the open question, it was clear that this student was frustrated at not being able to go in the field, and we interpret their responses as reflecting this frustration. Often this negative response is shown as an outlier (a dot) in the box-and-whisker plots. Despite the low number of participants, particularly in the staff cohort, we ran a Mann–Whitney U test (Mann and Whitney, 1947) to ascertain significant differences in perceptions for the student pre- and post-course responses, staff pre- and post-course responses, and between the student and staff pre-course and student and staff post-course responses. The full results of the Mann–Whitney U test are available in our data repository. The perceptions that show a statistically significant difference at the p<0.05 level and, in one case, at the p<0.01 level are highlighted in Figs. 2, 3, and 4 and are discussed in Sect. 4.1.1–4.1.3.
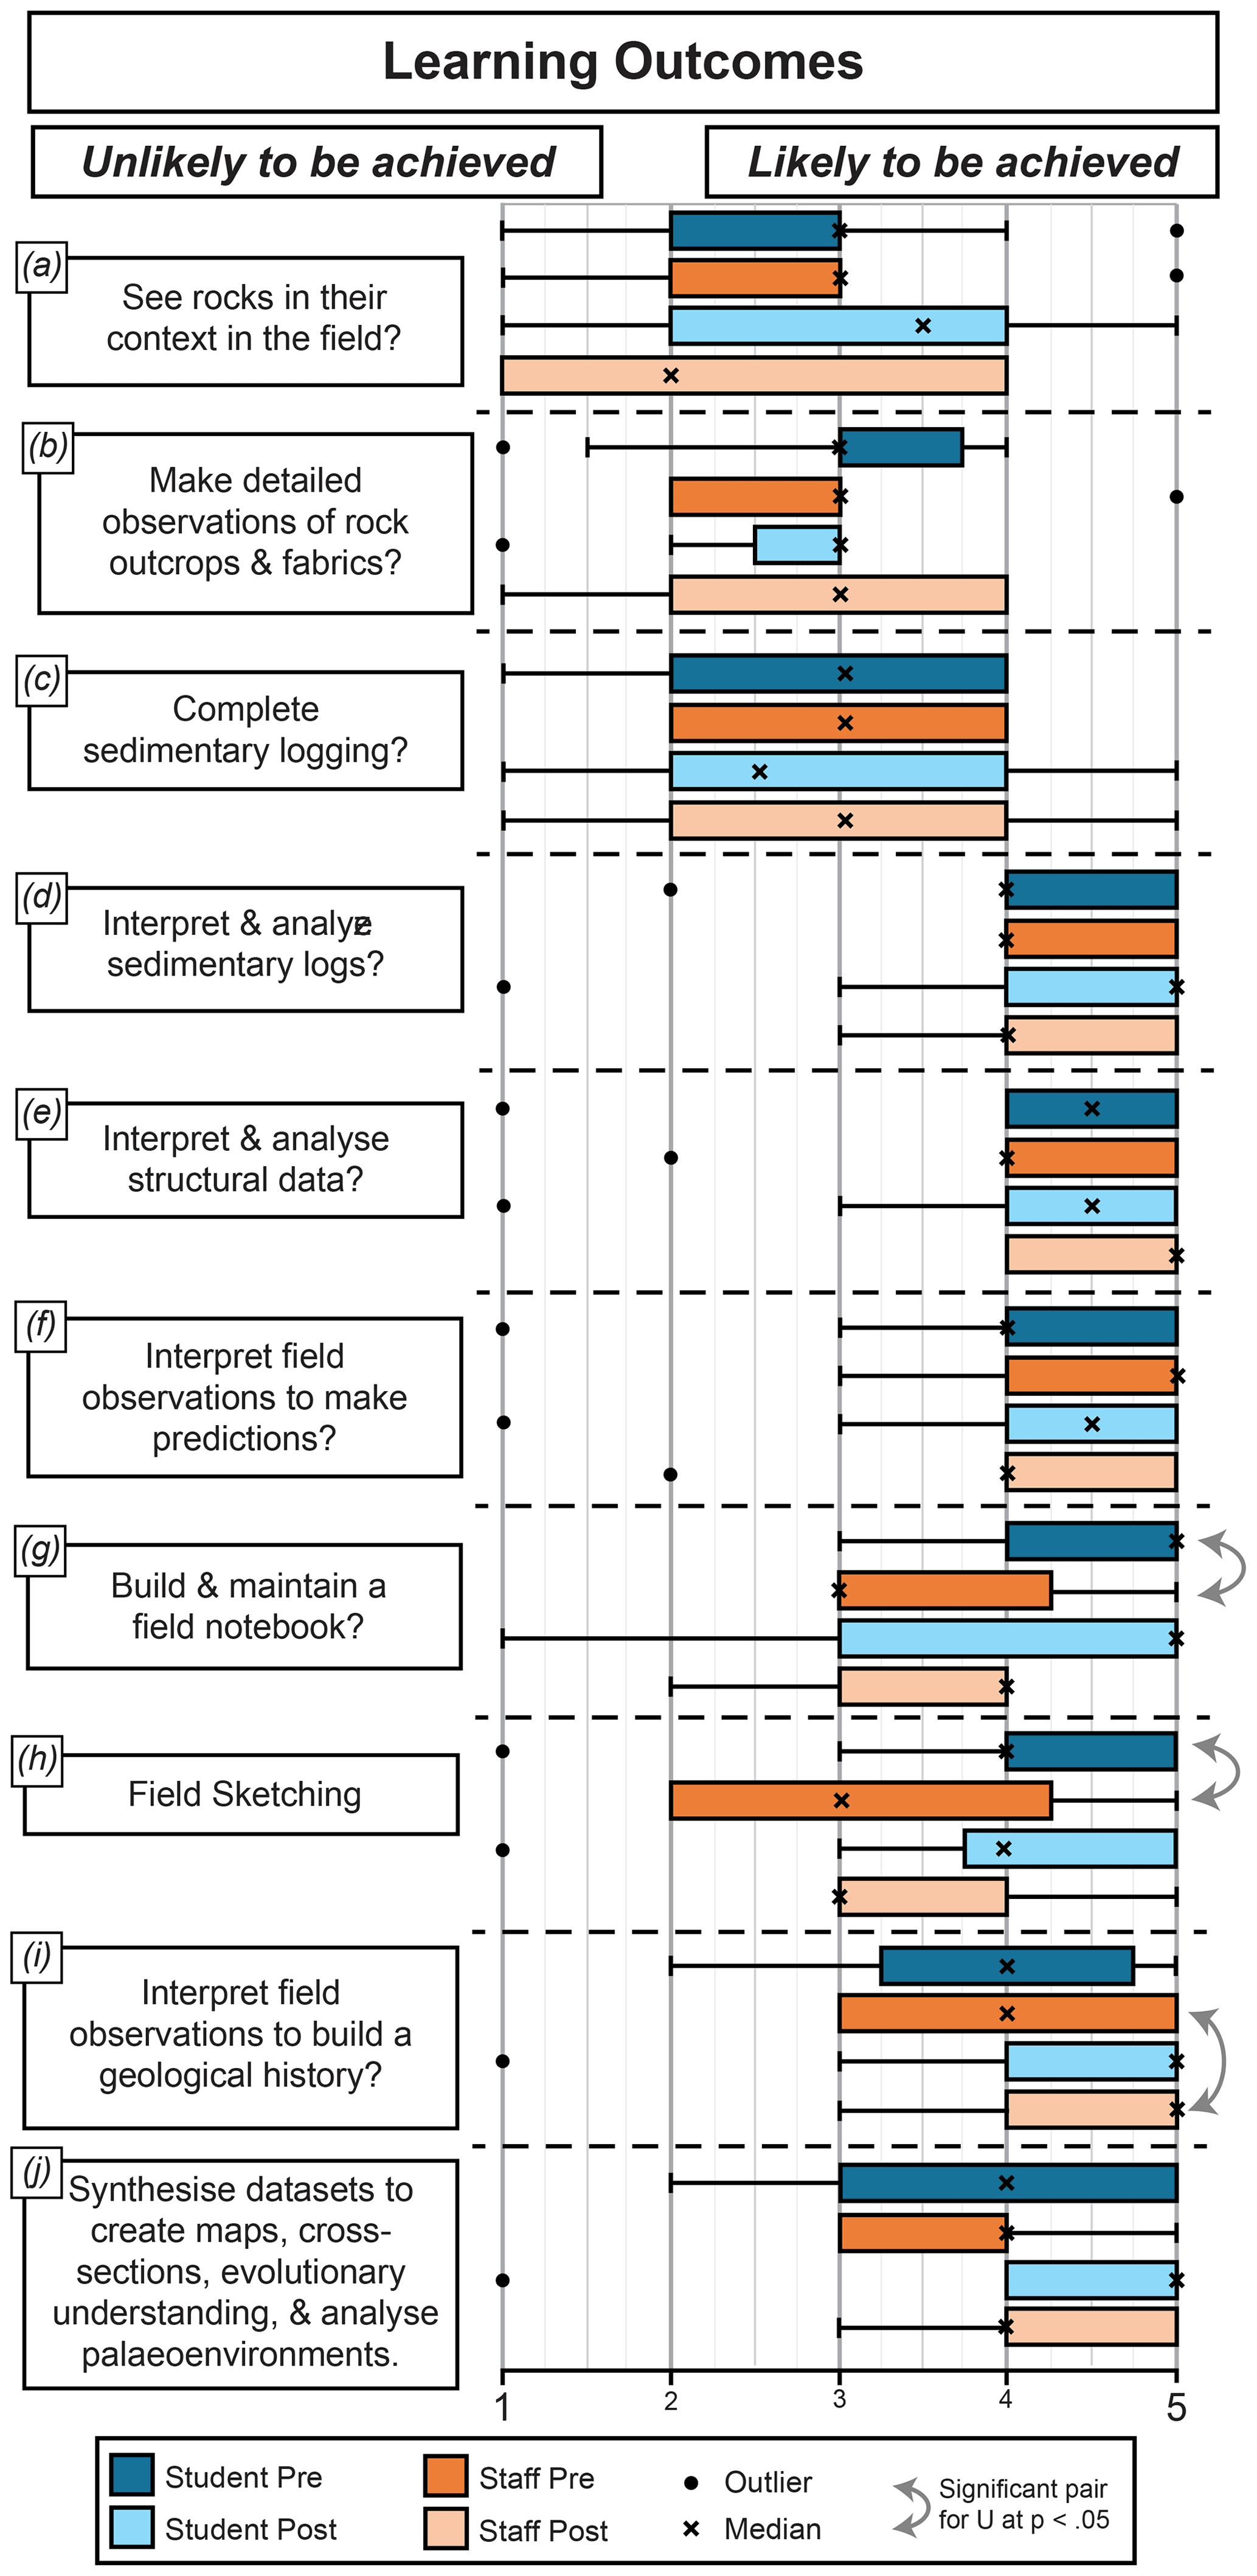
Figure 2Quantitative responses to learning outcome statements. Panels (a)–(i) summarize staff and student responses to a series of statements related to learning outcomes on a scale of 1–5: 1 is unlikely to be achieved, and 5 is likely to be achieved. Responses are grouped by statement and presented as pre-course and post-course responses for the student and staff cohorts.

Figure 3Quantitative responses to peer and academic support statements. Panels (a) and (b) summarize staff and student responses to statements related to peer–peer learning and student cohesion on a scale of 1–5: 1 is no to little impact, and 5 is a significant impact. Panels (c) and (d) summarize staff and student responses to statements on support level on a scale of 1–5: 1 is less support, and 5 is more support. Responses are grouped by statement and presented as pre-course and post-course responses for the student and staff cohorts.

Figure 4Quantitative responses to logistics statements. Panels (a) and (b) summarize staff and student responses to statements related to the length of the virtual field trip on a scale of 1–5: 1 is bad, and 5 is good. Panel (c) summarizes staff and student responses to statements related to the impact of internet access issues upon the completion of the course on a scale of 1–5: 1 is not much, and 5 is a lot. Panels (d)–(f) summarize staff and student responses regarding the usefulness of printed workbooks on a scale of 1–5: 1 is not really, and 5 is a lot. Responses are grouped by statement and presented as pre-course and post-course responses for the student and staff cohorts.
4.1.1 Learning outcomes
Key responses to the learning outcomes statements are shown in Table 1. Responses of 1 reflect an opinion of unlikely to be achieved, whereas 5 reflects an opinion of likely to be achieved. The statement “students are likely to see rocks in their context in the field” (Fig. 2a) was typically met with neutral responses prior to the course, with students and staff scoring the statement with a median response of 3.7 and having the same IQR of 2–3. Post-course, the IQR increased for both cohorts: 2–4 for students and 1–4 for staff. The median student response decreased slightly to 3.5, whereas staff perception decreased to 2. For the statement “students are likely to make detailed observations of rock outcrops and fabrics” (Fig. 2b), the students and staff had median scores of 3 and IQRs of 3–3.75 (students) and 2–3 (staff) pre-course. Post-course, the IQR for students narrowed to 2.5–3, whereas the staff IQR increased 2–4. The median responses remained consistent at 3.
There was diverse opinion both pre- and post-course from students and staff with regard to the “ability of students to complete sedimentary logs” (Fig. 2c), with the IQR spanning from 2 to 4 in all response sets, but most participants agreed that the “interpretation and analysis of sedimentary logs” would be possible (Fig. 2d), with an IQR of 4–5 pre- and post-course; the staff opinion remained unchanged with a median of 4 pre- and post-course, whereas the student median increased from 4 pre-course to 5 post-course . Similarly, students and staff were optimistic about the “interpretation of structural data” (Fig. 2e) pre- and post-course, with an IQR of 4–5 and median scores of 4.5 both pre- and post-course for students and 4 pre-course and 5 post-course for staff; the responses to the “interpretation of field observations to make predictions” (Fig. 2f) were similar, with an IQR of 4–5 both pre- and post-course for staff and students. Note that these statements do not refer to the method of data collection; therefore, the responses do not refer to the acquisition of field data, only the analysis and interpretation of that data.
Students and staff both predicted that they would be able to “build and maintain a field notebook” (Fig. 2g), with an IQR of 4–5 (students) and 3–4.25 (staff) in the pre-course questionnaire; however, a significant difference was found between student and staff perceptions pre-course, with students significantly (p<0.05) more confident than staff that they would be able to build and maintain a field notebook (Mann–Whitney U test value of 24.5; U at p<0.05 was 27). The post-course perceptions between the two cohorts were not significantly different, with the IQR broadening for students (3–5) and decreasing slightly for staff (3–4). The student median was 5 both pre- and post-course, whereas the staff median increased from 3 pre-course to 4 post-course; thus, both students and staff felt it likely that this learning outcome had been achieved post-course.
Similarly to the question on building and maintaining a field notebook, “field sketching” was thought likely to have been achieved by the student cohort pre-course, with a median of 4 and IQR of 4–5. For staff, the pre-course median was 3, and the IQR was 2–4.25. These values are statistically different: the U for p<0.05 is 34, and the U returned was 25.5. Post-course, the medians remain the same, but the IQR for the students increases to 3.75–5, whereas it decreased to 3-4 for the staff. These values are not statistically different.
Students were unsure about their potential “ability to interpret field observations to build a geological history” (Fig. 2i) prior to the course, with responses across a range of 2 to 5, with an IQR of 3.25–4.75 and a median of 4. Post-course, the IQR narrowed to 4–5 and shifted with a median score of 5. The Mann–Whitney U test showed this to be a significant change (giving a U of 25.5; U at p<0.05 is 34), with students perceiving that this learning outcome was more likely to have been achieved post-course. Staff responses showed a similar, although not statistically significant, trend, with a narrower IQR post-course, shifting from 3–5 pre-course to 4–5 post-course, and a post-course median of 5. This resulted in very similar distributions for the staff and student cohorts post-course. With respect to a similar statement on being able to “synthesize datasets to create maps, cross sections, and interpretations” (Fig. 2j), students and staff had a neutral to positive opinion pre-course, with an IQR of 3–5 (students) and 3–4 (staff). Post-course, the IQR was 4–5 for both staff and students, and the median score increased from 4 pre-course to 5 post-course for students and remained at 4 for staff.
4.1.2 Peer and academic support
Questions on peer and academic support were scored from 1 (no to little impact) to 5 (significant impact). There was a diversity of opinion within the student and staff cohorts pre- and post-course regarding whether peer–peer learning and cohort cohesion would be/had been impacted compared with an actual field trip (Fig. 3a, b). For the statement “A virtual field trip will in comparison to an actual field trip decrease peer–peer learning”, the IQR changed from 4–5 pre-course to 2.75–5 post-course for students, with a consistent median of 4 pre- and post-course. Staff had a greater IQR of 3–5 pre-course and a median of 4. Post-course, the staff IQR remained the same, but the median score decreased to 3.
Prior to the course, students were unsure as to the “level of academic support that they would receive as individuals” (Fig. 3d), with a median value of 3, an IQR of 1.25–3, and a full-response range of 1–5. The range of opinions on completion of the course was still 1–5, but the IQR had shifted to 2.75–5, with the median score remaining at 3. For staff, the IQR was consistent pre- and post-course (2–4), with the median shifting from 3 pre-course to 4 post-course. A positive shift in perception was seen from pre- to post-course in terms of the “academic staff support for the group as a whole” (Fig. 3e), with median scores from students and staff rising from 3 pre-course to 4 post-course. The positive change in student perception was significant according to a Mann–Whitney U test, with a U value of 71 (U at p<0.05 is 83).
4.1.3 Logistics
Regarding the length of the course, students and staff responded to two statements comparing a 5-week period of distributed learning with a 10 d intensive course, with one question focusing on the benefit to them as individuals and the other focusing on the benefit to the group. A score of 1 correlated with a bad perception, and a score of 5 correlated with a good perception. There was a broad spread in response to both questions (Fig. 4a, b); however, both cohorts, students and staff, felt that the extended 5-week time period was “beneficial to individual students”, with pre-course median scores of 3 (students and staff) and post-course scores of 3.5 (students) and 4 (staff). For the “benefit of the group as a whole”, median scores were consistent pre- and post-course, with scores of 4 (students) and 3 (staff).
Students and staff had quite different perceptions of how much caring responsibilities would impact the students' ability to engage in and complete work (Fig. 4c). Both the pre-course student and staff perceptions and the post-course student and staff perceptions were significantly different. Pre-course, the Mann–Whitney U test gave a U value of 12 (U at p<0.05 is 34, and U at p<0.01 is 24) for the difference between student and staff perceptions. The students had a median of 1 pre-course, and the staff had a median of 4. The IQR values were 1–1.5 (students) and 3–5 (staff). Post-course, the student median remained at 1, with an IQR of 1–2.5. For staff, the post-course median and IQR values were 3. Post-course, the Mann–Whitney U test for the difference between student and staff perceptions gave a U value of 13 (U at p<0.05 is 20, and U at p<0.01 is 13).
Students predicted a range of outcomes regarding “internet issues affecting progress” (Fig. 4d), with a score of of 1 indicating little impact, and a score of 5 indicating a lot of impact. The full range of responses (1–5) were submitted by students pre-course, but the median value shifted towards little impact, from scores of 2 (staff and students) pre-course to 3 (staff and students) post-course. The opinion on the value of a printed workbook were generally positive (Fig. 4e, f, g). A score of 1 indicated that it had not really helped, whereas a score of 5 indicated that it had helped a lot. Student opinion was broad as to the usefulness of a workbook in terms of “finding a quiet space to work” in advance of the course (Fig. 4e), with an IQR of 2.25–4 and a median score of 4, whereas staff more consistently believed it would be useful (IQR 4–5 and a median score of 4). Post-course, the median scores all remained at 4 (students and staff), although with an IQR spanning 1–5 (students) and 3–4 (staff). In terms of a workbook allowing “students to reflect on their work away from a screen” (Fig. 4f), both students and staff agreed that this was true, with positively skewed and narrow IQRs across pre- and post-course questionnaires and median pre-course scores of 5 (students and staff) and post-course scores of 5 (students) and 4 (staff). Students believed that the workbook would “provide a resource for future reference” (Fig. 4g) (median scores of 5 pre- and post-course); staff scored this statement with a median score of 4 pre- and post-course.
4.2 Qualitative statements
The questionnaire asked for free-text answers to two questions: one on the positive aspects of a virtual field course and one on the negative aspects. At the end of each of the questionnaires, there was also free-text space for respondents to add anything additional that they felt had not been covered in the preceding statements. Seven staff members involved in the course design and delivery provided free-text comments before and after the field trip, as did 20 of the participating students pre-course and 14 post-course. The free-text responses highlighted issues ranging from technical aspects of virtual environments and field trips through to learning outcomes and experiences. Many provided context and reasoning for their scoring responses to the preceding questions, with free-text responses clearly being led, to some extent, by the preceding quantitative questions. A total of 10 thematic codes were created after analysis of the free text (see Table 1 and Sect. 3.2). These thematic codes naturally fell into positive and negative categories, and we used this classification (see Table 2, in which the full set of coded data is summarized). Figure 5 shows radar plots of the same data to visually represent the pre- and post-course perceptions of students and staff respectively (Fig. 5a, b) as well as comparison of staff and student perceptions pre-course (Fig. 5c) and post-course (Fig. 5d). The radar plots are “split” vertically, with positive aspects on the right side and negative aspects on the left side. We describe the results of each radar plot in turn.
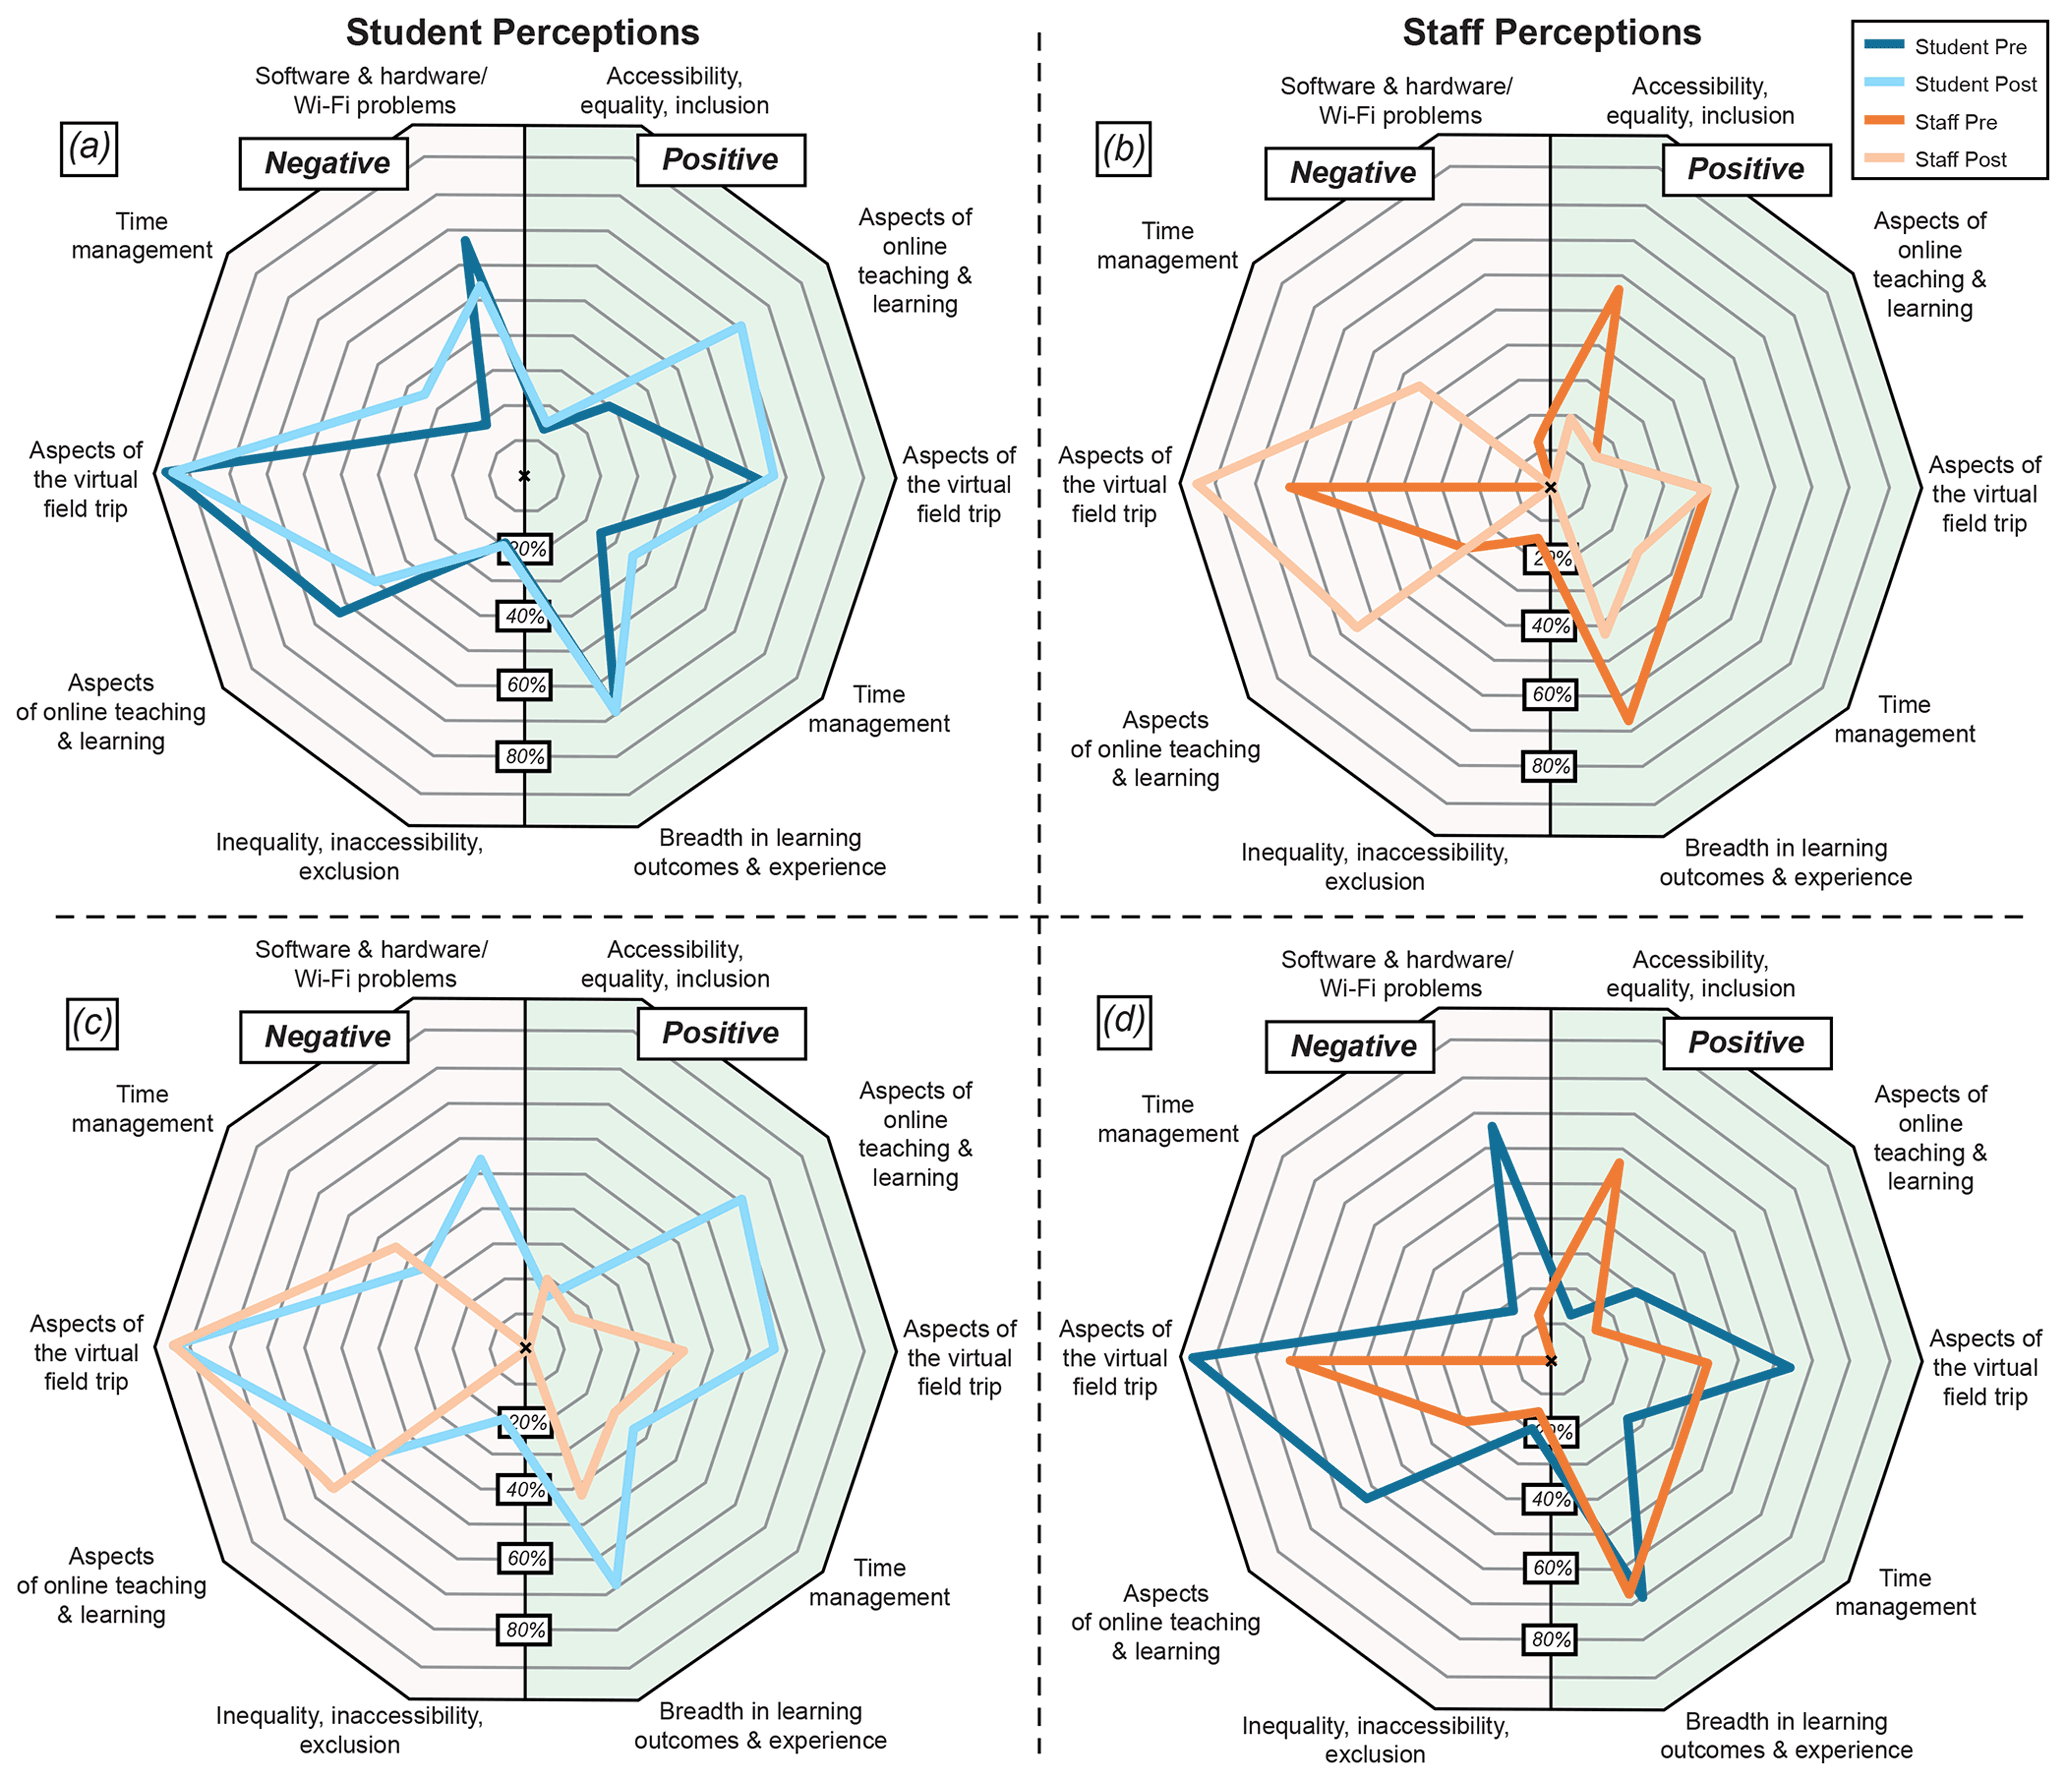
Figure 5Radar plots of student and staff perceptions derived from free-text responses to questions: (a) student perceptions pre-course (n=20) and post-course (n=14), (b) staff perceptions pre-course and post-course (n=7), (c) comparison of student and staff perceptions pre-course, and (d) comparison of student and staff perceptions post-course. The plots are split vertically with negative elements on the left and positive on the right; the positive and negative equivalents are plotted opposite each other, except for two independent codes.
4.2.1 Pre- and post-course student perceptions
The radar plot of pre- and post-course student perceptions (Fig. 5a) shows little change in student perceptions on the aspects that they raised over the course. Most of the change lies within the positive half of the plot, notably around positive aspects of online teaching and learning, with 71 % of respondents mentioning this after the course in comparison to 19 % pre-course. Phrases used by the students post-course include aspects around the ability to ask questions and not be affected by the weather – “Directly asking Q's on sessions easily” and “No rain!!” – and the ability to engage effectively with staff – “Individual engagement with professors during calls and being able to ask a lot of questions”. Negative aspects of online teaching and learning complement this with a decrease from 63 % pre-course to 50 % post-course mentions, but there were still clear perceptions of having missed an opportunity; for example, one student stated the following:
-
“Relationships between classmates and our teachers are made on field trips, and there is nothing like it to drop barriers and get people out of their comfort zone. These are the stories we take home with our degrees, and its these memories we will cherish over any qualification we achieve.”
There was also recognition that some aspects of an actual field trip cannot be replicated:
-
“Lack of the field experience, physical interaction with rocks, and ability to interact and ask questions/discuss things with examples to which you can point at”;
-
“Not being able to look at the outcrop in person, look at any features you perhaps cannot see in enough detail in images”;
-
“Nothing can replace actually seeing these outcrops in person. Being able to touch the rocks and see the entire setting of a location, being able to appreciate its beauty in real light and feel the enormity of what was going on with the geology from a first-hand perspective. Doing geology this way is why I enjoy the subject so much. I don't get the same gratification from just analysing data provided. Also there is no chance you might happen upon something new doing field work in this way. Being able to contribute to the subject by finding something new for the first time must be really exciting...”.
Time management also shows a positive shift post-course, from 25 % pre-course to 36 % post-course. Students enjoyed the flexibility with respect to study time as well as the ability to study at their own pace, stating the following:
-
“Flexibility, can do the course work when it suits you”;
-
“Tidy field notebook and the ability to move at your own speed, as you may be rushed in the field”;
-
“Learning at your own pace”;
-
“You have a while to actually figure and process information”.
However, this is balanced by negative mentions, which increase from 19 % pre-course to 36 % post-course:
-
“On the flip side, the fact that the virtual course was spread out over a much longer period of time was slightly annoying as well”;
-
“sometimes too much time to think about ideas, therefore causing confusion or overcomplicating things”.
Mentions of negative issues related to software/hardware and Wi-Fi problems also increase from 25 % pre-course to 36 % post-course:
-
“Wi-Fi problems and the quality of image resolution that will load on the programs”;
-
“The course always required internet access to complete the task”;
-
“Some of the programmes could not run on my computer, I did not have access to computers with higher processing power”.
The students also recognized that their views were influenced by the ongoing pandemic and the additional challenges this raised:
-
“I think that a lot of this, along with lockdown, is a psychological challenge in the respect that the actual act of going into the field; the build-up and pre-departure information, packing etc. all help to push the brain into a place where it focuses on the task at hand and you can immerse yourself within the geology fully. Being at home doesn't force yourself into that place, and it's difficult to try to get your brain into geology-mode as it were. I'm sure all the staff are aware of this, but I think, personally, it's something that has become apparent completing the first few virtual assignments.”;
-
“We all had to do this during a global pandemic (staff included), without our friends, isolated from our usual coping mechanisms e.g. gym, uni routine, being in Aberdeen, enjoying the great outdoors. So this is a particularly challenging time for you as staff and us as students to complete and set a virtual field trip.”.
4.2.2 Pre- and post-course staff perceptions
Figure 5b illustrates the changes in staff perceptions pre-and post-course. Comments on the negative aspects of the virtual field trip are dominant and increase slightly over the course, from 71 % to 86 %, with the use of phrases such as the following:
-
“Specific field techniques are not developed”;
-
“Difficulty applying digital-learnt skills to real-world scenarios when normal fieldwork practices recommence”;
-
“Some field skills cannot be replicated. The students are shown the precise areas of the outcrop to look at rather than having to search for field evidence themselves, and broader skills such as map-reading are not developed. Generally, the virtual environment is not as inspiring as being out in the field for real (no matter how hard we try!) and so may have been less enjoyable for students. I know that I was greatly inspired by undergrad field trips and so I think it's a shame that these students couldn't experience that.”.
Concerns around inequality, inaccessibility, and exclusion decrease from a pre-course percentage of 14 % to 0 % post-course; this is mirrored by a similar decrease in positive comments around accessibility, equality, and inclusion (57 % to 29 %) but included comments such as “Accessibility for all”. Mentions of positive perceptions on the breadth of learning outcomes and experience decrease slightly during the course (from 57 % to 43 %) but included comments such as “Adds versatility to standard field skills – i.e. implementation of principles during challenging situations (digital). Also adds a greater focus on digital skills that will become ever-more pertinent as geosciences embraces technological applications.”. The number of comments on the benefits of virtual field trips remained constant, focusing on aspects of cost, travel, and variety of geology, including phrases such as the following:
-
“independent of weather, distance between outcrops, physical fitness of participants”;
-
“no travelling costs”;
-
“opportunity to revisit outcrops when a question comes up at a later point in time”;
-
“Access to many different field examples form [sic] different field areas showing clear geological features (i.e. can pick and choose and are not restricted to the outcrops within reach of accommodation).”;
-
“Large-scale perspective that provides context before zooming on details of field data.”.
Concerns of staff regarding time management appeared during the course, rising from no negative comments pre-course to 43 % post-course, which centred on the length of the course – for example, “5 weeks is a long time to keep focused and, whilst I understand the reasoning for this, I think a shorter time period may have been more beneficial in keeping cohesion” and “Perhaps the 5 weeks was a bit long – 4 weeks may have been better”. This is supported by a decrease in positive comments regarding time management from the pre-course analysis (43 %) to the post-course analysis (29 %).
4.2.3 Pre-course perceptions of students and staff
Figure 5c enables comparison of student and staff perceptions pre-course. The shape of the radar plots for the two cohorts show a similarity in pre-course perceptions between staff and students, with negative aspects of the virtual field trip featuring most strongly for both cohorts: 88 % and 71 % respectively. Students and staff appeared to have similar, although relatively low, levels of concern regarding inequality, inaccessibility, and exclusion: 19 % for students and 14 % for staff. Students were more concerned (63 %) than staff (29 %) about the negative aspects of online teaching and learning. Staff felt that there would be positive implications for accessibility, equality, and inclusion (57 %), whereas students barely mentioned this (13 %). Positive aspects regarding breadth of learning outcomes and experiences (50 % for students, 57 % for staff) and benefits of virtual field trips (56 % for students, 43 % for staff) were similar. Concerns regarding time management were 0 % for staff and 19 % for students.
4.2.4 Post-course perceptions of students and staff
Figure 5d enables comparison of student and staff perceptions post-course. The shape of the radar plots shows both similarity and divergence. Negative aspects of the virtual field trip feature strongly for both cohorts: 88 % students and 86 % staff. Students mention inequality, inaccessibility, and exclusion (21 %), whereas staff do not. Students (50 %) and staff (57 %) have post-course concerns around negative aspects of online teaching and learning. Perhaps surprisingly, students commented on the positive aspects of the online teaching and learning environment more (71 %) and were divergent from staff (14 %). Staff were more positive (29 %) regarding accessibility, equality, and inclusion than the students (14 %). Breadth of learning outcomes and experience were mentioned by 50 % of students and by 43 % of staff respondents. Students (57 %) and staff (43 %) both recognized benefits of the virtual field trip.
The exercise of running the virtual field trip and eliciting perceptions provided an opportunity to really consider the impact of online course design and delivery choices on student learning and experience. A caveat to our findings is that the global pandemic created a very specific set of circumstances for delivery and engagement of students, and the responses will reflect the additional pressures of the time. Irrespective of this, we feel our aim to use the opportunity to reflect on online and virtual field teaching environments and practices to inform future teaching strategies and pedagogy has value. We discuss the findings of our research through the framing of our research questions.
5.1 Did the participants and staff perceive that the learning outcomes were achieved?
Before the course, staff held several sessions to discuss how best to design and deliver the virtual field trip; these sessions included both consideration of learning outcomes and identification of areas or elements of online learning and virtual field trips that might raise concerns in terms of delivery and learning. Despite not being in the field, staff felt in advance of the virtual field trip that all of the main learning outcomes could be met, apart from observing rocks in the field. Post-course, staff felt that the main learning outcomes were met or exceeded, with medians of 3 or higher for all learning outcomes apart from “seeing rocks in their context in the field”. There was a recognition that the types of skills and learning outcomes were different and broader in scope than those that might have been learnt on an actual field trip. This is reflected by positive perceptions around the breadth of learning outcomes and experience, evidenced by qualitative statements as well as high scores (medians of 4 and 5) in the Likert test for data analysis and synthesis. Notably, there was a statistically significant positive shift pre- and post-course for staff with respect to the likeliness of the learning outcome “interpreting field observations to build a geological history”. Thus, although skills such as physically taking strike and dip measurements in the field had not been met, manipulating such measurements in an online Stereonet package, analysing larger datasets to build a geological history, and digital literacy were, for example, much expanded in comparison with an actual field trip. Other virtual field trips have also reported improved digital literacy as an outcome (e.g. Delacruz, 2019). Students had similar (or more positive) perceptions compared to staff pre-course about their ability to achieve the learning outcomes in advance of the course. Specifically, they were statistically more positive than staff with respect to their ability to build and maintain a field notebook and regarding field sketching pre-course. The students remained positive post-course, with all medians at 3 or above for the quantitative analysis of learning outcomes apart from for completing sedimentary logs (median of 2 post-course). Students, like staff, also recognized that they had more time to work on data, analysing and synthesizing them to expand their understanding and learning, such as thinking about and creating cross sections that worked with their maps to visualize a fully 3D subsurface space. These types of skills in critical thinking and analysis are developed through time and are transferable across disciplines; hence, in many ways, they are more desirable than a specific ability to undertake a technique or measurement which can be learnt at any stage.
5.2 Were effective measures put in place to support the learning outcomes and delivery?
Staff identified concerns about the students' ability to participate fully in the online field trip in advance of the course. These included internet connectivity; time and space to learn, including work and caring responsibilities; and issues with engagement and cohort cohesion. The results from online internet tests that the students undertook in advance of the course indicated that student internet speeds were poor relative to data for the whole of the UK and globally at the time of the course. The mitigation measures put in place included recording all sessions and providing a printed workbook for students to refer to alongside online course material. The exercises were designed so that they could be completed through use of the workbook without the need to access 3D virtual outcrop models; these added value to the exercises rather than being critical. The pre-course and post-course perceptions of students and staff indicate that use of the workbook to mitigate computing issues was at least partially successful and enabled the completion of the exercises. Rendering of large 3D virtual outcrop models caused a problem for some students, and we recognise that this mitigation strategy could have had negative implications with respect to student inclusion and perceptions of inclusion. Issues of accessibility and inclusion, most notably around mobility, cost, and cultural issues, which are often thought to be negated by virtual field trips (e.g. Bursztyn et al., 2015), might in fact be replaced by other exclusionary barriers related to access to high internet speeds, hardware with powerful processing, and the requirement for high-end graphics cards, as recognized by Kelly et al. (2004), Laksana (2021), Pearson and Reddy (2021), Devkota (2021), and Ochieng and Gyasi (2021). For any of the questions posed, there was the greatest difference between the perceptions of staff and students, pre- and post-course, regarding the impact of caring responsibilities on course engagement. The students felt the impact was low in comparison to staff. Although we do not know why this was, we can hypothesize that it may reflect staff concerns about both individual student situations as well as their own.
Table 2Summary of qualitative text coding responses. The table shows the 10 codes and the frequency and percentage of coded occurrences; these data are plotted in Fig. 5.
5.2.1 Length of the virtual field trip
Students recognized the benefits, for themselves personally as well as for the group, of running the course over a 5-week time period. The length of time was difficult for some, as they were concerned with changes to rules and regulations regarding dynamic COVID-19 restrictions, evolving work commitments, and the ability to travel to see relatives amongst other things. We believe that this mainly reflects the uncertainty regarding the period, rather than anything specific to the delivery. Time management was perhaps the most significant issue that resulted from delivery over a 5-week period. For students effectively in lockdown at home, there was a tendency to spend a considerable amount of time, beyond that advised, on the tasks and exercises. Students felt, in some instances, that staff had underestimated the amount of time they took for some of the exercises. These negative aspects of time management, alongside the positive aspects of being in control of when they chose to learn, are clearly reflected in the questionnaire and statement responses. We believe that the time spent by students, beyond that expected, resulted in a greater breadth and depth of learning. The extended length of time for delivery also allowed techniques and concepts to embed and skills to develop, particularly critical analysis and synthesis, as acknowledged in the post-course scores in learning outcomes. However, this raises conflicting concerns around time management, mental fatigue, and student welfare when working from home, especially in a lockdown scenario in which the world was all work with little opportunity for “play”.
5.2.2 Recorded sessions
Evidence from the online learning environment and verbal feedback from students indicated that they went back and watched recorded sessions in their own time, including “Q&A” sessions and formal introductions to the different exercises, in order to go over material (repeating content) as well as to access elements that they had missed either through clashes with other commitments or due to internet issues. These positive aspects of the online virtual field trip and learning environment were also reflected in answers to the questions and the free-text responses. The advantages of being able to review recorded material have been evidenced by others across a range of subject areas (Cascaval et al., 2008; Manea et al., 2021).
5.2.3 Hard copy workbook
The workbook was identified by the students as a helpful reference for future learning, with a median of 5 pre- and post-course, although staff perceptions of this were more spread, with a median score of 4. The workbook was effective for students in terms of allowing them to read and reflect off-screen during the course, thereby mitigating internet connectivity issues, as well as giving them the ability to manipulate models etc. while reading instructions. This was particularly important for students who were often working on relatively small laptop screens.
5.3 Did the participants and staff perceive the peer–peer and academic support to be effective?
Elements of student cohesion and teamwork that result from an actual field trip, alongside peer–peer learning, are often considered one of the benefits of face-to-face learning (Baker and Woods, 2004) and the in-field experience. Staff were concerned that these elements would not be replicated in a virtual field trip. To mitigate or indeed to try and best replicate these elements, students were divided into small groups of five with a PhD student mentor and had drop-in sessions each week to discuss their work and exercises. This helped break down barriers between staff and students and encouraged students to share their work with their peers to discuss issues. Some of these groups worked very well, others were less effective. One group was amalgamated into the other groups part way through the virtual field trip to increase effectiveness, and this dynamic ability to adapt based on student feedback worked well.
Delivery of the virtual field trip benefitted from a relatively small student cohort that had already worked together in the field and had spent 2.5 years at university ahead of the COVID-19 restrictions. This meant that they were already effectively working well as a cohesive team in advance of the field trip, with their own networks and social media groups that helped with peer support. Students were encouraged to use the chat function in the online learning environment within their small groups and with the whole cohort; however, use of the chat function in the virtual learning environment was limited outside of scheduled live Q&A sessions. Nevertheless, these live sessions were run frequently (minimum daily) throughout the virtual field trip, so extra questions may not have been required.
There was some concern about how effective student support from staff would be in the online environment. Students were positive in terms of many of the aspects of the online teaching and learning environment, and the free-text responses indicate that students appreciated the large number of staff and student sessions and the ratio of staff to students. As Baker and Woods (2004) describe, this level of engagement results in a feeling of immediacy. Actual field trips for a student cohort of 22 may have two teaching staff and one or two PhD student demonstrators, whereas there were three or four lecturers available at any one time and five PhD student demonstrators for the virtual field trip. It was felt, as evidenced by the qualitative responses, by both staff and students that the increased contact time was beneficial to help identify and work through areas of misunderstanding. There was also more opportunity for students who may not normally engage to ask questions of staff and PhD students. This was also seen by a statistically significant shift in the students' responses pre- and post-course, with students recognizing the additional amount of individual student support available from academic staff in comparison with an actual field trip.
The author team, consisting of students and staff involved in the virtual field trip, feel that the virtual field trip was successful overall with respect to achieving the learning outcomes, based on student and staff perceptions. We acknowledge the small number of student and staff participants and recommend surveys with bigger cohorts to provide results that can be statistically analysed. Here, we have considered broader elements, including learning outcomes, peer and academic support, and student cohesion, thereby reflecting on the running of a virtual field trip from student and staff perceptions to inform future online learning and particularly virtual field trips. Based on our findings, we recommend consideration of the following elements in virtual field trip delivery:
-
Hard copy workbook – the use of a hard copy workbook delivered to students allowed them to have a tangible overview of the field trip in advance, and it provided an easy-to-use set of reference material that enabled students to work off-screen and to evaluate multiple sources of material – online and hard copy – during a single exercise. It also allowed those with internet connectivity or hardware issues to participate in the virtual field trip and complete exercises solely on paper, although no students were in this position.
-
Session recording – we recorded all formal sessions, as well as informal Q&As. The students used these to refresh their understanding of the material as well as to catch up on missed sessions. The only sessions not consistently recorded were small student group sessions with PhD students, as our aim was to make these as informal, relaxed, and open as possible. Students were positive about the opportunities available through the recording of online teaching to catch up on and revise material in their own time.
-
Recognition of challenges – although we did not use the data on internet connectivity beyond identifying students who might have issues. We believe it was reassuring for students to know that we had considered possible barriers to participation in terms of factors such as internet connectivity, space to work effectively, and other commitments. This helped to build trust and a shared understanding, so that when issues did arise students felt more able to raise them. The students, in comparison to staff, did not feel that caring responsibilities affected their ability to engage in the virtual field trip, but we recognize that this is a cohort-specific issue.
-
Multiple interaction opportunities – providing multiple interaction opportunities with both academic staff and PhD students throughout the field trip was important. It is also important to recognize that students will likely also have their own social networks and to build on these.
-
Breadth of learning outcomes – our main conclusion is that virtual field trips offer an additional method of training and in many ways complement actual field trips. They can provide opportunities for greater and different interactions with staff that are not possible when those same staff are also dealing with the logistics of an actual field trip. They provide opportunities for greater synthesis of data and the development of critical analytical skills over multiple geological field areas that are hard to replicate on an actual field trip.
The radar plots reflect the nuances of positive and negative aspects of virtual field trips. We note that both pre- and post-course negative aspects of the virtual field trip dominate comments with respect to both students and staff. However, we note that these are countered by positive comments on aspects of virtual field trips and online teaching and learning, perhaps most notably by those regarding the breadth of learning outcomes and experience. We can learn from this by drawing on these findings to inform future design and delivery of virtual field trips in a blended learning environment to expand and develop their positive aspects.
The research was carried out following the University of Aberdeen’s ethics procedure.
The underpinning data for the Likert survey and the Mann–Whitney U test results are available from https://doi.org/10.20392/89c5596a-7d0b-44fa-bd1a-f40b18f45b94 (Bond, 2022).
The supplement related to this article is available online at: https://doi.org/10.5194/gc-5-307-2022-supplement.
CEB lead the virtual field trip; conceived the research; led staff discussions on learning outcomes, barriers, and mitigation measures; designed and deployed the questionnaires; designed the initial data analysis protocols and completed an initial data analysis; and lead the writing of the manuscript. JHP acted as a PhD student demonstrator on the virtual field trip, provided input with respect to the initial discussions on course design and delivery, participated in coding discussions of the qualitative text, redrafted all of the figures for final publication, collected the data for Fig. 1, and commented on the final draft of the text. LK acted as a PhD student demonstrator on the virtual field trip, provided input with respect to the initial discussions on course design and delivery, analysed and created the initial box-and-whisker plots for the quantitative data, provided input with respect to coding discussions of the qualitative text, and co-authored the initial draft of the text for qualitative statement analysis. SRL was a student on the virtual field trip; they contributed to data compilation, coding of the text-response statements, and co-authoring the initial draft of the text for qualitative statement analysis. MZS and TKG were students on the virtual field trip; they conducted the initial coding of the qualitative text and input, drafted some of the methods text, and constructed the initial radar plots. MLB was a student on the virtual field trip; they provided input with respect to the initial discussion and helped with qualitative statement coding.
The contact author has declared that none of the authors has any competing interests.
Publisher’s note: Copernicus Publications remains neutral with regard to jurisdictional claims in published maps and institutional affiliations.
This article is part of the special issue “Virtual geoscience education resources”. It is not associated with a conference.
We acknowledge the input of the students and staff who took part in the virtual field trip and contributed to the research by completing the surveys. The virtual field trip academic staff were Clare Bond, Rob Butler, Malcolm Hole, Colin North, Adrian Hartley, and Ian Alsop, who were involved in discussions on learning outcomes, course design, and delivery modes. The non-author PhD student demonstrators were Tom Theurer, Bartosz Kurjanski, and Sophie Berhendsen, who provided feedback on small group sessions.
This paper was edited by Marlene Villeneuve and reviewed by one anonymous referee.
Abduvakhidov, A. M., Mannapova, E. T., and Akhmetshin, E. M.: Digital Development of Education and Universities: Global Challenges of the Digital Economy, Int. J. Instruct., 14.1, 743–760, 2021.
Arthurs, L. A.: Bringing the Field to Students during COVID-19 and Beyond, GSA Today, 31, 28–29, https://doi.org/10.1130/GSATG478GW.1, 2021.
Baker, J. D. and Woods, R. H.: Immediacy, cohesiveness, and the online classroom, J. Comput. High. Educ., 15, 133–151, https://doi.org/10.1007/BF02940934, 2004.
Bond, C.: Learning outcomes, learning support and cohort cohesion on a virtual field trip: an analysis of student and staff perceptions, University of Aberdeen [data set], Likert_data (.xlsx), https://doi.org/10.20392/89c5596a-7d0b-44fa-bd1a-f40b18f45b94, 2022.
Bond, C. E. and Cawood, A. J.: A role for virtual outcrop models in blended learning–improved 3D thinking and positive perceptions of learning, Geosci. Commun., 4, 233–244, https://doi.org/10.5194/gc-4-233-2021, 2021.
Bos, D., Miller, S., and Bull, E.: Using virtual reality (VR) for teaching and learning in geography: fieldwork, analytical skills, and employability, J. Geogr. Higher Educ., 46, 1–10, https://doi.org/10.1080/03098265.2021.1901867, 2021.
Boyle, A., Maguire, S., Martin, A., Milsom, C., Nash, R., Rawlinson, S., Turner, A., Wurthmann, S., and Conchie, S.: Fieldwork is good: The student perception and the affective domain, J. Geogr. Higher Educ., 31, 2, 299–317, https://doi.org/10.1080/03098260601063628, 2007.
Buckley, S. J., Enge, H. D., Carlsson, C., and Howell, J. A.: Terrestrial laser scanning for use in virtual outcrop geology, The Photogramm. Record, 25, 225–239, https://doi.org/10.1111/j.1477-9730.2010.00585.x, 2010.
Buckley, S. J., Howell, J. A., Naumann, N., Lewis, C., Chmielewska, M., Ringdal, K., Vanbiervliet, J., Tong, B., Mulelid-Tynes, O. S., Foster, D., Maxwell, G., and Pugsley, J.: V3Geo: a cloud-based repository for virtual 3D models in geoscience, Geosci. Commun., 5, 67–82, https://doi.org/10.5194/gc-5-67-2022, 2022.
Bursztyn, N., Pederson, J., Shelton, B., Walker, A., and Campbell, T.: Utilizing geo-referenced mobile game technology for universally accessible virtual geology field trips, Int. J. Educ. Math. Sci. Technol., 3, 93–100, 2015.
Çaliskan, O.: Virtual field trips in education of earth and environmental sciences, Proc.-Soc. Behav. Sci., 15, 3239–3243, https://doi.org/10.1016/j.sbspro.2011.04.278, 2011.
Cascaval, R. C., Fogler, K. A., Abrams, G. D., and Durham, R. L.: Evaluating the Benefits of Providing Archived Online Lectures to In-Class Math Students, J. Asynchron. Learn. Netw., 12, 61–70, 2008.
Casini, G., Hunt, D. W., Monsen, E., and Bounaim, A.: Fracture characterization and modeling from virtual outcrops, AAPG Bulletin, 100, 41–61, https://doi.org/10.1306/09141514228, 2016.
Cawood, A. J. and Bond, C. E.: eRock: An open-access repository of virtual outcrops for geoscience education, GSA Today, GSA Today, https://doi.org/10.1130/GSATG373GW.1, 2019.
Cawood, A, J., Bond, C. E., Howell, J. A., Butler, R. W. H., and Totake, Y.: LiDAR, UAV or compass-clinometer? Accuracy, coverage and the effects on structural models, J. Structural Geology., 98, 67–82, https://doi.org/10.1016/j.jsg.2017.04.004, 2017.
Christie, H., Tett, L., Cree, V. E., Hounsell, J., and McCune, V.: A real rollercoaster of confidence and emotions: Learning to be a university student, Stud. Higher Educ., 33, 567–581, https://doi.org/10.1080/03075070802373040, 2008.
Cleveland-Innes, M. and Campbell, P.: Emotional presence, learning, and the online learning environment, The Int. Rev. Res. Open Distrib. Learn,. 13, 269–292, https://doi.org/10.19173/irrodl.v13i4.1234, 2012.
Delacruz, S.: Building Digital Literacy Bridges: Connecting Cultures and Promoting Global Citizenship in Elementary Classrooms through School-Based Virtual Field Trips, TechTrends, 63, 428–439, doi10.1007/s11528-018-0350-1, 2019.
Devkota, K. R.: Inequalities reinforced through online and distance education in the age of COVID-19: The case of higher education in Nepal, Int Rev Educ., 67, 145–165, https://doi.org/10.1007/s11159-021-09886-x, 2021.
Dohaney, J., Kennedy, B., Brogt, E., and Bradshaw, H: The geothermal world videogame: An authentic, immersive videogame used to teach observation skills needed for exploration, New Zealand Geothermal Workshop 2012 Proceedings, https://ir.canterbury.ac.nz/bitstream/handle/10092/9082/12642046_2012_Dohaney_geothermal_game.pdf?sequence=1&isAllowed=y (last access: 29 September 2022), 2012.
Gayle, B. M., Cortez, D., and Preiss, R. W.: Safe Spaces, Difficult Dialogues, and Critical Thinking, Int. J. Scholarship Teach. Learn, 7, 1–8, 2013.
Gregory, D. D., Tomes, H. E., Panasiuk, S. L., and Andersen, A. J.: Building an online field course using digi- tal and physical tools including VR field sites and virtual core logging, J. Geosci. Educ., 70, 85–100, https://doi.org/10.1080/10899995.2021.1946361, 2022.
Hess, G. F.: Heads and hearts: The teaching and learning environment in law school, J. Legal Educ., 52, 75–11, 2002.
Herodotou, C., Muirhead, D. K., Aristeidou, M., Hole, M.J., Kelley, S., Scanlon, E. and Duffy, M.: Blended and online learning: a comparative study of virtual microscopy in Higher Education. Interactive Learning Environments, 28, 713–728, https://doi.org/10.1080/10494820.2018.1552874, 2018.
Holzer, A., Govaerts, S., Ondrus, J., Vozniuk, A., Rigaud, D., Garbinato, B., Gillet, D.: SpeakUp – A Mobile App Facilitating Audience Interaction, in: Advances in Web-Based Learning – ICWL 2013, edited by: Wang, J. F. and Lau, R., ICWL 2013, Lecture Notes in Computer Science, Vol. 8167, Springer, Berlin, Heidelberg, https://doi.org/10.1007/978-3-642-41175-5_2, 2013.
Hurst, S. D.: Use of “virtual” field trips in teaching introductory geology, Comput. Geosci. 24, 653–658, https://doi.org/10.1016/S0098-3004(98)00043-0, 1998.
Iacobucci, G.: Covid-19: UK lockdown is “crucial” to saving lives, say doctors and scientists, theBMJ, 368, 1204, https://doi.org/10.1136/bmj.m1204, 2020.
Kelly, B., Phipps, L., and Swift, E.: Developing a Holistic Approach for E-Learning Accessibility, Canadian Journal of Learning and Technology/La revue canadienne de l'apprentissage et de la technologie, 30, Canadian Network for Innovation in Education, https://www.learntechlib.org/p/43221/ (last access: 29 September 2022), 2004.
Laksana, D. N. L.: Implementation of online learning in the pandemic covid-19: Student perception in areas with minimum internet access, J. Educ. Technol., 4, 502–509, https://doi.org/10.23887/jet.v4i4.29314, 2021.
Mann, H. B. and Whitney, D. R.: On a Test of Whether one of Two Random Variables is Stochastically Larger than the Other, Ann. Mathe. Stat., 18, 50–60, https://doi.org/10.1214/aoms/1177730491, 1947.
Manea, V. I., Macave, T., an Pribeanu, C.: Perceived benefits of online lectures during the pandemic: a case study in Engineering Education, Pro Edu. Int. J. Educ. Sci., 4, 35–41, https://doi.org/10.26520/peijes.2021.4.3.35-41, 2021.
Martínez-Graña, A. M., Goy, J. L., and Cimarra, C. A.: A virtual tour of geological heritage: Valourising geodiversity using Google Earth and QR code, Comput. Geosci., 61, 83–93, https://doi.org/10.1016/j.cageo.2013.07.020, 2013.
Mead, C., Buxner, S., Bruce, G., Taylor, W., Semken, S., and Anbar, A. D.: Immersive, interactive virtual field trips promote science learning, J. Geosci. Edu., 67, 131–142, https://doi.org/10.1080/10899995.2019.1565285, 2019.
Ochieng, V. O. and Gyasi, R. M.: Open educational resources and social justice: Potentials and implications for research productivity in higher educational institutions, E-Learn. Digital Media, 18, 105–124, https://doi.org/10.1177/2042753021989467, 2021.
Orion, N. and Hofstein, A.: Factors that influence learning during a scientific field trip in a natural environment, J. Res. Sci. Teach., 31, 1097–1119, https://doi.org/10.1002/tea.3660311005, 1994.
Pasquaré Mariotto, F. and Bonali, F. L.: Virtual geosites as innovative tools for geoheritage popularization: A case study from Eastern Iceland, Geosciences, 11, 149, https://doi.org/10.3390/geosciences11040149, 2021.
Pearson, W. and Reddy, V.: Social Justice and Education in the Twenty-First Century, in: Social Justice and Education in the 21st Century, edited by: Pearson Jr., W. and Reddy, V., Diversity and Inclusion Research, Springer, Cham, https://doi.org/10.1007/978-3-030-65417-7_1, 2021.
Pringle, J. K., Westerman, R., and Gardiner, A. R.: Virtual geological outcrops-fieldwork and analysis made less exhaustive?, Geol. Today, 20, 64–69, https://doi.org/10.1111/j.1365-2451.2004.00450.x, 2004.
Rotzien, J. R., Sincavage, R., Pellowski, C., Gavillot, Y., Filkorn, H., Cooper, S., Shannon, J., Yildiz, U., Sawyer, F., and Uzunlar, N.: Field-Based Geoscience Education during the COVID-19 Pandemic: Planning, Execution, Outcomes, and Forecasts, GSA Today, 31, 4–10, https://doi.org/10.1130/GSATG483A.1, 2021.
Sanders, C. K. and Scanlon, E.: The digital divide is a human rights issue: Advancing social inclusion through social work advocacy, J. Human Right. Soc. Work, 6, 130–143, https://doi.org/10.1007/s41134-020-00147-9, 2021.
Stokes, A. and Boyle, A. P.: The undergraduate geoscience fieldwork experience: Influencing factors and implications for learning, in: Field geology education: Historical perspectives and modern approaches, edited by: Whitmeyer, S. J., Mogk, D. W., and Pyle, E. J., GSA, 461, 291, 2009.
Tibaldi, A., Bonali, F. L., Vitello, F., Delage, E., Nomikou, P., Antoniou, V., Becciani, U., de Vries, B. V. W., Krokos, M., and Whitworth, M.: Real world–based immersive Virtual Reality for research, teaching and communication in volcanology, Bull. Volcanol., 82, 38, https://doi.org/10.1007/s00445-020-01376-6, 2020.
Tinto, V.: Learning better together: The impact of learning communities on the persistence of low-income students, Opport. Matt., 5–21, 2008.
Trinks, I., Clegg, P., McCaffrey, K., Jones, R., Hobbs, R., Holdsworth, B., Holliman, N., Imber, J., Waggott, S., and Wilson, R.: Mapping and analysing virtual outcrops, Vis. Geosci., 10, 13–19, https://doi.org/10.1007/s10069-005-0026-9, 2005.
Tuthill, G. and Klemm, E. B.: Virtual field trips: Alternatives to actual field trips, Int. J. Instruct. Media, 29, 453–468, 2002.
Wathington, H. D., Pretlow III, J., and Mitchell, C.: The difference a cohort makes: Understanding developmental learning communities in community colleges, J. College Stude. Retent. Res., Theory Pract., 12, 225–242, https://doi.org/10.2190/CS.12.2.f, 2010.
Whitmeyer, S. J. and Dordevic, M.: Creating virtual geologic mapping exercises in a changing world, Geosphere, 17, 226–243, https://doi.org/10.1130/GES02308.1, 2021.
Xia, J.: Analysis of impact of culture shock on individual psychology, Int. J. Psychol. Stud., 1, 97–101, 2009.