the Creative Commons Attribution 4.0 License.
the Creative Commons Attribution 4.0 License.
 | 22 Sep 2022
Is there a climate change reporting bias? A case study of English-language news articles, 2017–2022
Chloe Brimicombe
How weather hazards are communicated by the media is important. Which risks are understood, prioritized and acted upon can be influenced by the level of attention they receive. The presented work investigates whether or not the number of weather hazard news articles has increased since 2017, which weather hazards received the most attention in the news articles, and how often climate change was discussed in relation to weather hazards in these news articles. The methods used are advanced searches of Google and the Emergency Disaster Database (EM-DAT) for media articles considering weather hazards – specifically floods, heat waves, wildfires, storms and droughts – between 2017 and 2022. Results suggest that storms are more likely to be reported than any other climate risk, though wildfires generate more news articles per event. Bias in reporting needs to be addressed and is important, because it can exacerbate un-preparedness.
- Article
(675 KB) - Full-text XML
- BibTeX
- EndNote


The Intergovernmental Panel on Climate Change's AR6 report demonstrates that storms, flooding, heat waves, wildfires and droughts have been increasing in intensity and frequency with climate change (IPCC, 2021). Since 2017, there have been a number of notable weather events: the Pacific typhoon season in 2018, the European floods in 2021, and the Mediterranean heat wave and wildfires in 2021 (Gao et al., 2020; Kreienkamp et al., 2021; Philip et al., 2021; Sullivan, 2021).
Communication of a risk does not always lead to the risk being understood (Porter and Evans, 2020); however, the media is a key actor in communicating climate change and has a moral obligation to highlight the risks of extreme weather and what action is needed (Boykoff and Yulsman, 2013; Kitzinger, 1999). In addition, it has been found that the media gives more attention to sensationalist views on climate change instead of to the consensus view (Meah, 2019; Petersen et al., 2019).
Research demonstrates that the bias in reporting hazards and climate change leads to deficits in attention and material resources (i.e. not fully recognizing or addressing the risk) (Brimicombe et al., 2021a; Howarth and Brooks, 2017). In comparison, it has been found that when more visual hazards such as floods and storms (Wilby and Vaughan, 2011) are used to demonstrate climate change risk – also known as objectifying climate change – there is an improved understanding of climate risk (Höijer, 2010).
Reported here for the first time, this study uses open science principles (Armeni et al., 2021; Nosek et al., 2015) alongside the advanced search tools provided by Google and the Emergency Disaster Database (EM-DAT) (CRED, 2020) to examine how weather hazards are mentioned in news articles published between 2017 and 2022. The aim is to understand: (1) whether or not the number of articles focused on weather hazards has increased since 2017; (2) which weather hazards receive the most attention; and (3) how often climate change is discussed in relation to those weather hazards.
All the methods and data chosen for this study are in keeping with open data and open science. Open data is where the research results are reproducible and transparent, whilst open science is a term given to the removal of the barriers to sharing any kind of output (Armeni et al., 2021).
2.1 Advanced Google search
An advanced Google search of the news category was carried out for the period of 1 January 2017 to 1 January 2022. Google was chosen, as it has the most comprehensive results in comparison to other search engines (i.e. Bing) and tools to assist with advanced searches. The search involved two stages: first, a search for all news articles in the relevant period containing the keywords “flood”, “heat wave”, “wildfire”, “storm” and “drought” was conducted; second, this search criterion was repeated with the keywords “climate change” (Brimicombe et al., 2021b). Each term was assessed to consider whether it captured the most articles – for example, using “heat wave” not “heatwave” and “climate change” not “climate crisis” or “global warming”. Each hazard was evaluated separately and their results compared, with duplicated results not included. Articles that mention more than one weather hazard were counted twice.
To counter any overestimates that occur where articles are not discussing a weather hazard but are using the term to describe something else, the approach taken is to look at the first 100 article headlines and to remove articles not discussing a weather hazard to give a better estimate of the true number of news articles. Examples included articles discussing “Goal droughts”, “NFL Storm” and “the single Heat Waves from the band Glass Animals”. Then, this proportion of articles was removed from the overall total, giving a new overall count of articles. For example, for the keyword “storms” in 2017, the initial search returned 6.31 million articles, but 21 out of the first 100 were not about the weather hazard, so 4.98 million articles were counted for storms.
Limitations in this method do remain, as it can still capture articles not explicitly about weather hazards; however, this is limited by the proportional approach taken. In addition, it is only likely to capture the English news media and will give a slightly different number of articles between users. As such, it is recommended that further, in-depth research should be carried out looking at news media sentiment.
2.2 EM-DAT hazard reporting
To supplement the findings of the advanced Google search, another source of data is used that is in keeping with open science: the Emergency Events Disaster Database (EM-DAT) EM-DAT is the leading international disaster database; it contains details of over 22 000 mass disasters that have occurred worldwide since 1900 and is compiled from a range of sources, including UN agencies and non-governmental organizations (NGOs) (CRED, 2020). This provides an overview of the number of weather hazards that have occurred every year for the last 5 years. This then allows for an assessment of how many articles have been written on average about each weather hazard. Figure 1 shows a count of the weather hazards included in EM-DAT that are considered by this study and that have occurred every year from 2017 to 2021 (CRED, 2020).

Figure 1The total number of disasters reported per weather hazard for the last 5 years, as reported in EM-DAT (CRED, 2020).
The limitations of this method are that there are biases in how hazards in this database are reported and that there is an underreporting of hazards by this database (Brimicombe et al., 2021a; Gall et al., 2009). In addition, this database only includes hazards that are considered a disaster, where an agency declares a state of emergency, or where it is reported that over 100 people have been affected (CRED, 2020). However, it remains the most comprehensive source of reported weather hazards (Brimicombe et al., 2021a; Gall et al., 2009).
3.1 Has the number of weather hazard news articles increased since 2017?
Between 2017 and 2022, there has been an increase in the number of English-language news media articles for all weather hazards, amounting to more than 142 million articles over the last 5 years. In 2021, 28.1 million articles were about storms, whereas 169 000 articles were about heat waves (Fig. 2). Of interest, only 0.7 % of all news articles mentioned climate change and weather hazards together. The results for the number of articles mirror those for overall news articles written.
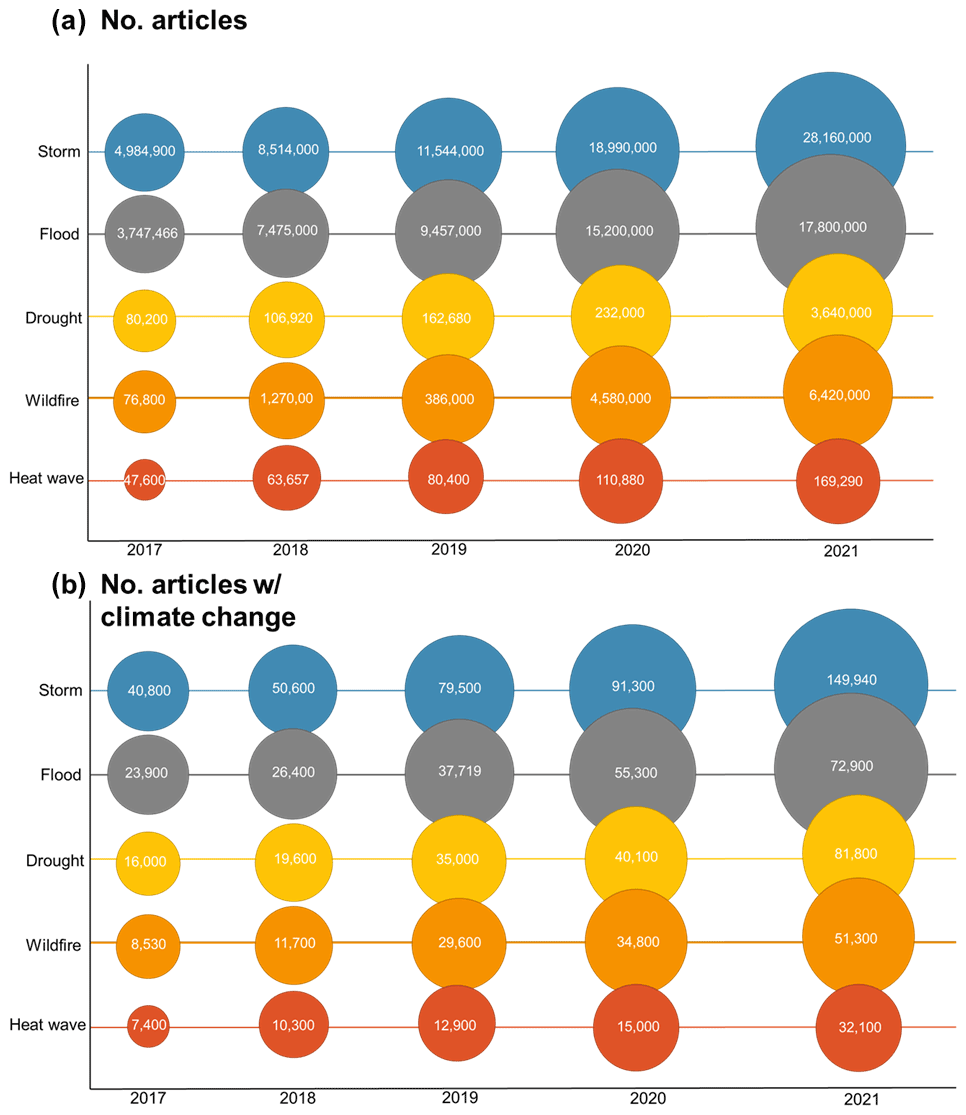
Figure 2Number of articles per hazard per year for 2017 to 2022; (a) indicates overall article numbers, while (b) indicates only articles that contain weather hazards and climate change as their subject.
3.2 Which weather hazards receive the most attention in news articles?
The results in Sect. 3.1 change when the number of articles is considered as a proportion of the number of weather hazards reported in CRED (2020, their Table 1). The approach taken here is to aggregate the totals per hazard for the last 5 years to reduce the influence of the underreporting bias in EM-DAT. Figure 3 is another representation of the reporting bias introduced by EM-DAT, where the total costs for each hazard each year are shown. No losses are attributed to heat waves. The results for total damages mirror those for the total number of articles written. It can therefore be suggested that articles are more likely to be written for hazards that have the biggest financial losses associated with them.
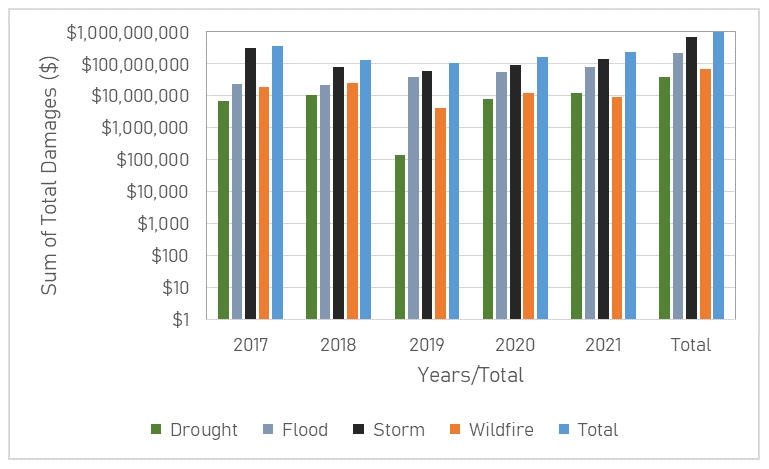
Figure 3Sum of Total Damages for each hazard per year as reported by EM-DAT, heat wave cannot be seen as no damages are recorded (CRED, 2020).
Overall, for each individual weather hazard (total number of articles for all hazards in Fig. 2/total number of reported hazards in Fig. 1), 89 000 articles were written on average; however, the picture for each hazard varies widely – for example, one storm could have 10 times more articles written about it than another. A future study on this would be beneficial. On average, per wildfire (total number of articles about wildfires/total number of reported wildfires), there have been a total of 175 000 articles written in the last 5 years (Fig. 4). The weather hazard with the least number of articles per weather hazard occurrence over the last 5 years is heat waves, with an average of 12 000 articles (Fig. 4).
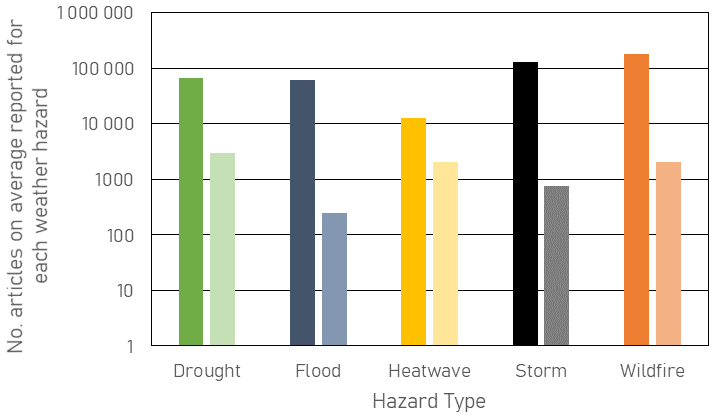
Figure 4The average number of articles per individual hazard category for the last 5 years. Dark colour is total number of articles and light colour is articles including climate change. (Number of articles in Fig. 2a or b/total recorded hazards for each hazard type in Fig. 1.)
3.3 How often is climate change discussed in relation to weather hazards in these news articles?
Overall, for each individual weather hazard, an average of 650 articles that also consider climate change were written (total number of articles including climate change in Fig. 2/total number of hazards reported in Fig. 1). The hazard with the most articles written is drought – on average, per drought, there have been 3 000 articles written in the last 5 years (Fig. 4). The weather hazard with the least number of articles written per weather hazard occurrence over the last 5 years is floods, with an average of 200 articles (Fig. 4).
4.1 Why are some hazards discussed by English-language news media more?
Heat waves have the least amount of news media articles. This should not be of surprise, given other research demonstrating the consistent underreporting of this weather hazard (Harrington and Otto, 2020; Vogel et al., 2019). It may, however, be of surprise, given the number of record-breaking heat waves during recent years, such as the June 2021 Pacific North-West heat wave, which was attributed to climate change (Philip et al., 2021).
How notable events or weather hazards get attention and are reported is subject to “newsworthiness”, which is the political economy between society and the media (Boykoff and Yulsman, 2013; Kitzinger, 1999). This newsworthiness is made up of four main factors: the availability effect or heuristic, which is when a hazard is presented as a risk before it is likely to be remembered in this manner; stories from impacted groups; whether or not the hazard is geographically bound; and whether or not a hazard is visually impactful (Kitzinger, 1999; Tomlinson et al., 2011). The results of this study show that the hazards that fit these criteria the most were storms, which have the most articles by quantity, and wildfires, which at have the most articles per individual occurrence.
4.2 How does English-language news media discuss climate change and hazards?
Per individual weather hazard, on average, the articles that also consider climate change do not comply with the newsworthiness criteria outlined above; therefore droughts, wildfires and heat waves have the most articles. Instead, the media can be suggested to follow the science where it is seen these hazards are easier to attribute to climate change than floods or storms (Ciavarella et al., 2020; Kreienkamp et al., 2021). While the media does have a moral obligation and plays a key role in communicating climate risk, how science, the public and those in positions of power communicate climate change has an influence on what is portrayed by the media (Boykoff and Yulsman, 2013; van der Hel et al., 2018; Howarth and Anderson, 2019).
Therefore, it could be suggested that this reporting of climate change has come about through the increasing collaboration between science (across career stages) and the media. Examples of this collaboration include Science Media Centre (https://www.sciencemediacentre.org/, last access: 23 January 2022), The Conversation (https://theconversation.com/uk, last access: 23 January 2022) and Voice of Young Science (https://senseaboutscience.org/what-we-are-doing/voys/, last access: 23 January 2022). This comes in spite of the discourse around the role of science in both communication and policy spaces (Boykoff and Yulsman, 2013; Pielke, 2007).
4.3 Why is consistent reporting important?
The attention deficit in English-language news media leads to a lack of investment in adaptation for some hazards, making us unprepared. In addition, this pushes us towards more precarious tipping points, where adaptation becomes more of a challenge for society (Howarth and Brooks, 2017). This study's results highlight a huge reporting bias in favour of storms and wildfires in the news media. This has a material cost, where storms receive more research, funding and policy than other hazards (Brimicombe et al., 2021b; Harrington and Otto, 2020; Howarth and Brooks, 2017; Vogel et al., 2019).
However, despite ranking second in terms of the overall number of articles, per individual occurrence, floods have the least number of articles. This could be an indication that there is a larger range in the number of articles written per flood (i.e. one flood has 1 million articles, but another only has 1 000 articles); this is something that should be explored further in a news media sentiment study, with particular focus given to geographical bias.
4.4 What does using an open science approach demonstrate?
This study uses advanced Google search trends to show the bias that is apparent in English-language news media surrounding weather hazards and climate change. This is not the most robust method to carry out a study of this kind; however it is the most accessible. For example, long-scale newspaper databases are not free to access.
Using an open science approach highlights the transparency surrounding the reporting bias (Armeni et al., 2021). This is a positive, because it means that it is easy to track improvements and changes in reporting. Bias reduces the ability of reporting as a tool to reduce hazard risk, and highlighting it is the first step in changing the narrative (Brimicombe et al., 2021a, b).
There is a bias in terms of which weather hazards English-language news media report on and a bias in terms of which weather hazards are linked to climate change. This is important, because in terms of material cost, some hazards generate more investment than others. This leads to under-preparedness for specific hazards as a result of underreporting regarding their impacts. Reporting is a key way that we can improve communication, and it plays a part in avoiding societal tipping points. This study suggests that greater collaboration between scientists (across career stages) and the English-language news media is key to improving reporting overall and to continue to grow the reporting of the risks of weather hazards and their intrinsic links with climate change.
All data is available via advanced Google searches and the EM-DAT database (https://www.emdat.be/, last access: 15 June 2020; CRED, 2020).
The author has declared that there are no competing interests.
Ethics approval and informed consent were not sought; this study does not deal with sensitive data or human participants.
Publisher's note: Copernicus Publications remains neutral with regard to jurisdictional claims in published maps and institutional affiliations.
I would like to acknowledge the useful feedback from reviewers and editors on this paper, which has helped to improve the quality.
This paper was edited by Solmaz Mohadjer and Tiziana Lanza and reviewed by Shiba Subedi and one anonymous referee.
Armeni, K., Brinkman, L., Carlsson, R., Eerland, A., Fijten, R., Fondberg, R., Heininga, V. E., Heunis, S., Koh, W. Q., Masselink, M., Moran, N., Baoill, A., Sarafoglou, A., Schettino, A., Schwamm, H., Sjoerds, Z., Teperek, M., van den Akker, O. R., van't Veer, A., and Zurita-Milla, R.: Towards wide-scale adoption of open science practices: The role of open science communities, Sci. Publ. Policy, 48, 605–611, https://doi.org/10.1093/scipol/scab039, 2021.
Boykoff, M. T. and Yulsman, T.: Political economy, media, and climate change: Sinews of modern life, WIREs Clim. Change, 4, 359–371, https://doi.org/10.1002/wcc.233, 2013.
Brimicombe, C., Di Napoli, C., Cornforth, R., Pappenberger, F., Petty, C., and Cloke, H. L.: Borderless Heat Hazards With Bordered Impacts, Earths Future, 9, e2021EF002064, https://doi.org/10.1029/2021EF002064, 2021a.
Brimicombe, C., Porter, J. J., Di Napoli, C., Pappenberger, F., Cornforth, R., Petty, C., and Cloke, H. L.: Heatwaves: An invisible risk in UK policy and research, Environ. Sci. Policy, 116, 1–7, https://doi.org/10.1016/j.envsci.2020.10.021, 2021b.
Ciavarella, A., Cotterill, D., Stott, P., Kew, S., Philip, S., van Oldenborgh, G. J., Skålevåg, A., Robin, Y., Otto, F., Hauser, M., Seneviratne, S. I., Lehner, F., and Zolina, O.: Siberian heatwave of 2020 almost impossible without climate change, World Weather Attribution, 15 July 2020.
CRED (Centre for Research on the Epidemiology of Disasters): EM-DAT | The international disasters database, EM-DAT, https://www.emdat.be/, last access: 15 June 2020.
Gall, M., Borden, K. A., and Cutter, S. L.: When do losses count?, B. Am. Meteorol. Soc., 90, 799–809, https://doi.org/10.1175/2008BAMS2721.1, 2009.
Gao, S., Zhu, L., Zhang, W., and Shen, X.: Western North Pacific Tropical Cyclone Activity in 2018: A Season of Extremes, Scientific Reports, 10, 5610, https://doi.org/10.1038/s41598-020-62632-5, 2020.
Harrington, L. J. and Otto, F. E. L.: Reconciling theory with the reality of African heatwaves, Nat. Clim. Change, 10, 796–798, https://doi.org/10.1038/s41558-020-0851-8, 2020.
Höijer, B.: Emotional anchoring and objectification in the media reporting on climate change, Public Underst. Sci., 19, 717–731, https://doi.org/10.1177/0963662509348863, 2010.
Howarth, C. and Anderson, A.: Increasing Local Salience of Climate Change: The Un-tapped Impact of the Media-science Interface, Environmental Communication, 13, 713–722, https://doi.org/10.1080/17524032.2019.1611615, 2019.
Howarth, C. and Brooks, K.: Decision-Making and Building Resilience to Nexus Shocks Locally: Exploring Flooding and Heatwaves in the UK, Sustainability, 9, 838, https://doi.org/10.3390/SU9050838, 2017.
IPCC: Climate Change 2021: The Physical Science Basis. Contribution of Working Group I to the Sixth Assessment Report of the Intergovernmental Panel on Climate Change, edited by: Masson-Delmotte, V., Zhai, P., Pirani, A., Connors, S. L., Péan, C., Berger, S., Caud, N., Chen, Y., Goldfarb, L., Gomis, M. I., Huang, M., Leitzell, K., Lonnoy, E., Matthews, J. B. R., Maycock, T. K., Waterfield, T., Yelekçi, O., Yu, R., and Zhou, B., Cambridge University Press, Cambridge, United Kingdom and New York, NY, USA, 2391 pp., https://doi.org/10.1017/9781009157896, 2021.
Kitzinger, J.: Researching risk and the media, Health. Risk Soc., 1, 55–69, https://doi.org/10.1080/13698579908407007, 1999.
Kreienkamp, F., Philip, S. Y., Tradowsky, J. S., Kew, S. F., Lorenz, P., Arrighi, J., Belleflamme, A., Bettmann, T., Caluwaerts, S., Chan, S. C., Ciavarella, A., De Cruz, L., de Vries, H., Demuth, N., Ferrone, A., Fischer, E. M., Fowler, H. J., Goergen, K., Heinrich, D., Henrichs, Y., Lenderink, G., Kaspar, F., Nilson, E., and Otto, F. E. L.: Rapid attribution of heavy rainfall events leading to the severe flooding in Western Europe during July 2021, World Weather Attribution (WWA), https://www.worldweatherattribution.org/heavy-rainfall-which-led-to-severe-flooding-in-western-europe- made-more-likely-by-climate-change/, last access: 26 August 2021.
Meah, N.: Climate uncertainty and policy making–what do policy makers want to know?, Reg. Environ. Chang., 19, 1611–1621, https://doi.org/10.1007/s10113-019-01492-w, 2019.
Nosek, B. A., Alter, G., Banks, G. C., Borsboom, D., Bowman, S. D., Breckler, S. J., Buck, S., Chambers, C. D., Chin, G., Christensen, G., Contestabile, M., Dafoe, A., Eich, E., Freese, J., Glennerster, R., Goroff, D., Green, D. P., Hesse, B., Humphreys, M., Ishiyama, J., Karlan, D., Kraut, A., Lupia, A., Mabry, P., Madon, T. A., Malhotra, N., Mayo-Wilson, E., McNutt, M., Miguel, E., Paluck, E. L., Simonsohn, U., Soderberg, C., Spellman, B. A., Turitto, J., VandenBos, G., Vazire, S., Wagenmakers, E. J., Wilson, R., and Yarkoni, T.: Promoting an open research culture, Science, 348, 1422–1425, https://doi.org/10.1126/science.aab2374, 2015.
Petersen, A. M., Vincent, E. M., and Westerling, A. L. R.: Discrepancy in scientific authority and media visibility of climate change scientists and contrarians, Nat. Commun., 10, 3502, https://doi.org/10.1038/s41467-019-09959-4, 2019.
Philip, S. Y., Kew, S. F., van Oldenborgh, G. J., Anslow, F. S., Seneviratne, S. I., Vautard, R., Coumou, D., Ebi, K. L., Arrighi, J., Singh, R., van Aalst, M., Pereira Marghidan, C., Wehner, M., Yang, W., Li, S., Schumacher, D. L., Hauser, M., Bonnet, R., Luu, L. N., Lehner, F., Gillett, N., Tradowsky, J., Vecchi, G. A., Rodell, C., Stull, R. B., Howard, R., and Otto, F. E. L.: Rapid attribution analysis of the extraordinary heatwave on the Pacific Coast of the US and Canada June 2021, Earth Syst. Dynam. Discuss. [preprint], https://doi.org/10.5194/esd-2021-90, in review, 2021.
Pielke, R. A.: The honest broker: making sense of science in policy and politics, 1st edn., Cambridge University Press, Cambridge, https://doi.org/10.1017/CBO9780511818110, 2007.
Porter, J. J. and Evans, G.: Unreported world: A critical analysis of UK newspaper coverage of post-disaster events, Geogr. J., 186, 327–338, https://doi.org/10.1111/GEOJ.12353, 2020.
Sullivan, H.: Summer of fire: blazes burn across Mediterranean with more extreme weather forecast, the Guardian, https://www.theguardian.com/environment/2021/aug/13/ summer-of-fire-blazes-mediterranean-more-extreme- weather-forecast, last access: 26 August 2021.
Tomlinson, C. J., Chapman, L., Thornes, J. E., and Baker, C. J.: Including the urban heat island in spatial heat health risk assessment strategies: A case study for Birmingham, UK, Int. J. Health Geogr., 10, 42, https://doi.org/10.1186/1476-072X-10-42, 2011.
van der Hel, S., Hellsten, I., and Steen, G.: Tipping Points and Climate Change: Metaphor Between Science and the Media, Environmental Communication, 12, 605–620, https://doi.org/10.1080/17524032.2017.1410198, 2018.
Vogel, M. M., Zscheischler, J., Wartenburger, R., Dee, D., and Seneviratne, S. I.: Concurrent 2018 Hot Extremes Across Northern Hemisphere Due to Human-Induced Climate Change, Earths Future, 7, 692–703, https://doi.org/10.1029/2019EF001189, 2019.
Wilby, R. L. and Vaughan, K.: Hallmarks of organisations that are adapting to climate change, Water Environ. J., 25, 271–281, https://doi.org/10.1111/j.1747-6593.2010.00220.x, 2011.