the Creative Commons Attribution 4.0 License.
the Creative Commons Attribution 4.0 License.
 | 24 Jun 2021
Development and implementation of virtual field teaching resources: two karst geomorphology modules and three virtual capstone pathways
During the summer of 2020, many geology field camps were canceled due to the COVID-19 pandemic, including the karst geomorphology field course I was scheduled to co-teach through Western Kentucky University. When the National Association of Geoscience Teachers (NAGT), in collaboration with the International Association for Geoscience Diversity (IAGD), began the project of supporting working groups to create online field experience teaching materials, this presented an opportunity. This paper describes the development of two activities derived from that field camp curriculum that are now freely available as peer-reviewed exemplary teaching activities on the Science Education Resource Center (SERC) Online Field Experiences repository under “Karst hydrogeology: a virtual field introduction using © Google Earth and Geographic Information Systems (GIS)” and “Karst hydrogeology: a virtual field experience using © Google Earth, GIS, and TAK [Topographic Analysis Kit].” Each product includes a student handout, an instructor workflow reference, a grading rubric, and NAGT-established learning objectives. The introductory activity is the more basic of the two, is expected to take about an 8 h workday to teach, and walks students through all the steps, as well as providing global examples of karst landscapes that can be virtually explored. The other activity, “Karst hydrogeology and geomorphology”, assumes student familiarity with © Google Earth, GIS, and karst drainage systems and is expected to take about twice as long as the introductory activity to teach. To make these learning opportunities financially accessible, all software required for the activities is open source, and alternative workflows for the introductory module are provided so that the entire exercise can be completed using a mobile device. Addressing this need for virtual capstone options during the pandemic, and providing a virtual alternative for years to come, these karst activities, along with a subset of other SERC activities, were assembled into three learning tracks, each one providing learning hours equivalent to a traditional field camp, that have been added to the course offerings at the University of Cincinnati Department of Geology. In addition to providing online capstone activities in the time of a pandemic, these learning materials provide alternative experiences to traditional field camps that are inclusive for all geoscience students.
- Article
(8170 KB) - Full-text XML
- BibTeX
- EndNote


This paper presents, in detail, the development of two virtual field experiences, namely “Karst hydrogeology: a virtual field introduction using © Google Earth and Geographic Information Systems (GIS)”, and “Karst hydrogeology: a virtual field experience using © Google Earth, GIS, and Topographic Analysis Kit (TAK)”. Following the description of these specific activities, three virtual capstone pathways are presented that incorporate the karst modules in addition to several other activities from the Science Education Resource Center (SERC) Online Field Experiences repository (https://serc.carleton.edu/NAGTWorkshops/online_field/activities.html; last access: 13 June 2021). Finally, the content of an interview with the instructor of one of those pathways is presented as a preliminary evaluation of the materials following their initial offering by the Department of Geology at the University of Cincinnati.
Both karst activities described in this paper are available in the SERC repository as part of the Teaching with Online Field Experiences Exemplary collection. This exemplary rating is an official designation resulting from the peer-review process (Burmeister et al., 2020) for the Teach the Earth portal for Earth education.
These activities were designed with a constructivist teaching approach (Brooks and Brooks, 1999). Structure is provided to guide students as they explore questions pertaining to karst landscapes. After completion of the activities, they may have developed a deeper understanding of the complexities of karst hydrogeology and geomorphology and an accelerated curiosity to learn more. In each activity, students are guided through the technical details of using open-source software tools to select and explore a karst landscape. Detailed step-by-step instructions are provided for obtaining digital elevation models (DEMs) from internet sources and then visualizing and analyzing these landscapes with QGIS, an open-source GIS software. Instruction on performing more advanced landscape analysis is provided in the advanced module when students use TAK to perform flow routing over their DEM.
While both activities require internet access for participation, socioeconomic and accessibility barriers were considered in an attempt to provide opportunities for more inclusive learning experiences. Therefore, all parts of both activities were built around using open-source software. Additionally, if a learner does not have a laptop or personal computer in their home, an alternative workflow for the introductory activity is presented, such that the entire activity can be completed using a smartphone or internet-enabled tablet. This approach, considering the universal design for learning (UDL), provides students with multiple means of representation for an accessible learning experience. Additionally, the learning assessment for these activities is written such that there is flexibility in the way individual students or small groups of students present their findings so that multiple means of expression are built in. These activities are designed for 100 % online delivery, either synchronously, asynchronously, or using a combination of those approaches. Addressing physical and nonphysical barriers, incorporating UDL, and teaching field experiences synchronously online have been proven to provide more inclusive learning experiences (Carabajal and Atchison, 2020).
Prior to the COVID-19 pandemic, many virtual field experiences were premised on some people being able to access the field while others were not. Technology, such as two-way video conferencing in a remote collaboration model, was used to include everyone in the field experience (Carabajal et al., 2017; Marshall, 2018). However, in some cases, entire classes were not able to access the field due to logistical or institutional situations. Instructors, in these cases, pioneered taking advantage of technology such as drones, lidar, structure-from-motion photogrammetry, and © Google Earth to bring the field to the classroom (Atchison and Feig, 2011; Clary and Wandersee, 2010; Dolphin et al., 2019; Granshaw, 2011). It is to these latter cases that we looked when refining the choices of technology and software when, in 2020, no one could access those in-person field experiences.
1.1 Learning objectives
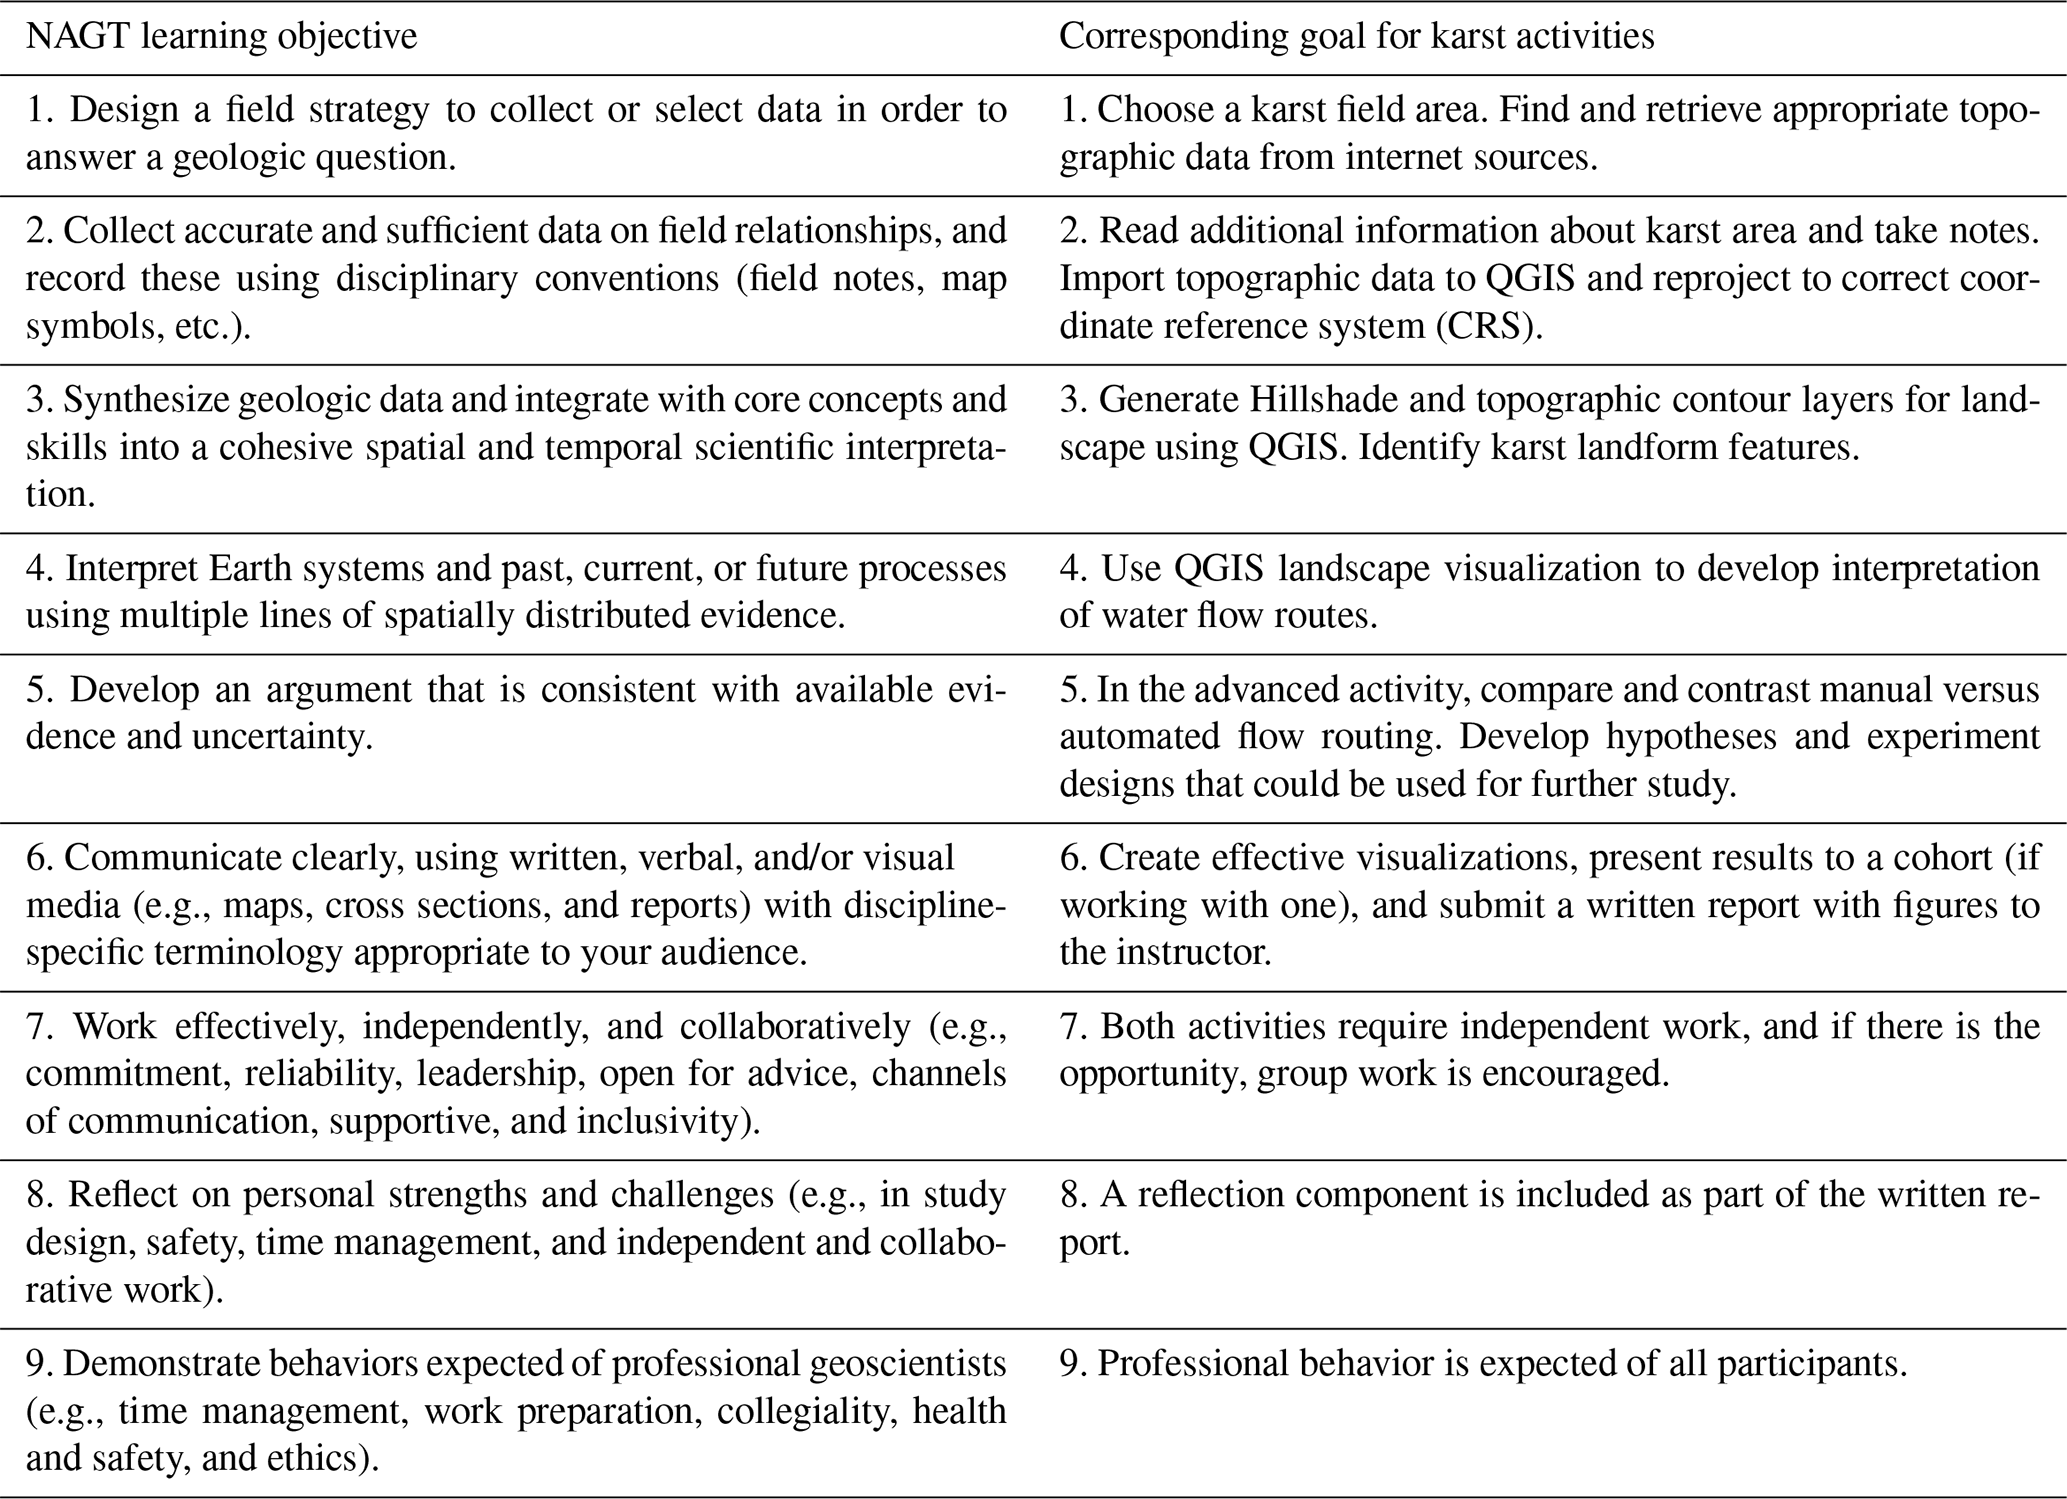
The group guiding the National Association of Geoscience Teachers (NAGT) and International Association for Geoscience Diversity (IAGD) joint effort to develop remote learning experiences for the 2020 field camp season collaborated to determine a set of learning objectives (NAGT, 2020). All activities developed as a part of this initiative were expected to address as many of these as possible (Table 1).
Table 1NAGT virtual field experiences learning objectives and how they were applied to the karst activities.
Through the activity, “Karst hydrogeology: a virtual field introduction using © Google Earth and GIS” (https://serc.carleton.edu/NAGTWorkshops/online_field/activities/237039.html; last access: 13 June 2021), students have the opportunity to select and virtually explore the hydrogeology and geomorphology of a karst landscape using © Google Earth, lidar-data-sourced digital elevation models (DEMs), geologic maps, and GIS software (QGIS) such that they gain an understanding of karst landscapes and their associated hazards, can access and analyze internet-based remote sensing data, and employ verbal and written communication of scientific information. This basic activity is suitable for use in upper-level undergraduate geomorphology or groundwater hydrogeology courses or as part of a capstone activity for graduating seniors. The main concepts explored are karst geomorphology, karst hydrogeology, © Google Earth image interpretation, and basic GIS landscape analysis, including coordinate reference system reprojection, Hillshade raster generation, and elevation contour extraction.
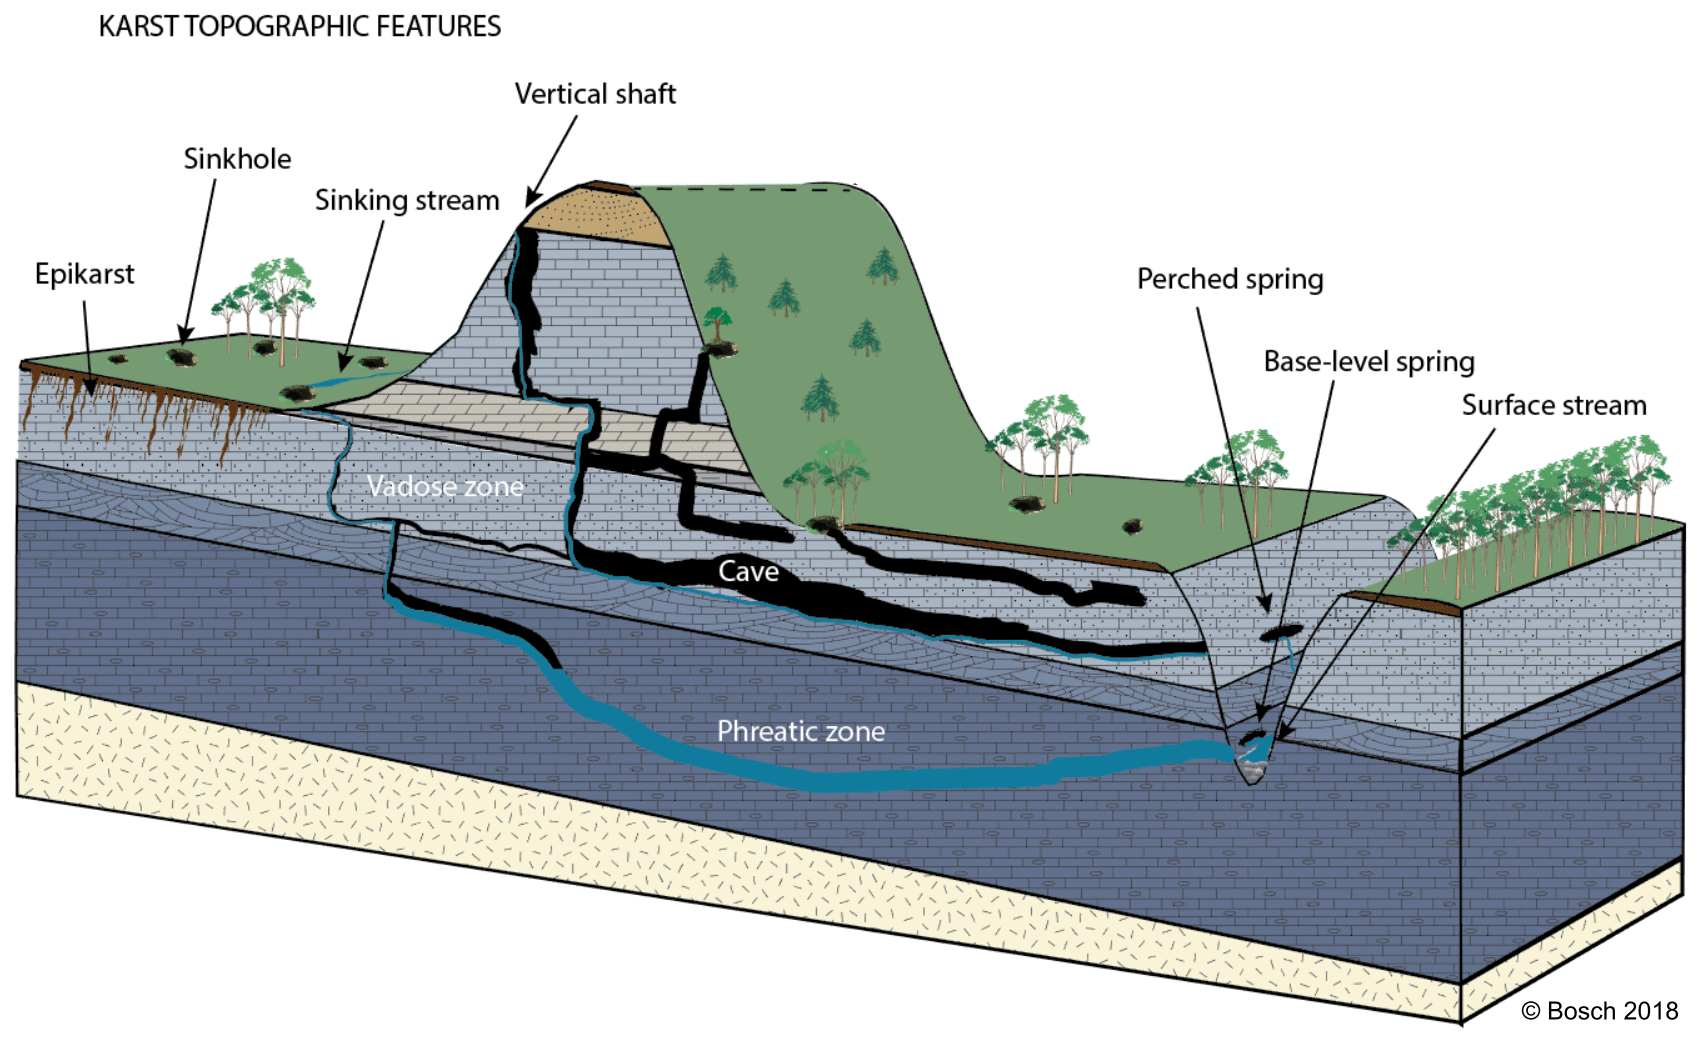
Karst landscapes refer to regions where the predominant groundwater storage and flow is through discrete conduits or cave passages. Surface streams tend to be scarce and short in length when they do occur. Landforms typical of karst include caves, sinkholes, dolines, poljes, fensters, sinking streams, springs, and vertical shafts (Fig. 1). According to Goldscheider et al. (2020), “15.2 % of the global ice-free continental surface is characterized by the presence of karstifiable carbonate rock.” Because of this relative prevalence of karst and its particular environmental vulnerability, it is important that students receive significant academic exposure to the way water behaves in karst aquifers.
2.1 Expectations
While there is no specific prerequisite coursework, students are expected to have familiarity with the concept of karst landscapes and topographic map reading. Additionally, previous experience with © Google Earth and other geographical information systems is helpful but not necessary. This introductory activity is expected to take from 4 to 8 h to complete and can be taught as a stand-alone exercise or in conjunction with other modules to build a capstone field experience.
2.2 Learning goals
The learning goals for this introductory karst activity are consistent with the NAGT/IAGD effort objectives outlined in the introduction (Table 1).
-
Content and/or conceptual goals for this activity are as follows:
-
visually identify karst landscapes (particularly in contrast to fluvial landscapes) from aerial imagery
-
interpret topographic maps to determine drainage patterns.
-
-
Higher-order thinking goals for this activity are as follows:
-
compare and contrast the water drainage patterns of a karst watershed with a surface stream network or porous-media groundwater aquifer
-
integrate digital and analog data
-
analyze digital and analog data to draw conclusions about landscape-associated hazards.
-
-
Other goals for this activity are as follows:
-
navigate © Google Earth
-
search the internet, including the United States Geological Survey (USGS)'s EarthExplorer website
-
manipulate data in a GIS for analysis and presentation
-
create an oral presentation or video presentation
-
promote teamwork both synchronously and asynchronously
-
develop technical writing skills
-
reflect on work done
-
perform a self-assessment
-
manage data
-
gain independence
-
learn personal management
-
learn about time management
-
develop leadership skills.
-
2.3 Activity description and teaching materials
About 16.5 % of the world's population lives on karst landscapes (Goldscheider et al., 2020). It is therefore important that we understand the drainage patterns, potential hazards to humans, and potential threats to water quality that are unique to karst landscapes. In this exercise, students select and virtually explore a karst landscape. Materials available on the SERC repository include a student handout, teaching notes, a grading rubric, and several internet links for background and supplemental information. The teaching notes include a step-by-step walk-through of the activity procedure, including screenshots of the anticipated outcomes. In this way, the modules can be available to a wide range of instructors and learners.
For this activity, students need access to an internet-enabled laptop or other device, © Google Earth via a web, mobile, or desktop connection, and a geographic information system (GIS). QGIS (https://www.qgis.org/en/site/; last access: 13 June 2021) is recommended as a free and open-source option which works best as a desktop application. As part of this exercise, students may have the opportunity to experience manipulating DEM data with a GIS. However, the reality is that not all students have access to a laptop, and GIS tools on mobile devices may not offer full functionality. One option for a fully mobile-based activity is to bypass the GIS step and move straight from © Google Earth to accessing a pre-existing topographic map. Mobile apps change frequently, so there is a legacy issue in promoting specific apps. However, the USGS has created a great tutorial video (with embedded closed-captioning) for how to access topographical maps from a mobile device (https://www.usgs.gov/media/videos/using-us-topo-and-historic-topo-maps-your-mobile-device; last access: 13 June 2021). For this approach, students would skip steps 2, 3, and 4 (which are outlined below), following the procedure in the USGS video. They can then use a drawing app on their device to complete step 5.
Students may work in groups or independently to complete the activity. Presentations may be delivered as a group, and final reports should be written and submitted independently.
The activity begins by providing resources for students to review the basics of karst hydrogeology. On the student handout, there are © Google Earth links for seven different field areas from around the world. These locations were selected to provide learners with the option to study a karst area on any continent (with the exception of Antarctica) and to present karst areas that are well-known or otherwise geologically or biologically significant. The intent is that one of these areas may pique the students' interest and keep them engaged throughout the activity. Learners can browse © Google Earth and select from the following options for a karst region to focus on for the remainder of the exercise (Fig. 2):
-
Central Kentucky Karst, USA
-
Sótano de las Golondrinas, Mexico
-
Caverna de Santana, Brazil
-
Sof Omar Cave, Ethiopia
-
Postojna Cave, Slovenia
-
Tenglong Cave, China
-
Waitomo Cave, New Zealand.
- 1.
Once students have selected their karst landscape, they need to acquire topographic and geologic map information. For locations in the United States, EarthExplorer (https://earthexplorer.usgs.gov/; last access: 13 June 2021) is a good source for Shuttle Radar Topography Mission (SRTM) DEM files. Students who choose sites outside of the United States can still find their DEM data but need to search the internet to obtain it.
- 2.
The DEM file then needs to be uploaded to a GIS. For many DEMs, students will need to find the appropriate CRS and reproject their raster. References are provided for students to review the Universal Transverse Mercator (UTM) system and find UTM zones, and detailed directions for reprojecting DEMs in QGIS are also given.
- 3.
After their project is in the correct CRS, they generate a Hillshade layer to better visualize the topography (Fig. 3). They then answer the following questions: what karst aquifer region did you select? What UTM zone is this field site in? What color band worked best for your visualization of the topography? What does the Hillshade function do? How is it helpful?
- 4.
This projected and shaded map should now render a more accurate and realistic visualization of the chosen field site. To better understand the drainage patterns of this landscape, they extract two sets of topographic contour lines, i.e., one set for all the contour lines and a second, more widely spaced, set for index contours. They are asked what contour intervals they chose and why (Fig. 4).
- 5.
Now that the students have detailed topographic maps with contour intervals, they are given a resource to revisit the rule of V's for determining flow paths over land surfaces (Olivas, 2017). If students have access to a printer, they can print out a paper copy of the map they built and draw the drainage patterns in with a pencil. There are two digital options for drawing in the water flow paths. For the first, students can export the image of their map in QGIS as a .png format and then use a photo editor to draw flow paths on their maps. There are many software packages available to complete this step. A couple of open-source options are © Google Slides (Fig. 5) and Inkscape. Students may also choose to work directly in the GIS and create a new vector layer to manage their surface flow paths. Here are the questions posed to students after this step: describe the flow paths you drew on your map. What challenges or obstacles did you encounter while determining the routes water would take? What environmental or natural disaster hazards do you think might be issues in this landscape?
- 1.
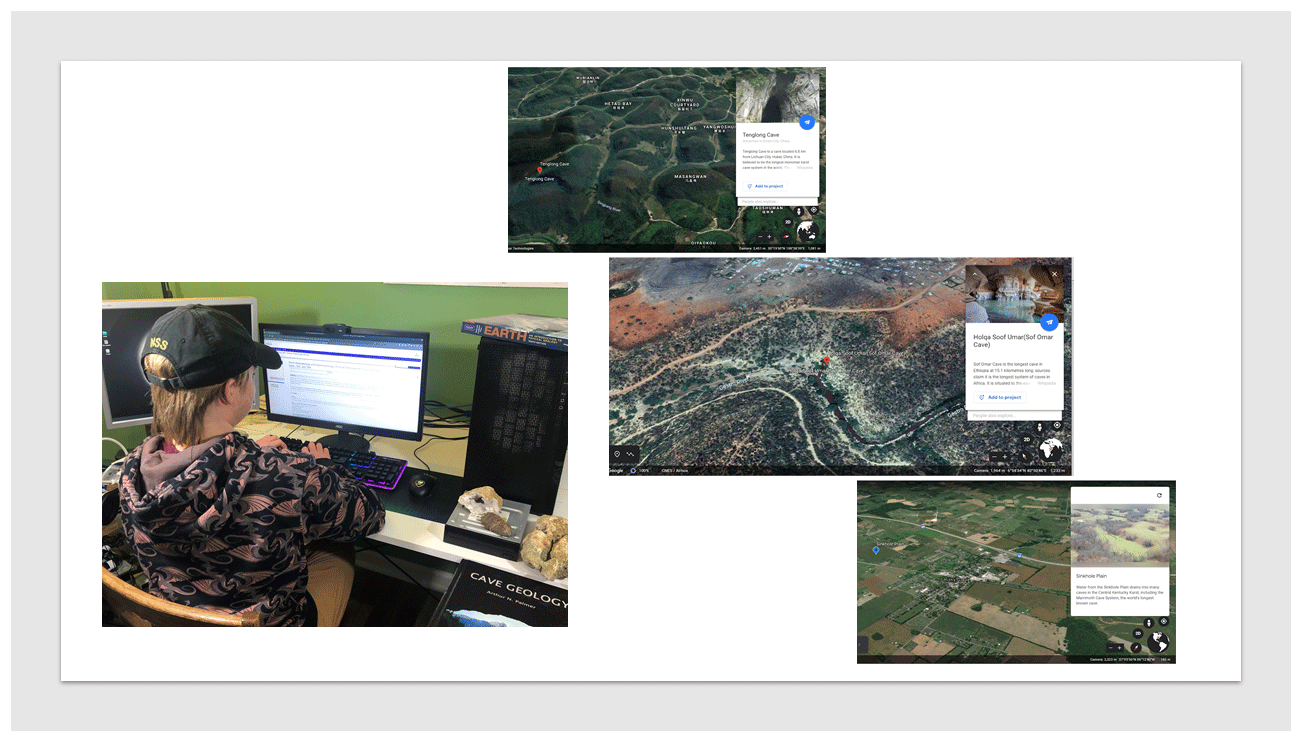
Figure 2Student choosing a karst area to study. Images of the © Google Earth pages for Tenglong Cave, China, Sof Omar Cave, Ethiopia, and the Central Kentucky Sinkhole Plain, USA, as examples. Photo by the author.
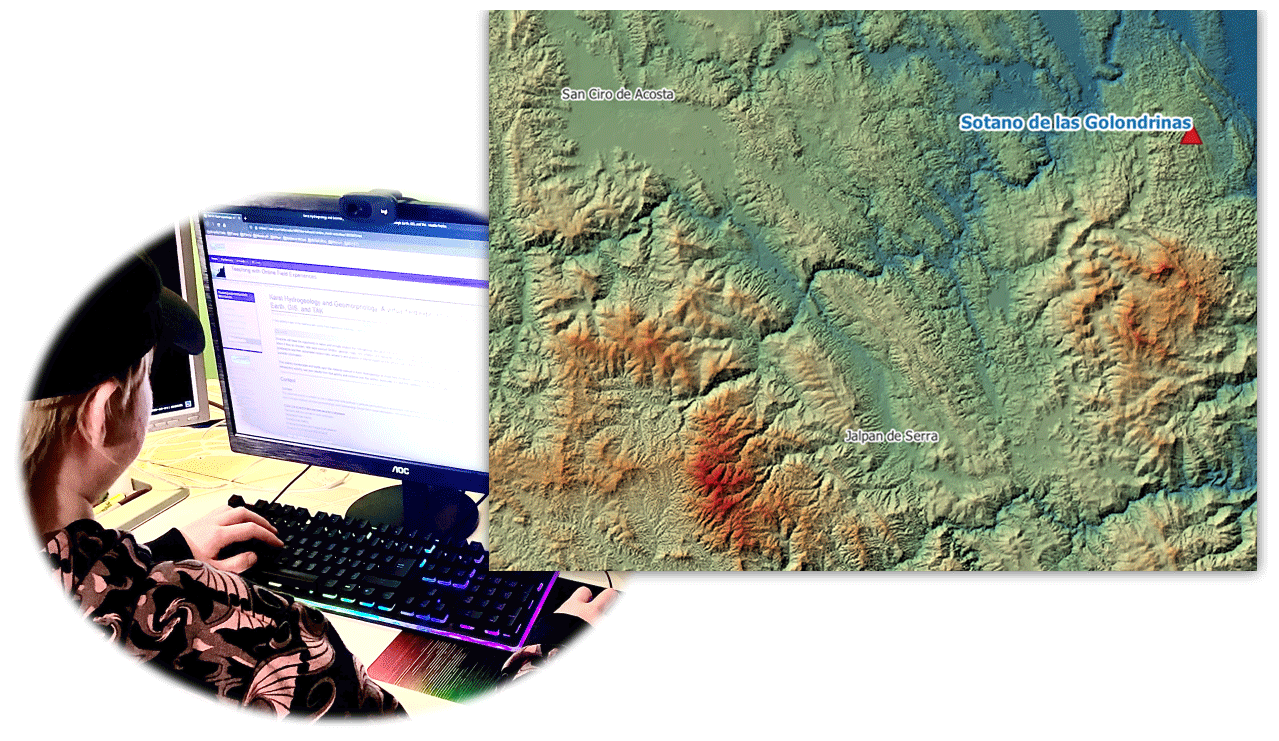
Figure 3Reprojected, hillshaded, and a colored-by-elevation digital elevation model of the Sótano de las Golondrinas area, Mexico, in QGIS. Photo by the author.
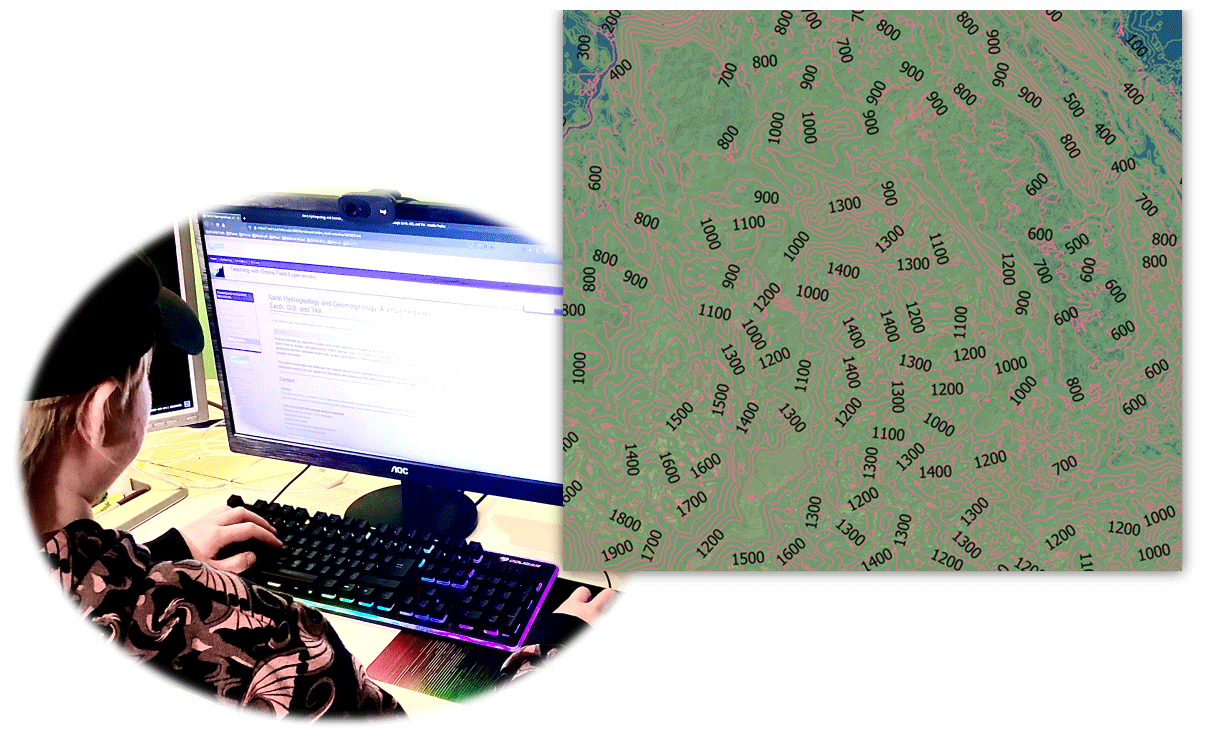
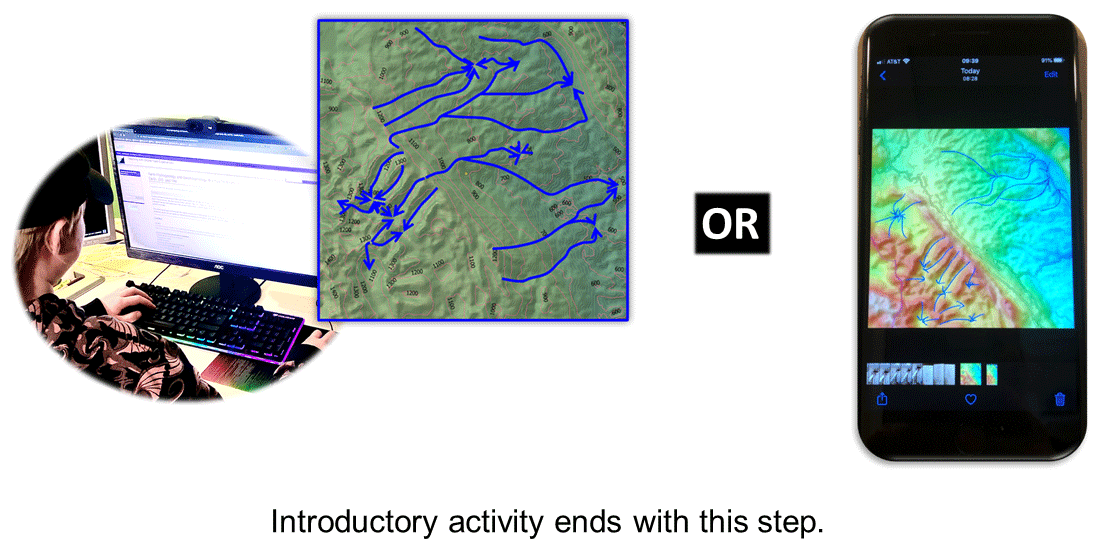
Figure 5Manually drawn water flow paths created in © Google Slides (left) and an iPhone photo markup (right). Photo by the author.
2.4 Assessment
Questions for students are provided in the student handout (Appendix A). These are to guide students' thinking as they work through the activity. They can then use their responses to the questions as they prepare their presentations and write their final reports.
After completing the exercise as individuals or in small groups, students share their findings with the whole class. This can happen virtually or in person as circumstances dictate. Each presentation can happen as a slideshow or as a video made by the student(s) or in any other format that works for the instructor(s) and student(s).
Each student also writes a formally structured report (including a title, author's name, date, abstract, introduction, methods, results, discussion, and conclusion). Within the report, or as a separate document, they should reflect on their experience with this activity and assess their level of understanding before and after the activity of (a) © Google Earth, (b) GIS, (c) UTM CRS, (d) topographic map interpretation, and (e) karst hydrogeology. A rubric to guide the grading of these materials is provided with the activity on the SERC repository (https://d32ogoqmya1dw8.cloudfront.net/files/teachearth/activities/grading_rubric_karst_intro_activity.docx; last access: 13 June 2021).
2.5 Recommendation to instructors
It is possible that students may be unfamiliar with using a GIS before attempting to work through this activity. In the event that there is difficulty with following the directions in the student handout, there is also a photographic walk-through provided for instructors (https://d32ogoqmya1dw8.cloudfront.net/files/NAGTWorkshops/online_field/activities/intro_karst_hydrogeology_teaching_notes.docx; last access: 13 June 2021). This document should be useful if learners or instructors have difficulty with GIS. The example in the walk-through uses the karst landscape provided for the Central Kentucky Karst, USA. If students are struggling to understand and complete the activity, working with the example from Kentucky may make it easier to provide them with more structured guidance.
There may be other students who need additional challenge. These learners can be prompted to access the advanced module (described below) to continue with a more involved analysis of their karst landscape.
While completing “Karst hydrogeology: a virtual field experience using © Google Earth, GIS, and TAK” (https://serc.carleton.edu/NAGTWorkshops/online_field/activities/237267.html; last access: 13 June 2021), students have the opportunity to select and virtually explore the hydrogeology and geomorphology of a karst landscape using © Google Earth, lidar-data-sourced DEM(s), geologic maps, GIS software, and topographic analysis software packages such that they gain an understanding of karst landscapes and their associated hazards, can access and analyze internet-sourced remote sensing data, design a field strategy, and employ verbal and written communication of scientific information. This activity incorporates and builds upon the material covered in “Karst hydrogeology: a virtual field introduction using © Google Earth and GIS”. This advanced activity, like the companion introductory activity, is suitable for use in upper-level undergraduate or graduate geomorphology or groundwater hydrogeology courses or as part of a capstone activity for graduating seniors. The main concepts explored are karst geomorphology, karst hydrogeology, © Google Earth image interpretation, GIS landscape analysis, hypothesis development, and field strategy planning.
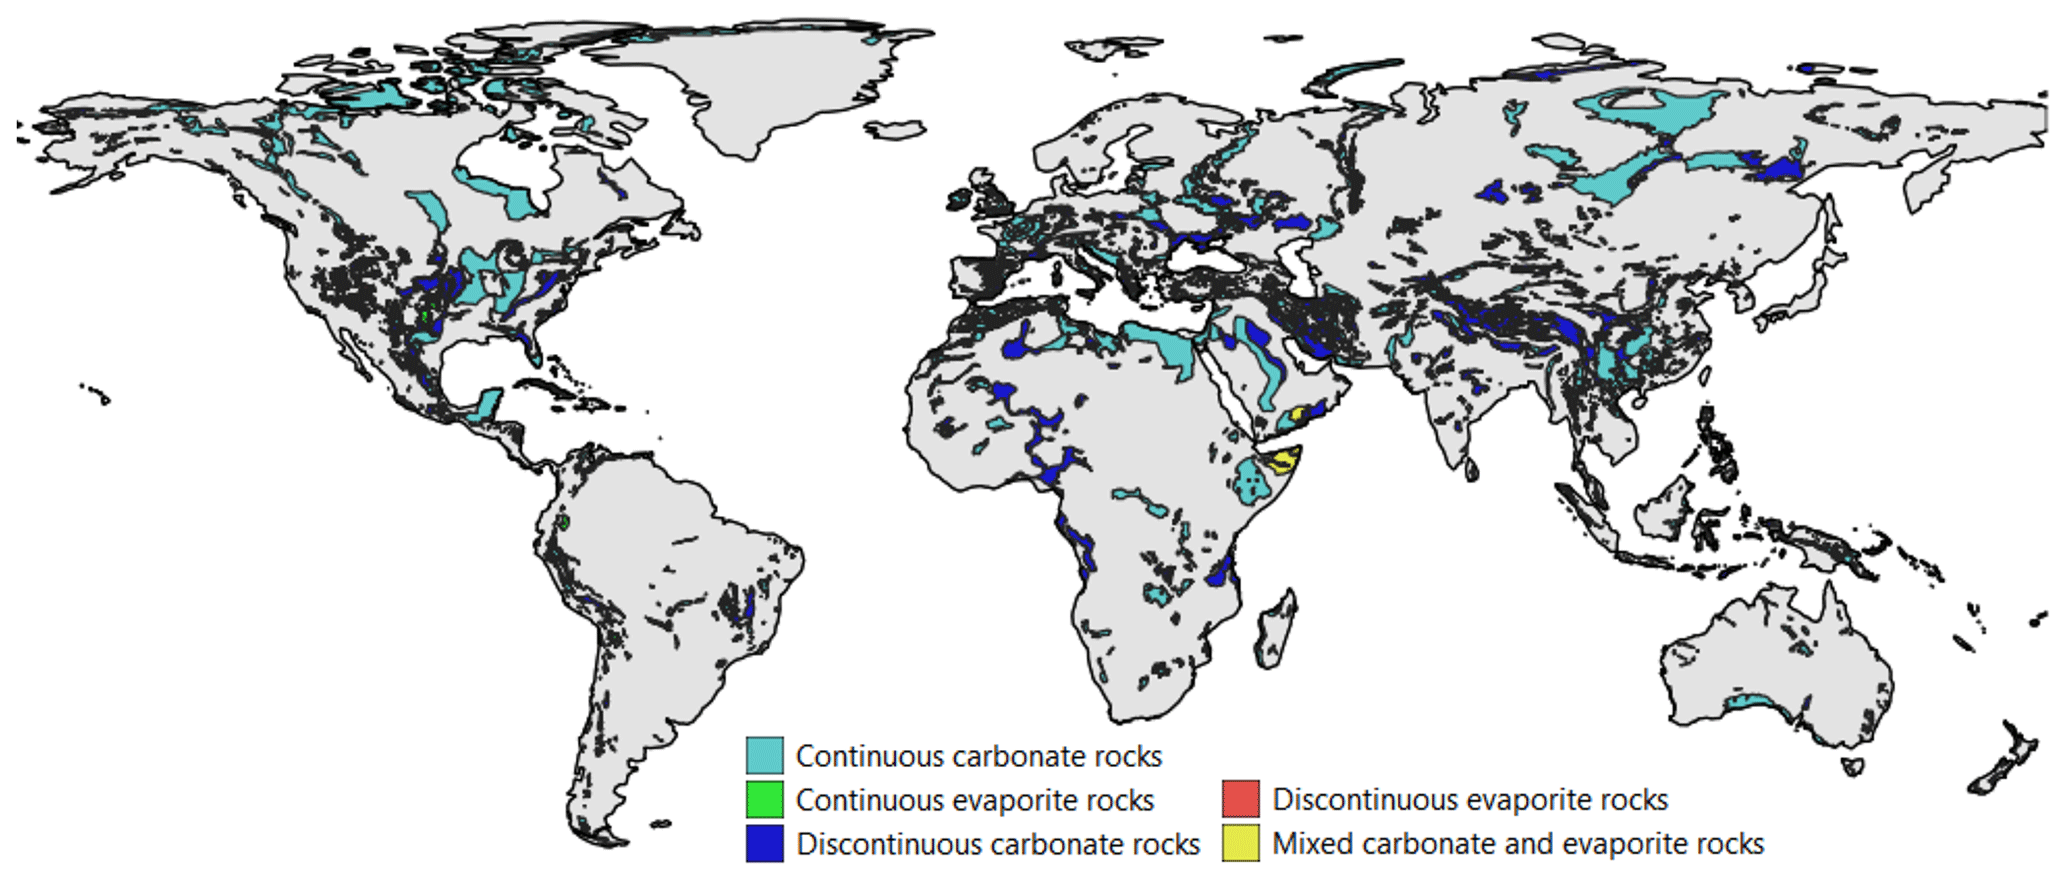
Figure 6World Karst Aquifer Map. Cartography by the author in QGIS; data from Goldscheider, 2021.
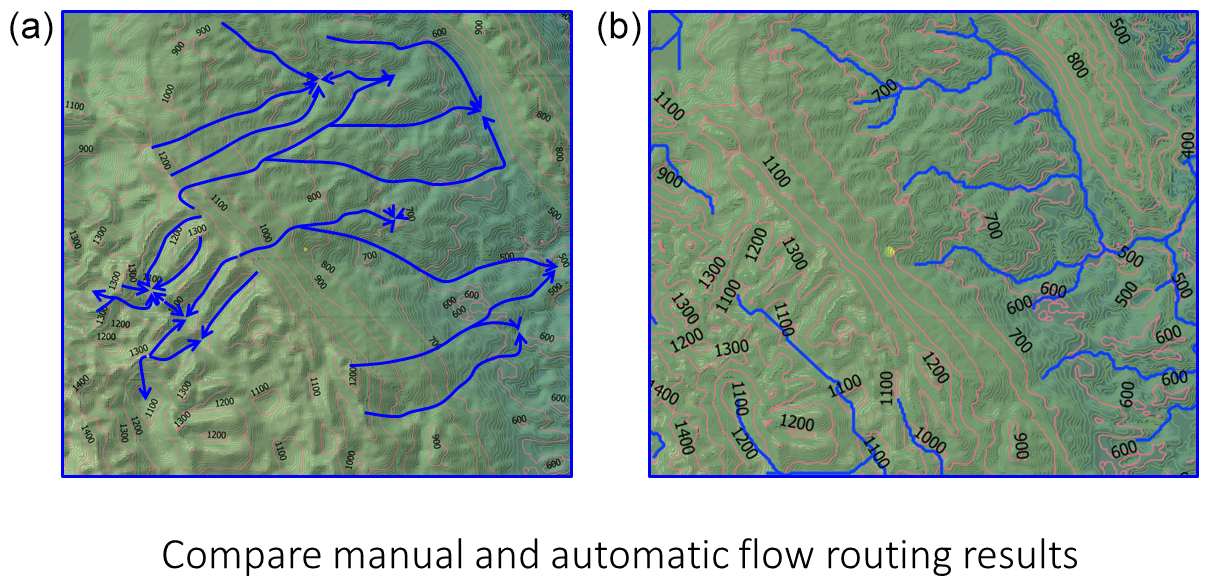
Figure 7Manually drawn water flow routing (a) and automated flow routing (b) performed in TAK.
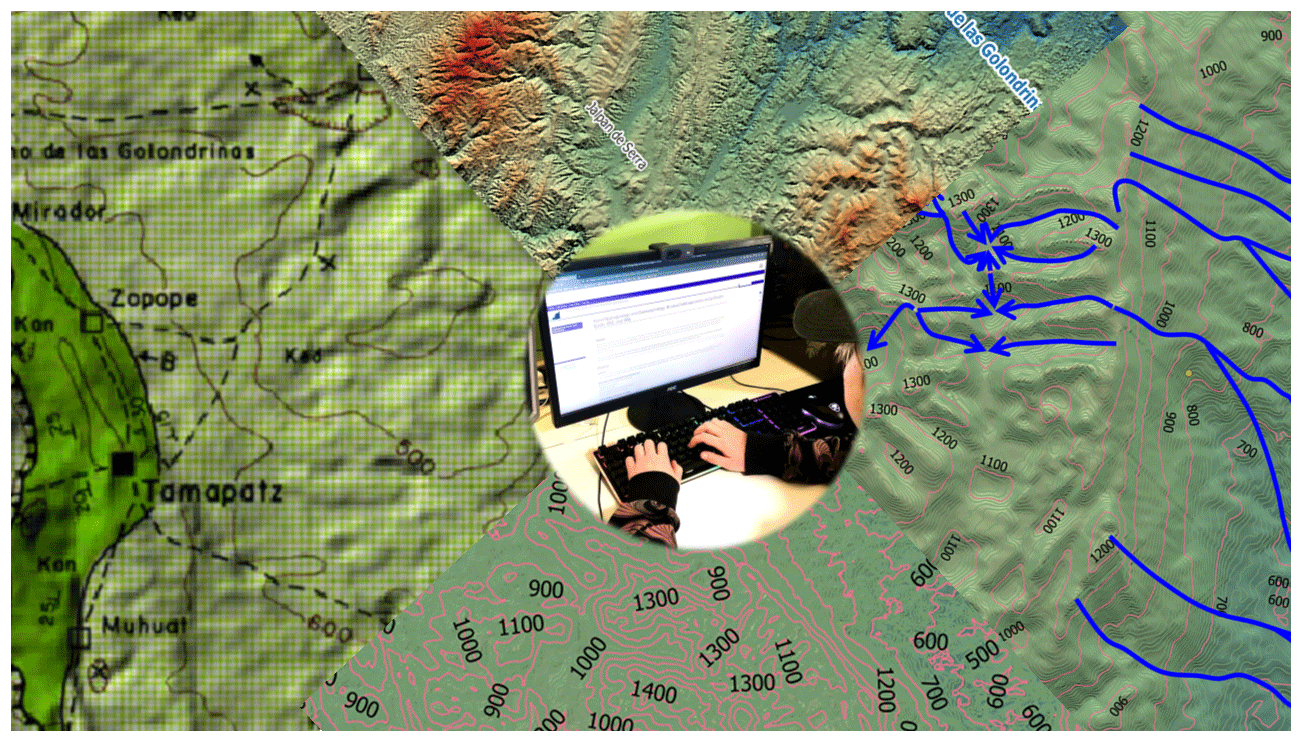
Figure 8Advanced activity synthesis, clockwise from left, showing an analog geological map draped over topography using QGIS, DEM with Hillshade in QGIS, a manually drawn flow routing, and the elevation contour layers in QGIS. Photo by the author.
3.1 Expectations
This advanced module assumes that students have prior experience with the use of © Google Earth and other geographic information systems, as well as familiarity with the concepts of karst landscapes, topographic map reading, and geologic map reading. This can be taught as a stand-alone exercise or in conjunction with other modules to build a capstone field experience and is expected to take 8 to 16 h to complete.
3.2 Learning goals
The learning goals for the advanced virtual karst activity are also consistent with the NAGT virtual field learning objectives presented above (Table 1).
-
Content and/or conceptual goals for this activity are as follows:
-
visual identification of karst landscapes (particularly in contrast to fluvial landscapes) from aerial imagery
-
analog vs. digital topographic map interpretation to determine drainage patterns
-
effective field strategy planning to address an original hypothesis.
-
-
Higher-order thinking goals for this activity are as follows:
-
compare and contrast the ways karst drainage basins behave differently to purely surface stream or porous-media groundwater
-
analyze digital and analog data to draw conclusions about landscape-associated hazards
-
compare and contrast analog with digitally automated analyses
-
formulate hypotheses using analog and digital data
-
develop an experimental strategy to test these hypotheses.
-
-
Other skills goals for this activity are as follows:
-
georeferencing analog data to a GIS
-
constructing a geologic history
-
navigating © Google Earth
-
searching the internet and/or USGS's EarthExplorer website
-
manipulating data in a GIS for analysis and presentation
-
creating an oral or video presentation
-
promoting teamwork both synchronously and asynchronously
-
developing technical writing skills
-
reflecting on work done
-
performing a self-assessment
-
managing data
-
gaining independence
-
learning personal management
-
learning about time management
-
developing leadership skills.
-
3.3 Activity description and teaching materials
This advanced activity is similar to the introductory activity in that students select and virtually explore a karst landscape. Materials available on the SERC repository include a student handout, teaching notes, a grading rubric, and several internet links for background and supplemental information. The teaching notes include a step-by-step walk-through of the activity procedure, including screenshots of the anticipated outcomes. In this way, the modules can be available to a wide range of teachers and learners.
For this activity, students need access to an internet-enabled personal computer. Prior to the activity, they will need to download and install the following software packages: © Google Earth for use on the web or on desktop, a GIS (QGIS is a free and open-source option), and Topographic Analysis Kit (TAK; free, open-source software package available at GitHub; https://github.com/amforte/Topographic-Analysis-Kit; last access: 13 June 2021). Students may work in groups or independently to complete the activity and presentation. Final reports should be written and submitted independently.
This activity begins with students exploring the World Karst Aquifer Map (Goldscheider, 2021; Fig. 6) and its associated article by Goldscheider et al. (2020). Instead of being provided with seven choices as in the introductory activity, they are presented with the opportunity to use these resources along with © Google Earth to select any karst area to study. Instructors may want to place a time limit on this first portion of the activity.
-
Once students have selected their karst landscape, they need to acquire topographic and geologic map information. For locations in the United States, EarthExplorer is a good source for DEM files. Students who choose sites outside of the United States can still find their DEM data but may need to do some internet searching to obtain them. They will then follow the instructions for the introductory activity described above, following steps 2 through 5.
-
To determine flow paths more objectively, students use TAK. This software uses a set of MATLAB functions, written by Adam Forte (2020), which build upon the functionality of TopoToolbox by Wolfgang Schwanghart and Dirk Scherler. Students then load the reprojected DEM into TAK and run MakeStreams to perform automated flow routing. This is the only function used in the activity, but it is hoped that some students' interest will be piqued, leading them to explore further landscape analysis.
-
Students then add the streams vector layer generated by TAK to their GIS project.
-
The final piece of data that students add to their GIS is regional geology. The student handout provides an instruction for importing a shapefile or for manually georeferencing an analog geologic map.
-
They are then ready to begin the analysis portion of the activity. This analysis will be presented to the class if they are working in a cohort, and the responses to the following steps will be written into their final report.
-
There will be differences between the manual flow routing drawn by students and the flow paths modeled by the routing algorithms in TAK (Fig. 7). They are called upon to speculate about the source of those differences and then to consider the strengths and weaknesses of each approach. They then decide which method they think provides better results. This conclusion may vary based upon the student or the selection of field study location. When assessing student performance in this step, it is more important that the student has constructed a reasonable argument based upon the evidence than that they have chosen the flow routing method that the instructor thinks is right.
-
Using observations of the geology, the topography, and the hydrogeology, students construct a geologic and/or geomorphic history of their study area (Fig. 8). They are asked to determine the sequence of events at this site and to consider, in particular, depositional, tectonic, and erosional events. They are also asked how any stream network (or lack thereof) evolved.
-
Now that they have constructed a story, they are reminded that they have done this with limited evidence. They are asked to think about their level of confidence for each event and state which events they think may need more support. They build those into hypotheses.
-
Additional hypotheses may be developed concerning environmental or natural hazards they think might be issues with this landscape.
-
The final step is to describe a potential experiment that would test one or more of the hypotheses proposed in steps 8 and 9. The students first state what data they would need to collect to support or refute their hypotheses and speculate as to the kinds of results that may be obtained for different types of data, as well as what implications these results might have for each hypothesis. Finally, they are asked what field, laboratory, or numerical techniques would be required to obtain these data and to be as specific as if they were planning for fieldwork, lab work, or numerical modeling.
Table 2Modules for planetary geology virtual capstone pathway.
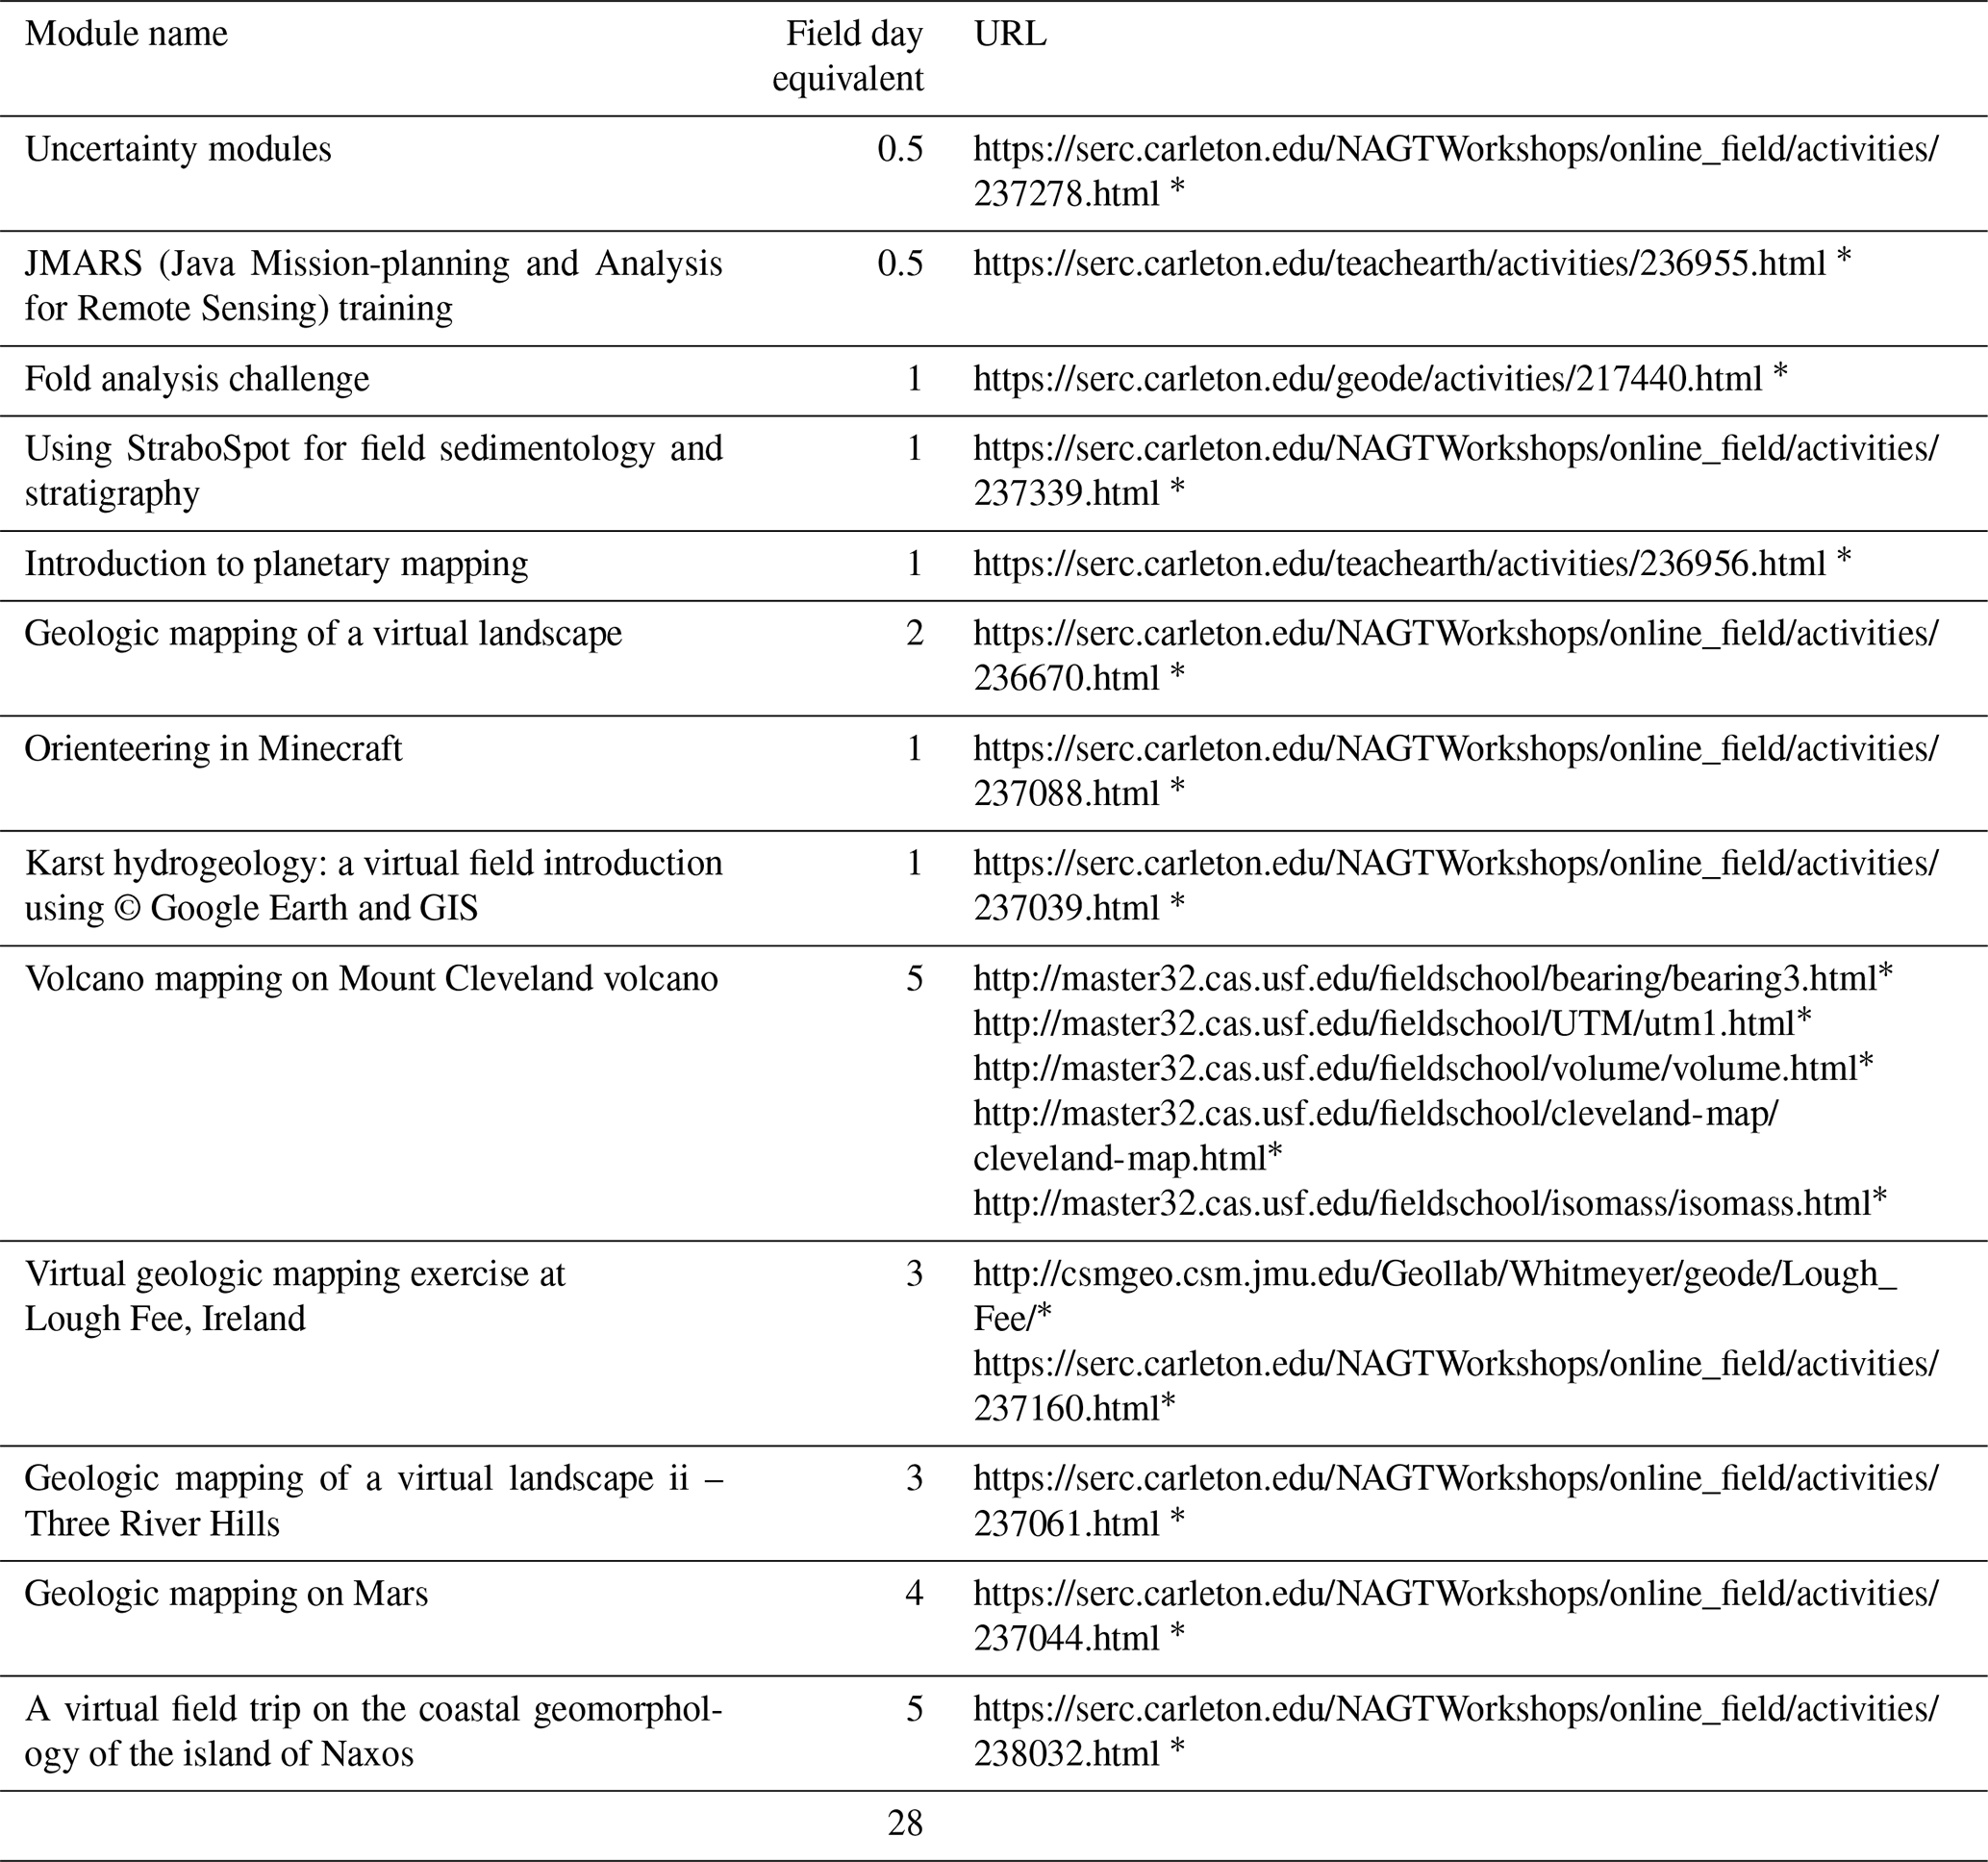
* last access: 18 September 2020
Table 3Modules for traditional geology virtual capstone pathway.
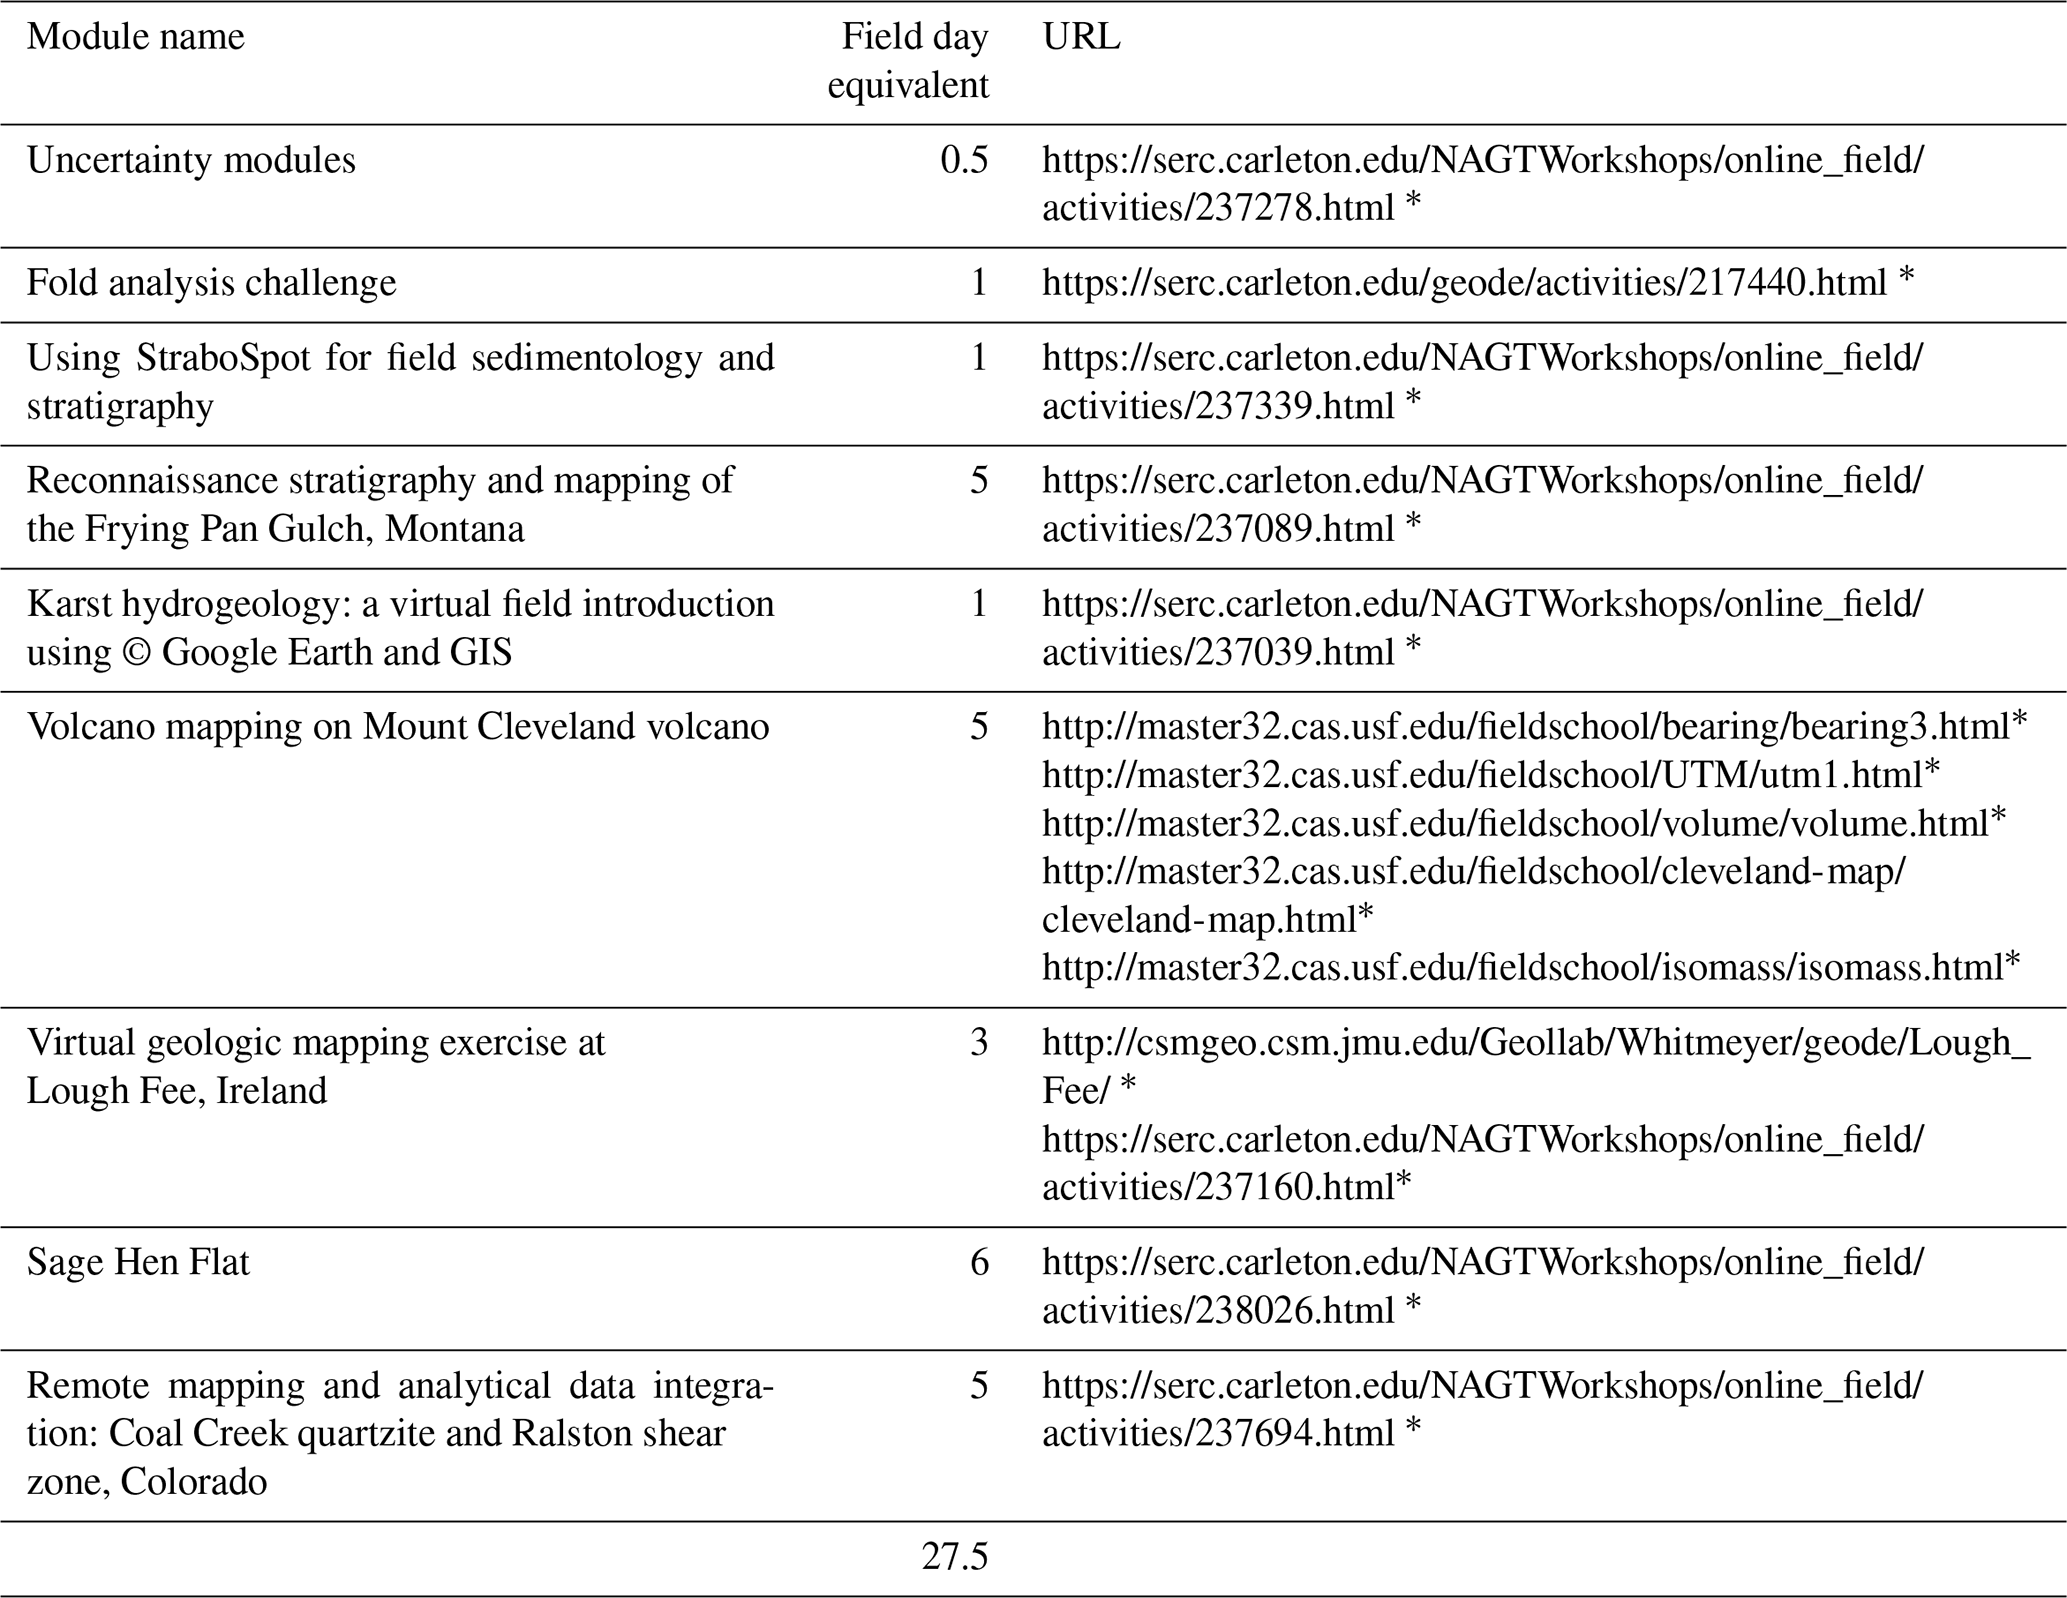
* last access: 18 September 2020
Table 4Modules for environmental geology virtual capstone pathway.
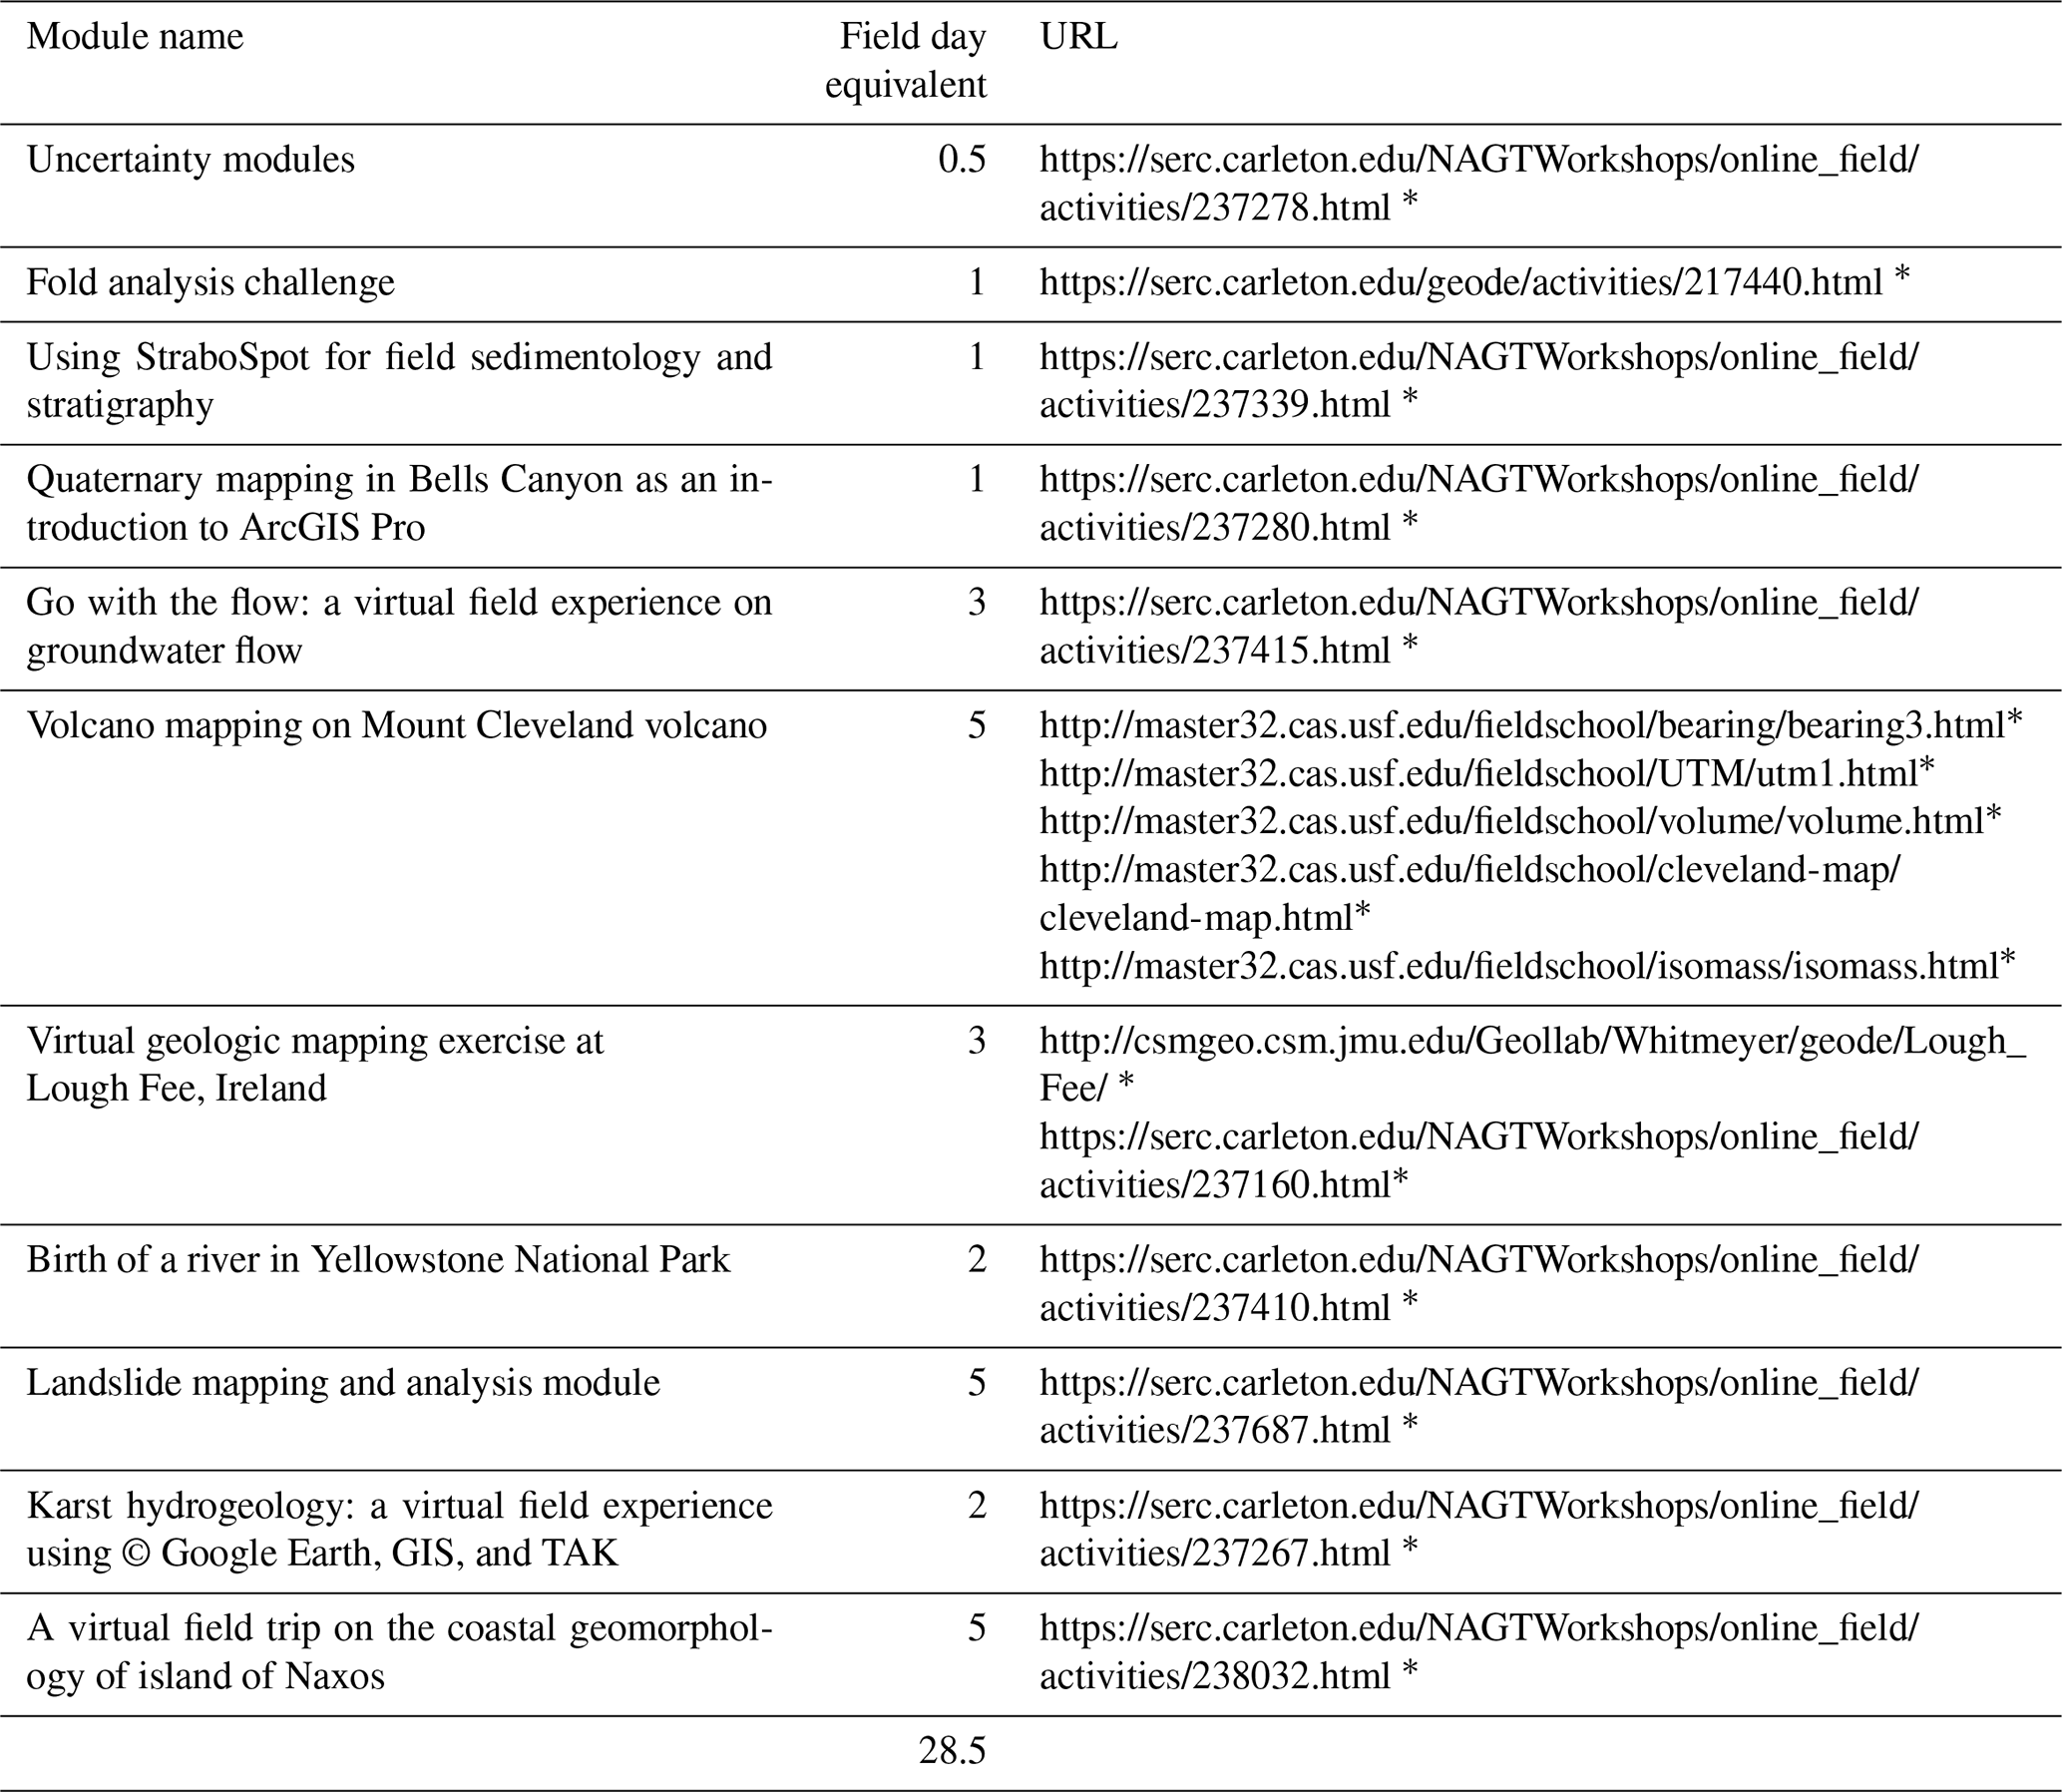
* last access: 18 September 2020
3.4 Assessment
Questions for students are provided in the student handout (Appendix B). These are to guide students' thinking as they work through the activity. They can then use their responses to the questions as they prepare their presentations and write their final reports.
After completing the exercise as individuals or in small groups, students share their findings with the whole class. This can happen virtually or in person as circumstances dictate. Each presentation can happen as a slideshow or as a video made by the student(s) or in any format that works for both instructor(s) and student(s).
Each student writes a formally structured report (including the title, author's name, date, abstract, introduction, methods, results, discussion, and conclusion). Within the report, or as a separate document, they should reflect on their experience with this activity and assess their level of understanding before and after the activity of (a) © Google Earth, (b) GIS, (c) UTM CRS, (d) topographic map interpretation, (e) TAK, (e) karst hydrogeology, (f) geologic history construction, (g) hypothesis formulation, and (h) scientific experiment design.
A rubric to guide the grading of these materials is provided with the activity on SERC (https://d32ogoqmya1dw8.cloudfront.net/files/NAGTWorkshops/online_field/activities/grading_rubric_karst_hydrogeology_geomorphology_virtual_field_experience_us.docx; last access: 13 June 2021).
3.5 Recommendation to instructors
Some students may need more supervision and guidance when selecting a karst area to focus on. It is suggested that these students choose a study area that is in their home country. This may make it easier for them to locate the DEM files and manipulate the data to complete the activity. If students need additional direction, they may refer to the introductory activity to use one of the karst landscapes suggested there.
There may be other students who want to extend their learning. There are a few ways people can find additional challenges within the scope of this activity. One way to do this is to explore some of the other landscape analysis options available in QGIS or TAK and then integrate those results into the proposed chronology for the area. Another option would be to choose a second karst landscape or a non-karst landscape, complete the same steps as with the first landscape, and compare the results from those two exercises. A third possible extension would be to explore other flow routing algorithms. A few different flow routers can be found in the toolbox under the processing menu in QGIS. For students familiar with Linux and who want to try another open-source topographic analysis software, they can install LSDTopoTools (https://lsdtopotools.github.io/LSDTT_documentation/index.html; last access: 13 June 2021) and then compare flow routing results from that tool with those obtained manually and with TAK. Another possible exercise for students who need an additional challenge is that they may try to find a karst landscape using © Google Earth to search the surface of Mars or the Moon and compare that with the karst landscape they have investigated on the Earth's surface.
Existing modules, including the aforementioned karst activities, developed in the early months of the COVID-19 pandemic, from the SERC Teaching with Online Experiences page, were sorted into three interest-based tracks, namely planetary geology, traditional geology, and environmental geology (Tables 2, 3, and 4, respectively). Since these activities include information on SERC about how long they should take to complete, each path was able to be tailored such that they have an estimated instructional equivalent to 28 d in the field – approximating a 4–6-week field camp – and they would, thus, each be suitable for a senior capstone experience. In addition to providing a safer route for students to meet their graduation criteria during a pandemic, these virtual capstone pathways are a robust and rigorous alternative for students who are not able to attend a traditional field camp.
The Department of Geology at the University of Cincinnati first offered the virtual capstone pathways during the spring 2021 semester with instructor Dan Sturmer. A total of two students enrolled under the course catalog listing of “Geology Capstone, 100 % Online”. As only two students have attempted this course so far, we do not yet have enough data for a rigorous review of the success of this program. Here are comments from Dan Sturmer (personal communication, 2021) on the implementation of these virtual capstone pathways.
For … the course, we have been following the general [traditional geology] track. We had plans to run concurrent tracks this summer, but I am not sure that we will have enough students to do that. Overall, I think both students have really enjoyed the program. We meet via Zoom once a week to go over that week's assignment, and we sometimes meet additional times during the week. I have mostly broken down the assignments so that 2 days of work is completed in a week (for example, they are doing the 6-day Sage Hen Flat assignment over 3 weeks). It has been a little challenging to do this over a semester instead of over a concentrated time because the students have other classes and obligations, so the experience is different. I think they have learned a lot of valuable skills, and one of the benefits is they get to work on projects all over the world and from a wider variety of branches of the geosciences than they would in person.
Dan Sturmer also reported that the students “said they really liked the order of the assignments because they were able to build upon skills that they learned in previous assignments.” His feedback on the karst activities was that “For the karst assignment, the students generally didn't have too much trouble with it. They were mostly not familiar with QGIS (which I found surprising!) but they were able to complete the assignment with guided instruction.” Furthermore, Dan Sturmer stated that these virtual capstone pathways are an “important option to have”, and that the department will be keeping this as a capstone opportunity to provide to students in the future, alongside the options of attending an in-person field camp or completing an original research project. Benefits he cited to this choice of capstone are that it costs the students less, it can be managed to accommodate students' time constraints, and it provides an accessible option for students who are unable to attend a field camp for reasons other than limited time or financial resources.
Embedded within the challenges presented by the COVID-19 pandemic were opportunities. Our communities have grown stronger and developed new strategies because we were forced to think, learn, and work in new ways during 2020. These two karst activities, “Karst hydrogeology: a virtual field introduction using © Google Earth and GIS”, and “Karst hydrogeology: a virtual field experience using © Google Earth, GIS, and TAK”, are just two of the products that emerged out of necessity when we were finding new ways to teach the field because we could not take groups of people to the field. These products were well received, but they were not the only exemplary modules to emerge from the pandemic in 2020; there are 73 teaching activities listed in the SERC Online Field Experiences repository. Aligning this great supply of quality teaching activities with a demand for online capstone learning opportunities produced the virtual capstone pathways of planetary geology, traditional geology, and environmental geology. These have been successful so far at the University of Cincinnati and provide a good option so that all students can have learning opportunities that fit with their needs.
Recently, remote learning and online conferences have provided a chance to develop new tools that will make for more equitable academic experiences in the years ahead. In addition to keeping everyone safe during the pandemic, the geoscience community used this time to perform some large-scale, collective introspection. New tools and ways of working, including the virtual field experiences and virtual capstone pathways described in this paper, are an instrumental part of our community working to become more welcoming, accessible, and inclusive.
Karst hydrogeology: a virtual field experience using © Google Earth, GIS, and TAK (by Rachel Bosch, University of Cincinnati; rachelfbosch@gmail.com)
A1 Summary
Students will have the opportunity to select and virtually explore the hydrogeology and geomorphology of a karst landscape using © Google Earth, lidar-data-sourced DEM(s), and GIS software (QGIS) such that they gain an understanding of karst landscapes and their associated hazards, can access and analyze internet-based remote sensing data, and employ verbal and written communication of scientific information.
A2 Activity description
About 16.5 % of the world’s population lives on karst (Goldscheider et al., 2020). It is therefore important that we understand the drainage patterns, potential hazards to humans, and potential threats to water quality that are unique to karst.
Prior to beginning this activity, download and install the following software packages: © Google Earth on web or desktop (https://www.google.com/earth/versions/; last access: 13 June 2021) and a GIS (QGIS is a free and open-source option; https://www.qgis.org/en/site/; last access: 13 June 2021).
-
Background – review background information on karst and on the source of the digital elevation model (DEM) data used in this activity.
Background information on karst is available from https://link.springer.com/article/10.1007/s10040-016-1519-3 (last access: 13 June 2021), https://kgs.uky.edu/kgsweb/olops/pub/kgs/ic04_12.pdf (last access: 13 June 2021), https://en.wikipedia.org/wiki/Karst (last access: 13 June 2021), and http://www.igme.es/boletin/2016/127_1/BG_127-1_Art-9.pdf (last access: 13 June 2021).
Background on specific karst areas you can explore during this activity can be found at the following URLs:
-
Central Kentucky Karst, USA, at https://www.usgs.gov/science-support/osqi/yes/national-parks/mammoth-cave-national-park (last access: 13 June 2021), http://www.igme.es/boletin/2016/127_1/BG_127-1_Art-9.pdf (last access: 13 June 2021)
-
El Sótano de las Golondrinas, Mexico, at http://www.mexicancaves.org/bul/bul2.pdf (last access: 13 June 2021)
-
Caverna de Santana, Brazil, at https://en.wikipedia.org/wiki/Caverna_Santana (last access: 13 June 2021)
-
Sof Omar Cave, Ethiopia, at https://en.wikipedia.org/wiki/Sof_Omar_Caves (last access: 13 June 2021)
-
Postojna Cave, Slovenia, at https://www.postojnska-jama.eu/en/ (last access: 13 June 2021), https://www.slovenia.info/en/stories/karst (last access: 13 June 2021), https://izrk.zrc-sazu.si/en/predstavitev{#}v (last access: 13 June 2021)
-
Tenglong Cave, China, at https://en.wikipedia.org/wiki/Tenglong_Cave (last access: 13 June 2021)
-
Waitomo Cave, New Zealand, at https://www.newzealand.com/us/waitomo-caves/ (last access: 13 June 2021), https://en.wikipedia.org/wiki/Waitomo_Glowworm_Caves (last access: 13 June 2021).
Background on the Shuttle Radar Topography Mission (SRTM) to acquire the data used in the DEMs recommended in this activity can be found at https://www2.jpl.nasa.gov/srtm/ (last access: 13 June 2021)
For an overview of karst aquifers on Earth, refer to the World Karst Aquifer Map (WOKAM), available at https://www.whymap.org/whymap/EN/Maps_Data/Wokam/wokam_node_en.html (last access: 13 June 2021). Use the WOKAM to select an area of interest, browse © Google Earth to search for karst landforms, or use one of the following links to go directly to a karst area:
-
Google Earth – Caverna de Santana, Brazil, available at https://earth.google.com/web/search/Caverna+de+Santana (last access: 13 June 2021).
-
Google Earth – Central Kentucky Karst, USA, available at https://earth.google.com/web/search/Smiths+Grove (last access: 13 June 2021).
-
Google Earth – El Sótano de las Golondrinas, Mexico, available at https://earth.google.com/web/search/Sotano+Golondrinas (last access: 13 June 2021).
-
Google Earth – Postojna Cave, Slovenia, available at https://earth.google.com/web/search/Postojna+Cave (last access: 13 June 2021).
-
Google Earth – Sof Omar Cave, Ethiopia, available at https://earth.google.com/web/search/Holqa (last access: 13 June 2021).
-
Google Earth – Tenglong Cave, China, available at https://earth.google.com/web/search/Tenglong+Cave (last access: 13 June 2021).
-
Google Earth – Waitomo Cave, New Zealand, available at https://earth.google.com/web/search/Waitomo+Cave (last access: 13 June 2021).
- 2.
Data acquisition – acquire topographic information for your chosen karst landscape. For locations in the United States, EarthExplorer is a good source for SRTM DEM files (https://earthexplorer.usgs.gov/, last access: 13 June 2021). For sites outside of the USA, you can still find DEM data but may need to do additional internet searching to obtain it.
- 3.
Data processing
- a.
The DEM file then needs to be uploaded to a GIS. Check the properties of your DEM raster layer to see what CRS it is loaded in. For many DEMs, you will need to find the appropriate CRS and reproject the raster. For a review of the Universal Transverse Mercator (UTM) system, consult the USGS fact sheet (https://pubs.usgs.gov/fs/2001/0077/report.pdf; last access: 13 June 2021) and a world map of UTM zones (https://maptools.com/tutorials/grid_zone_details; last access: 13 June 2021). Another option is to use an interactive online map (https://mangomap.com/robertyoung/maps/69585/what-utm-zone-am-i-in-; last access: 13 June 2021) to help determine the coordinate system for your location. The reproject task is performed by selecting the layer for the DEM raster data. Then click on the “raster” dropdown menu. Go to “Projections”, and select “Warp (reproject)… ” Select a complete path for the output, and give a name to the output file for the reprojected map data.
- b.
After the project is in the correct CRS, you can then choose a color scheme (right-click on the layer > “properties” > “style” > “render type” > “singleband pseudocolor” > “generate a new color map” > select the desired color band > “classify”) and make a Hillshade layer to better visualize the topography. To generate a Hillshade layer, use the “raster” menu again. Go to “Terrain analysis” > “Hillshade… ”.
- i.
Questions: what karst aquifer region did you select? What UTM zone is this field site in? What color band worked best for your visualization of the topography? What does the Hillshade function do? How is it helpful?
- i.
- c.
To better understand the drainage patterns of this landscape, extract a set of topographic contour lines. Open the “raster” menu. Go to “Extraction” > “Contour… ” A good interval to start with is 20. If the contour lines end up looking too crowded or too spread out, you can make new contour layers with different intervals.
- d.
Now that you have detailed topographic maps with contour intervals, you may want to revisit the rule of V's for determining flow paths over land surfaces (https://d32ogoqmya1dw8.cloudfront.net/files/teachearth/activities/watercourses_ridges_topographic_maps_why_vs.pdf; last access: 13 June 2021). If you have access to a printer, you can print out a paper copy of the map you built and draw the drainage patterns in with a pencil. There are two digital options for drawing in the water flow paths. For the first, you can export the image of their map in QGIS in a .png format. To do this, go to the “Project” menu and select “Save as Image…”, and then use a photo editor to draw flow paths on the map. If you have more GIS experience, you may want to work directly in the GIS and make new vector layers to create surface flow paths.
- i.
Questions: describe the flow paths you drew on your map. What challenges or obstacles did you encounter while determining the routes water would take?
- i.
- a.
Sharing science
-
After completing the exercise, as an individual or as part of a small group, present your findings to the whole class.
-
Write a formally structured report (including the title, author's name, date, abstract, introduction, methods, results, discussion, and conclusion). Within the report, or as a separate document, reflect on your experience with this activity and assess your level of understanding before and after the activity of (a) © Google Earth, (b) GIS, (c) UTM CRS, (d) topographic map interpretation, and (e) karst hydrogeology.
Karst hydrogeology and geomorphology: a virtual field experience using © Google Earth, GIS, and TAK (by Rachel Bosch, University of Cincinnati; rachelfbosch@gmail.com)
B1 Summary
Students will have the opportunity to select and virtually explore the hydrogeology and geomorphology of a karst landscape using © Google Earth (or perhaps © Google Mars or © Google Moon, if they so choose), lidar-data-sourced DEM(s), geologic maps, GIS software, and topographic analysis software packages such that they gain an understanding of karst landscapes and their associated hazards, can access and analyze internet-sourced remote sensing data, design a field strategy, and employ verbal and written communication of scientific information.
This activity incorporates and builds upon Karst hydrogeology: a virtual field introduction using © Google Earth and GIS. If you have already completed the introductory activity, use your results from that activity and continue this activity from step 3f.
B2 Activity description
About 16.5 % of the world’s population lives on karst (Goldscheider et al., 2020). It is therefore important that we understand the drainage patterns, potential hazards to humans, and potential threats to water quality that are unique to karst.
Prior to beginning this activity, download and install the following software packages: © Google Earth on web or desktop (https://www.google.com/earth/versions/; last access: 13 June 2021), a GIS (QGIS is a free and open-source option; https://www.qgis.org/en/site/; last access: 13 June 2021), and Topographic Analysis Kit (free, open-source software package available from GitHub at https://github.com/amforte/Topographic-Analysis-Kit; last access: 13 June 2021)
- 1.
Background – review background information on karst and on the source of the digital elevation model (DEM) data used in this activity. Background information on karst is available at https://link.springer.com/article/10.1007/s10040-016-1519-3 (last access: 13 June 2021), https://kgs.uky.edu/kgsweb/olops/pub/kgs/ic04_12.pdf (last access: 13 June 2021), https://en.wikipedia.org/wiki/Karst (last access: 13 June 2021), and http://www.igme.es/boletin/2016/127_1/BG_127-1_Art-9.pdf (last access: 13 June 2021).
Background on the Shuttle Radar Topography Mission (SRTM) to acquire the data used in the DEMs recommended in this activity is available at https://www2.jpl.nasa.gov/srtm/ (last access: 13 June 2021).
- 2.
Data acquisition
- a.
For an overview of karst aquifers on Earth, refer to the World Karst Aquifer Map (WOKAM), available at https://www.whymap.org/whymap/EN/Maps_Data/Wokam/wokam_node_en.html (last access: 13 June 2021). Use the WOKAM to select an area of interest or browse © Google Earth to search for karst landforms.
- b.
As a base layer for GIS mapping of your karst area, load the WOKAM shapefiles to view the chosen area in the context of its broader karst region. WOKAM shapefiles can be found at https://produktcenter.bgr.de/terraCatalog/OpenSearch.do?search=473d851c-4694-4050-a37f-ee421170eca8&type=/Query/OpenSearch.do (last access: 13 June 2021) or in the attached zipped folder.
- c.
Acquire topographic and geologic map information for your chosen karst landscape. For topography in the United States, EarthExplorer is a good source for SRTM DEM files (https://earthexplorer.usgs.gov/; last access: 13 June 2021). For sites outside of the USA, you can still find DEM data but may need to do additional internet searching to obtain it.
- d.
Acquire geologic map data. Inside the USA, the National Geologic Map Database project should have what you need (https://ngmdb.usgs.gov/ngmdb/ngmdb_home.html; last access: 13 June 2021). Outside of the USA, it will vary by country, and more internet searching will be needed. Geologic information may be in a file format ready for import to a GIS or as a scanned image or .pdf file.
- a.
- 3.
Data processing
- a.
The DEM file then needs to be uploaded to a GIS. Check the properties of your DEM raster layer to see what coordinate reference system (CRS) it is loaded in. For many DEMs, you will need to find the appropriate CRS and reproject the raster. For a review of the Universal Transverse Mercator (UTM) system, consult the USGS fact sheet (https://pubs.usgs.gov/fs/2001/0077/report.pdf; last access: 13 June 2021) and a world map of UTM zones (https://maptools.com/tutorials/grid_zone_details; last access: 13 June 2021). Another option is to use an interactive online map (https://mangomap.com/robertyoung/maps/69585/what-utm-zone-am-i-in-; last access: 13 June 2021) to help determine the coordinate system for your location. The reprojection task is performed by selecting the layer for the DEM raster data. Then click on the “raster” dropdown menu. Go to “Projections”, and select “Warp (reproject)… ” Then select a complete path for output and give a name to the output file for the reprojected map data.
- b.
After the project is in the correct CRS, you can then choose a color scheme (right-click on the layer > “properties” > “style” > “render type” > “singleband pseudocolor” > “generate a new color map” > select the desired color band > “classify”) and make a Hillshade layer to better visualize the topography. To generate a Hillshade layer, use the “raster” menu again. Go to “Terrain analysis” > “Hillshade…”.
- i.
Questions: what karst aquifer region did you select? What UTM zone is this field site in? What color band worked best for your visualization of the topography? What does the Hillshade function do? How is it helpful?
- i.
- c.
The next layer to upload to GIS is geologic map information.
- i.
If the geologic map data are in a proper file format for GIS, they will most likely need to be reprojected to the same CRS as the elevation data (see step 3a).
- ii.
If the geologic map data are scanned images, you have the following two options: (1) import the image to the GIS and georeference it to align it with the map. The procedure for georeferencing analog images is covered in a webinar (https://www.youtube.com/watch?v=WbMdNvQcCOs; last access: 13 June 2021). (2) work side-by-side, comparing the information from your geologic map with that on the GIS. This is less precise, but if you are careful, you can make it work.
- i.
- d.
To better understand the drainage patterns of this landscape, extract a set of topographic contour lines. Again, use the “raster” menu. Go to “Extraction” > “Contour… ” A good interval to start with is 20. If the contour lines end up looking too crowded or too spread out, you can make new contour layers with different intervals.
- e.
Now that you have detailed topographic maps with contour intervals, you may want to revisit the rule of V's for determining flow paths over land surfaces (https://d32ogoqmya1dw8.cloudfront.net/files/teachearth/activities/watercourses_ridges_topographic_maps_why_vs.pdf; last access: 13 June 2021).
If you have access to a printer, you can print out a paper copy of the map you built and draw the drainage patterns in with a pencil. There are two digital options for drawing in the water flow paths. For the first, you can export the image of the map in QGIS as a .png format. To do this, go to the “Project” menu and select “Save as Image…”, and then use a photo editor to draw flow paths on the map. If you have more GIS experience, you may want to work directly in the GIS and make new vector layers to create surface flow paths.
- i.
Questions: describe the flow paths you drew on your map. What was your reasoning for electing to draw the flow paths you did? What challenges or obstacles did you encounter while determining the routes water would take? How did you overcome the challenges or obstacles to determine the routes?
- i.
- f.
To determine flow paths more objectively, use a software designed with flow-routing algorithms. Here we will use Topographic Analysis Kit (TAK). You first need to give the software the output files name prefix and select the output directory, and then load the reprojected DEM (GeoTIFF file) into TAK. If it gives you an error regarding whole numbers, do not worry as your file has still loaded correctly. Check the box labeled “Resample” and then click “Run MakeStreams”. This is as far as this activity goes with regard to using TAK, but it is a powerful tool for doing geomorphological analysis. If you are curious, I recommend you check out the documentation at GitHub and explore it further on your own.
- g.
From the TAK output file folder, drag and drop your new shapefile into the GIS. If you do not see your streams overlaying the topography, right-click on your streams vector layer name. Go to “Properties” > “General” > “Coordinate Reference System.” Select the appropriate CRS. Click on “Update extents”, “Apply”, “OK”.
- a.
- 4.
Data analysis
- a.
Compare the stream network predicted by TAK with the one you drew in step 3e. What similarities or differences do you see between the two networks? Which one do you think is more accurate? Why?
- b.
Using your observations of the geology, the topography, and the hydrogeology, construct a geologic and/or geomorphic history of your study area. What was the sequence of events at this site? Consider, in particular, depositional, tectonic, and erosional events. How did the stream network (or lack thereof) evolve?
- a.
- 5.
Hypothesis formulation
- a.
Some events in your proposed history will be more hypothetical than others. Please state which events need additional testing to be able to defend them.
- b.
What environmental or natural disaster hazards do you think might be issues in this landscape? Why do you think this? Write these ideas in the form of an additional hypotheses about this landscape.
- a.
- 6.
Experimental design
- a.
What data would you need to collect to support or refute your hypotheses? Please speculate as to the kinds of results that may be obtained for different types of data and what implications those might have for each hypothesis.
- b.
What field, laboratory, or numerical techniques would be required to obtain the data you need? Please be as specific as if you were planning for fieldwork, lab work, or numerical modeling.
- a.
Sharing science
-
After completing the exercise, as an individual or as part of a small group, present your findings to the whole class.
-
Write a formally structured report (including the title, author's name, date, abstract, introduction, methods, results, discussion, and conclusion). Within the report, or as a separate document, reflect on your experience with this activity and assess your level of understanding before and after the activity of (a) © Google Earth, (b) GIS, (c) UTM CRS, (d) topographic map interpretation, (e) TAK, (e) karst hydrogeology, (f) geologic history construction, (g) hypothesis formulation, and (h) scientific experiment design.
No data sets were used in this article.
The executable research compendia can be found at https://serc.carleton.edu/NAGTWorkshops/online_field/activities/237039.html (Bosch, 2020b) and https://serc.carleton.edu/NAGTWorkshops/online_field/activities/237267.html (Bosch, 2020c).
The video supplement associated with this work is a YouTube video of the author presenting this work at the Geological Society of America 2020 Connects Online conference (https://www.youtube.com/watch?v=3YvbUOlBRs0, Bosch, 2020a).
The author declares that there is no conflict of interest.
Publisher's note: Copernicus Publications remains neutral with regard to jurisdictional claims in published maps and institutional affiliations.
This article is part of the special issue “Virtual geoscience education resources”. It is not associated with a conference.
This work was made possible by Chris Atchison, Kurt Burmeister, Anne Egger, Katherine Ryker, and Basil Tikoff, who coordinated the geoscience community to join together during the COVID-19 pandemic of 2020 to provide a large set of freely available virtual field learning experience activities. Aida Farough and Bridget Mulvey, as co-leaders for the Hydrogeology/Environmental Geology working group, provided invaluable support as I, and other members of the team, designed our activities. Much gratitude is due to Lisa Shantz, for reaching out via email to ask about capstone opportunities during the pandemic. Lisa played a key role in motivating me to develop the virtual capstone pathways. Thank you to Craig Dietsch and Krista Smilek from the University of Cincinnati Department of Geology, for embracing my virtual capstone pathways design, and to Dan Sturmer, for working hard to implement it. Aaron Bird did wonderfully as the cinematographer for the activity promotion video that I presented at GSA 2020 Connects Online. I am grateful to Ian Castro, Brooke Crowley, and Chris Atchison for reviewing this paper prior to submission. Finally, thanks go to Samuel Bosch-Bird for modeling as the “student” in all photos.
This paper was edited by Steven Whitmeyer and reviewed by two anonymous referees.
Atchison, C. L. and Feig, A. D.: Theoretical Perspectives on Constructing Experience through Alternative Field-Based Learning Environments for Students with Mobility Impairments, Qualitative Inquiry in Geoscience Education Research, 44, 11–21, 2011.
Bosch, R.: From Field to Phone: A Karst Camp Chronicle, available at: https://www.youtube.com/watch?v=3YvbUOlBRs0 (last access: 13 June 2021), 2020a.
Bosch, R.: Karst Hydrogeology: A virtual field introduction using Google Earth and GIS, Tech the Earth, available at: https://serc.carleton.edu/NAGTWorkshops/online_field/activities/237039.html (last access: 16 June 2021) 2020b.
Bosch, R.: Karst Hydrogeology and Geomorphology: A virtual field experience using Google Earth, GIS, and TAK, Tech the Earth, available at: https://serc.carleton.edu/NAGTWorkshops/online_field/activities/237267.html (last access: 16 June 2021) 2020c.
Brooks, J. G. and Brooks, M. G.: In search of understanding: The case for constructivist classrooms, Association for Supervision and Curriculum Development, Alexandria, Virginia, United States, 1999.
Burmeister, K., Rademacher, L., and Ryker, K.: Activity Review Process, Teach the Earth: The Portal for Earth Education, https://serc.carleton.edu/NAGTWorkshops/online_field/review_process.html, last access: 2 November 2020.
Carabajal, I. G. and Atchison, C. L.: An investigation of accessible and inclusive instructional field practices in US geoscience departments, Adv. Geosci., 53, 53–63, https://doi.org/10.5194/adgeo-53-53-2020, 2020.
Carabajal, I. G., Marshall, A. M., and Atchison, C. L.: A Synthesis of Instructional Strategies in Geoscience Education Literature That Address Barriers to Inclusion for Students with Disabilities, Journal of Geoscience Education, 65, 531–41, 2017.
Clary, R. M. and Wandersee, J. H.: Virtual Field Exercises in the Online Classroom: Practicing Science Teachers' Perceptions of Effectiveness, Best Practices, and Implementation, Journal of College Science Teaching, 39, 50–58, 2010.
Dolphin, G., Dutchak, A., Karchewski, B., and Cooper, J.: Virtual Field Experiences in Introductory Geology: Addressing a Capacity Problem, but Finding a Pedagogical One, Journal of Geoscience Education, 67, 114–30, 2019.
Forte, A. M.: Topographic Analysis Kit, https://github.com/amforte/Topographic-Analysis-Kit, GitHub, last access: 15 May 2020.
Goldscheider, N.: World Karst Aquifer Map, https://www.whymap.org/whymap/EN/Maps_Data/Wokam/wokam_node_en.html, Federal Institute for Geosciences and Natural Resources (BGR), last access: 2 November 2021.
Goldscheider, N., Chen, Z., Auler, A. S., Bakalowicz, M., Broda, S., Drew, D., and Hartmann, J.: Global distribution of carbonate rocks and karst water resources, Hydrogeol. J., 28, 1661–1677, https://doi.org/10.1007/s10040-020-02139-5, 2020.
Granshaw, F. D.: Designing and Using Virtual Field Environments to Enhance and Extend Field Experience in Professional Development Programs in Geology for K-12 Teachers, PhD dissertation, Portland State University, Portland, Oregon, USA, https://doi.org/10.15760/etd.280, 2011.
Marshall, A. M. S.: Evaluation of Academic and Social Engagement in a Technology-Based Collaborative Approach to Inclusive Geoscience Field Learning, PhD dissertation, University of South Florida, Tampa, Florida, USA, available at: http://scholarcommons.usf.edu/etd/7193 (last access: 13 June 2021), 2018.
National Association for Geoscience Teachers (NAGT): Learning Objectives and Assessment for Field Experiences Working Group, https://nagt.org/nagt/teaching_resources/field/designing_remote_field_experie.html#outcomes (last access: 13 June 2021), 2020.
Olivas, N.: Watercourses and Ridges on Topographic Maps: Why the V's?, UnCivilEngineer (blog), available at: https://d32ogoqmya1dw8.cloudfront.net/files/teachearth/activities/watercourses_ridges_topographic_maps_why_vs.pdf, (last access: 13 June 2021)
- Abstract
- Introduction
- Karst hydrogeology: a virtual field introduction using © Google Earth and GIS
- Karst hydrogeology: a virtual field experience using © Google Earth, GIS, and TAK
- Virtual capstone pathway design
- Karst activities and virtual capstone pathways implementation
- Discussion
- Appendix A: Introductory activity: student handout
- Appendix B: Advanced activity: student handout
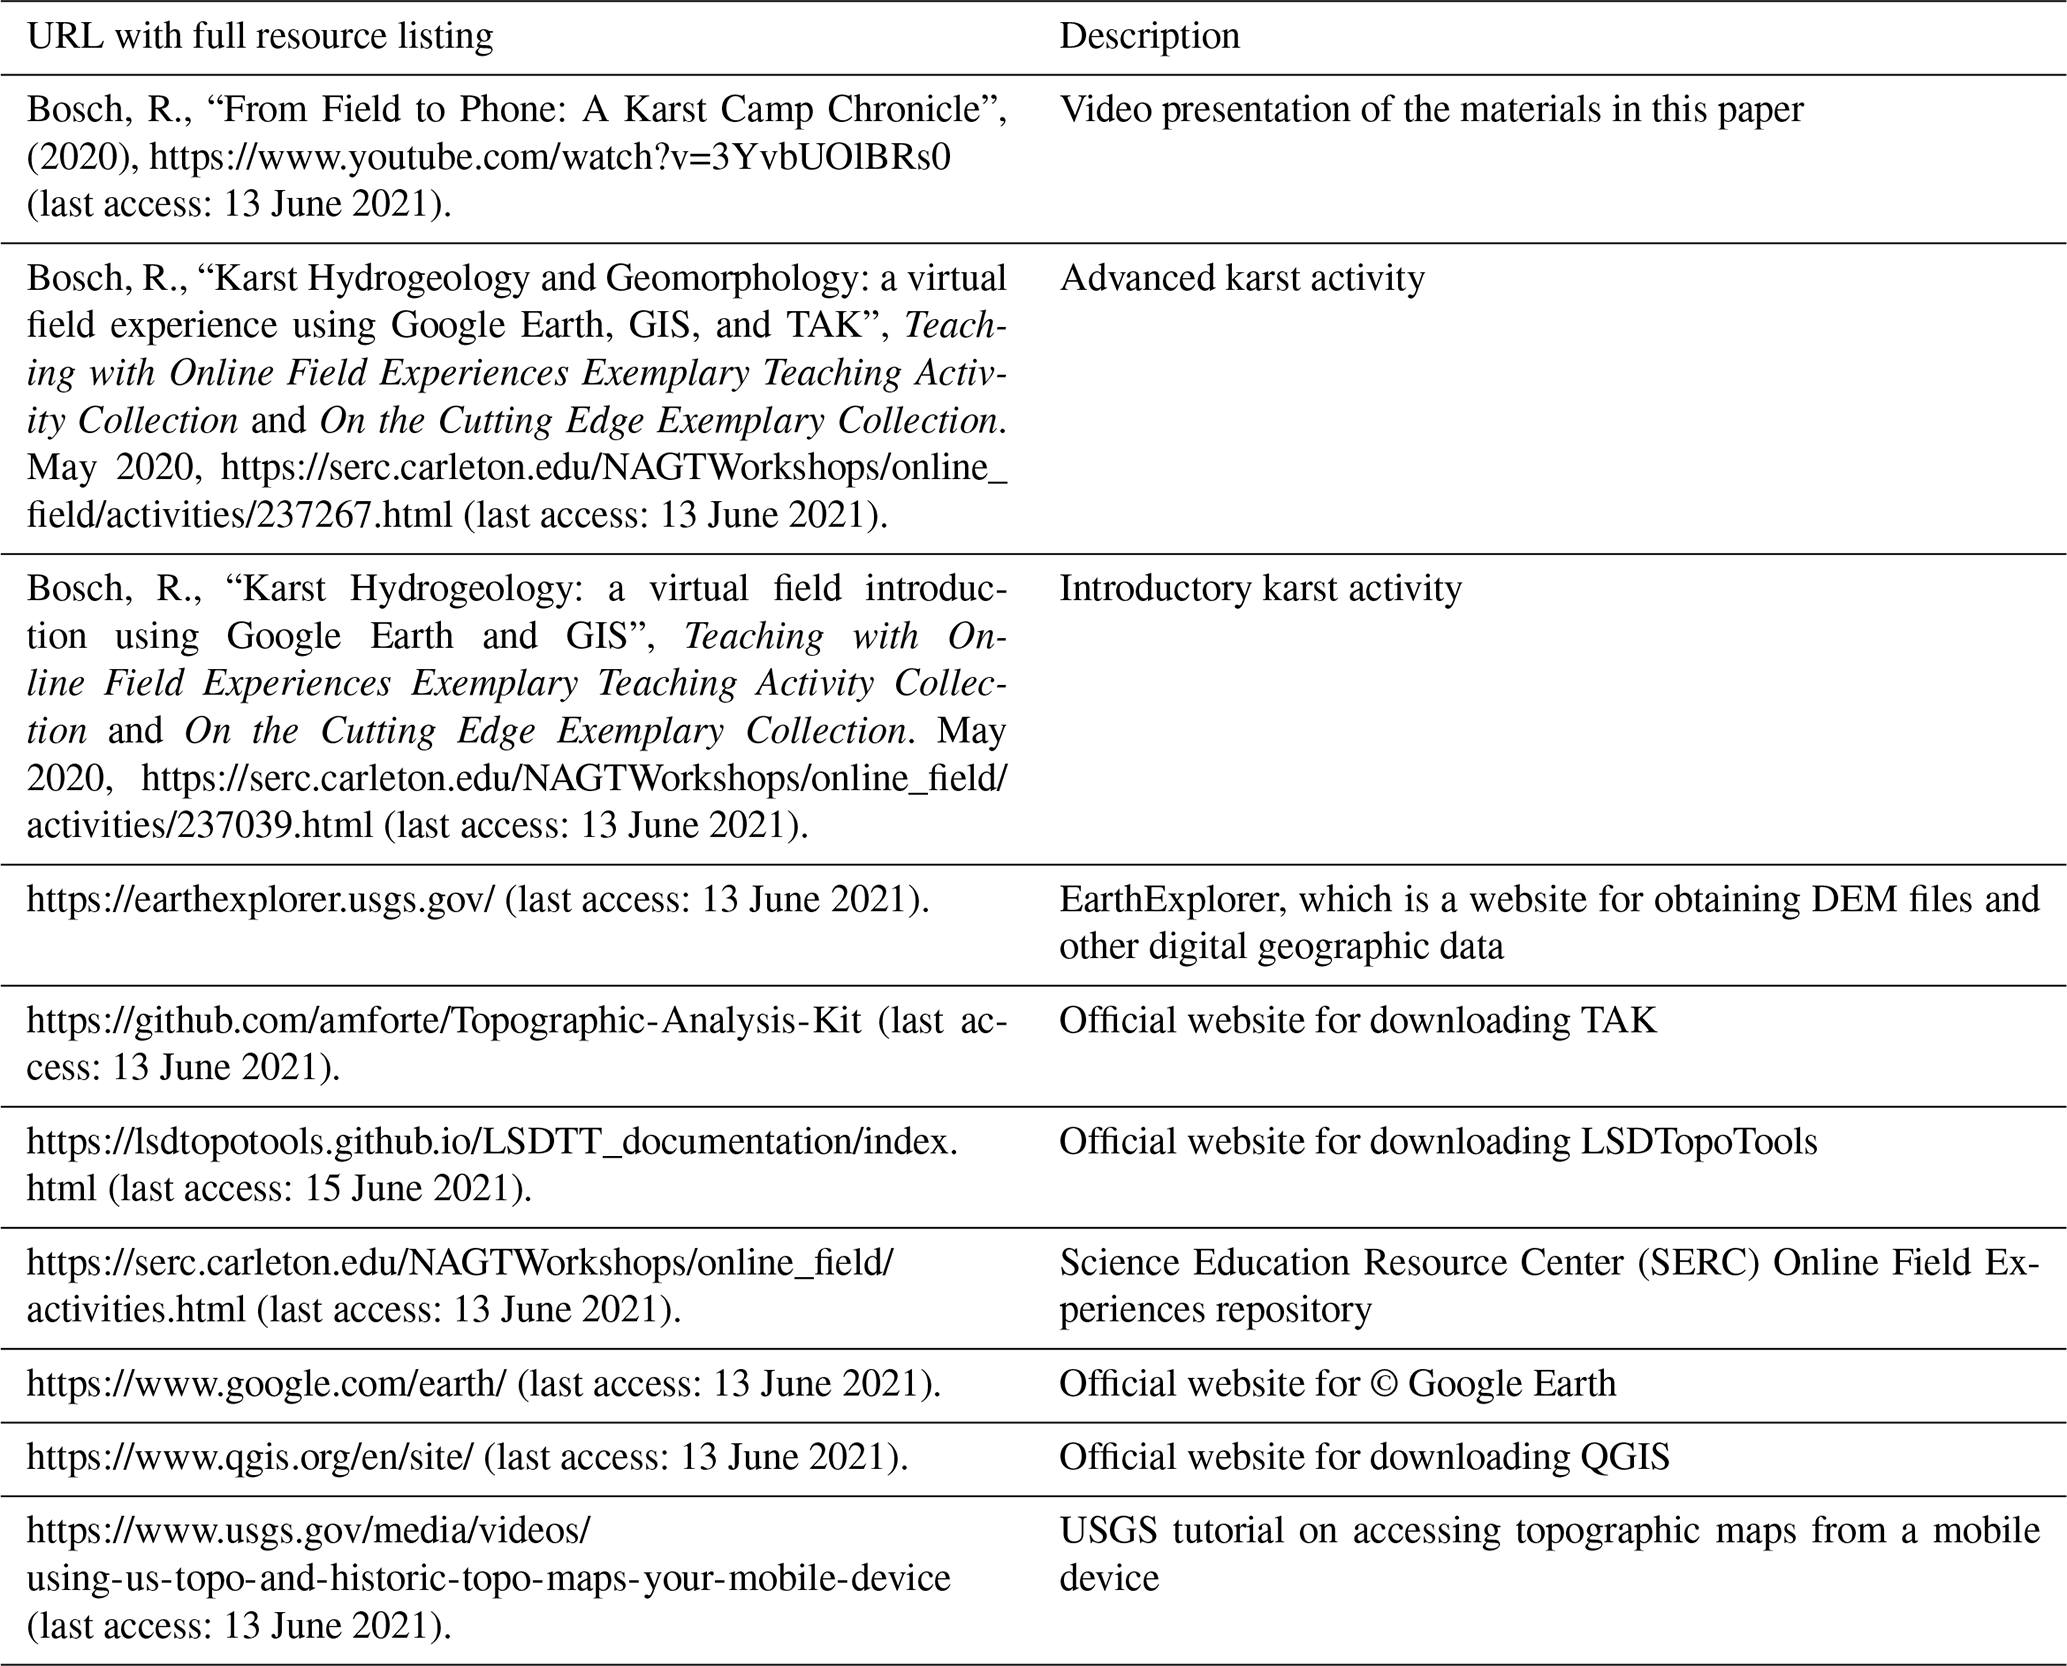
- Appendix C: List of internet resources
- Data availability
- Executable research compendium (ERC)
- Video supplement
- Competing interests
- Disclaimer
- Special issue statement
- Acknowledgements
- Review statement
- References
- Abstract
- Introduction
- Karst hydrogeology: a virtual field introduction using © Google Earth and GIS
- Karst hydrogeology: a virtual field experience using © Google Earth, GIS, and TAK
- Virtual capstone pathway design
- Karst activities and virtual capstone pathways implementation
- Discussion
- Appendix A: Introductory activity: student handout
- Appendix B: Advanced activity: student handout
- Appendix C: List of internet resources
- Data availability
- Executable research compendium (ERC)
- Video supplement
- Competing interests
- Disclaimer
- Special issue statement
- Acknowledgements
- Review statement
- References