
the Creative Commons Attribution 4.0 License.
the Creative Commons Attribution 4.0 License.
 | 26 Aug 2026
Citizen science as a long-term environmental baseline: assessing impacts of a small dam removal in Montana, USA
Bethany Blakey
As dam removals increase in frequency across Europe and North America, most research has focused on the impact of larger dam removals, despite the removal of small dams being much more common. There are hundreds of small dams in Montana, USA, and this research investigates impacts on stream ecology and morphology using citizen science data collected over eight years spanning before and after a 2020 small dam removal in Rattlesnake Creek. We analyzed pebble count grain size distributions and aquatic macroinvertebrate biotic indices from 2017 to 2024 to assess changes in sediment transport and macroinvertebrate population as well as evaluate the efficacy of citizen science for long-term stream monitoring. Our analysis includes comparisons of pre– and post–dam removal data collected from above and below the dam site. Our findings revealed no significant changes in grain size or macroinvertebrate index values between upstream and downstream reaches post–dam removal, suggesting that the removal of this small dam had minimal detectable impact on sediment transport and macroinvertebrate communities within the study period. Our study also demonstrates the capacity for citizen science programs to effectively collect robust and valuable datasets. This study underscores the importance of meticulous data management along with the potential for, and challenges of, citizen science for environmental research. We provide recommendations for “best practices” to improve future citizen science monitoring and informing decision-making for future dam removals, particularly for the nine dams further upstream within the Rattlesnake Creek watershed.
- Article
(1407 KB) - Full-text XML
-
Supplement
(1796 KB) - BibTeX
- EndNote


The U.S. has an estimated 2.5 million dams, the majority of which are under 1.83 m tall and are classified as small dams (Brewitt and Colwyn, 2019; Kibler et al., 2011). A dam serves as a barrier to more than just water, blocking the transport of sediment, large wood, and nutrients, as well as passage of fish. As a result, dams can negatively impact the health of the stream, decreasing the presence of certain biota and the complexity of physical habitat (Foley et al., 2017; Hart et al., 2002; Kibler et al., 2011; Tonitto and Riha, 2016; Tullos et al., 2014). However, particularly for the removal of historic dams, the rapid release of sediment, large wood, and nutrients can negatively impact species of fish and macroinvertebrates immediately following removal (Chiu et al., 2013; Hart et al., 2002; Lu et al., 2022; Orr et al., 2008; Tullos et al., 2014). Understanding how small dam removals affect the geomorphology and ecology of a stream is essential to understanding the extent of impacts on a stream from dam removal. Given the diverse geographical distribution of dams in the United States and the role of sediment size, channel slope, flow, and other watershed-specific variables on creek restoration, it is important to understand the effects of small dam removal in specific environments (Hart et al., 2002; Kibler et al., 2011). In addition, most studies lack the duration necessary to determine long-term impacts of dam removal (Bellmore et al., 2016; Foley et al., 2017; Hart et al., 2002; Tonitto and Riha, 2016). By understanding how small dam removals in Montana have impacted waterways, the effects of dam removal can be more accurately anticipated when proposing similar projects in the Pacific Northwest. Advancing the science on small dam removals will help quantify the impact of these removals and promote healthier streams for ecological, societal, environmental, and recreational benefits. Especially relevant to this study site in Rattlesnake Creek, Montana, are the nine additional dams upstream in the Rattlesnake Wilderness (Rice and Armatas, 2024; Engage Missoula, 2026). The present study will help determine how their removal may impact the creek.
The Watershed Education Network (WEN) is a non-profit organization in Missoula, Montana, that has been leading citizen science efforts locally for 21 years. Stream Team is a WEN citizen science program that engages community members of all ages and backgrounds to monitor two creeks in Missoula, collecting valuable scientific data to document long-term trends in discharge, water chemistry, vegetation, aquatic macroinvertebrates, pebble counts, and cross-section profiles. Participating in citizen science endeavors has shown to improve individuals' knowledge of the scientific process, and community-based scientific monitoring gives voices to people who otherwise would not be in environmental conversations (Bonney et al., 2015). Citizen science is an especially effective method of environmental education when combined with focusing on local environmental issues, taking action, and reporting data (Ardoin et al., 2019). Furthermore, citizen science allows data collection on a spatial and temporal scale that would otherwise be difficult to obtain without significant funding, and by establishing “best practices” citizen science can meet the standards of data collection and further scientific research (Rubio-Iglesias et al., 2020)
This research seeks to answer the following questions: (1) How has Rattlesnake Creek changed since the dam removal in 2020? (2) Can citizen science projects effectively monitor wadeable streams local to their communities?
2.1 Small dam removal in the western United States
Research on the removal of small historic dams has shown the ecological benefits of small dam removal (Abbott et al., 2022; Orr et al., 2008; Tullos et al., 2014). For most dam removals, no data is collected, and most studies focus on short-term post–dam removal impacts and include little to no pre–dam removal data (Bellmore et al., 2016; Foley et al., 2017). Some positive impacts of dam removal have been identified as the return of macroinvertebrate communities, dissolved oxygen, and sediment composition levels to healthier or upstream of the dam values (Abbott et al., 2022; Mahan et al., 2021; Maloney et al., 2008; Orr et al., 2008; Tullos et al., 2014). While the impacts of small dam removal are mostly positive, studies show that the release of trapped sediment and restored connectivity post–dam removal can initially lower water quality (Orr et al., 2008), shift macroinvertebrate assemblages (Mahan et al., 2021; Maloney et al., 2008), negatively impact juvenile fish growth (Lu et al., 2022), and allow the downstream spread of invasive species (Mahan et al., 2021).
The erosion of non-cohesive reservoir sediment following dam removal has been characterized as a two-phase response, starting with a “process-driven” rapid flush of sediment phase, which is followed by an “event-driven”, supply-limited phase where further erosion requires high flows (Collins et al., 2017; East et al., 2018; Pearson et al., 2011). The resilience of a river to dam removal depends on several factors, including response to this pulse in sediment, the magnitude of the changing conditions, the complexity and connectivity of the creek, and whether there is enough energy in the creek to process the disturbance and return to its natural state (Tullos et al., 2014). Additionally, the response of a river to dam removal relies on the timeline of dam removal (Duda and Bellmore, 2022; Foley et al., 2017; Sawaske and Freyberg, 2012). Staged dam removals, which occur over months to years, tend to have lower erosion rates following removal compared to nonstaged removal, where the dam is removed in one period (Sawaske and Freyberg, 2012). It has also been found that phased dam removals can minimize the impacts of the removal on fish and sensitive aquatic species (Duda and Bellmore, 2022).
In response to river management and restoration, dam removals globally have been increasing, particularly those of small old dams in Europe and North America (Ding et al., 2019; Foley et al., 2017). Within North America, most research conducted on small historic dam removals has been focused on the eastern United States (Tonitto and Riha, 2016). Similar results may be expected in the western US in terms of hydrologic flows, sediment transport, and channel evolution; however, each of these variables are impacted by the specific watershed environment and require local studies. Given the complexity of how streams respond to the changes resulting from dam removal, it is important to build upon the existing research with additional studies, especially those contributing to the emerging dataset of the western US.
2.2 Geographic setting of Rattlesnake Creek, Montana
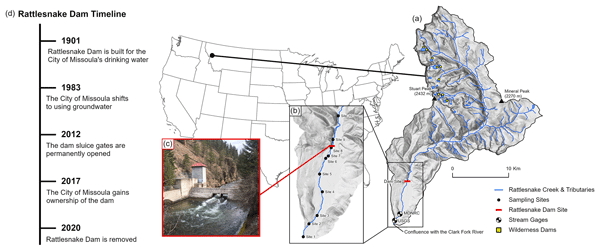
Rattlesnake Creek is a perennial, third-order tributary to the Clark Fork River northeast of the city of Missoula, Montana, in the Pacific Northwest (Fig. 1). The upstream portion of the creek flows through the Rattlesnake Wilderness area managed by the U.S. Forest Service. The watershed outlet is at the confluence with the Clark Fork River (Fig. 1a; 46.86737°, −113.98562°). Its total drainage area is 210 km2 and flows for approximately 37 km. Rattlesnake Creek runs through the valley between Stuart Peak (2432 m elevation) and Mineral Peak (2270 m elevation). The total relief of the watershed is 1655 m with a mean basin elevation of 1738 m. Mean annual precipitation of the watershed is 102.2 cm, mean annual temperature is 3.95 °C, and about 81 % of the watershed is forested (USGS, 2019). Rattlesnake Creek runs through the Rattlesnake National Recreation Area and Wilderness, which is situated immediately to the northwest and adjacent to the city of Missoula, Montana. This area is popular for recreation year-round including hiking, biking, horseback riding, skiing, trail running, kayaking, and family picnicking.
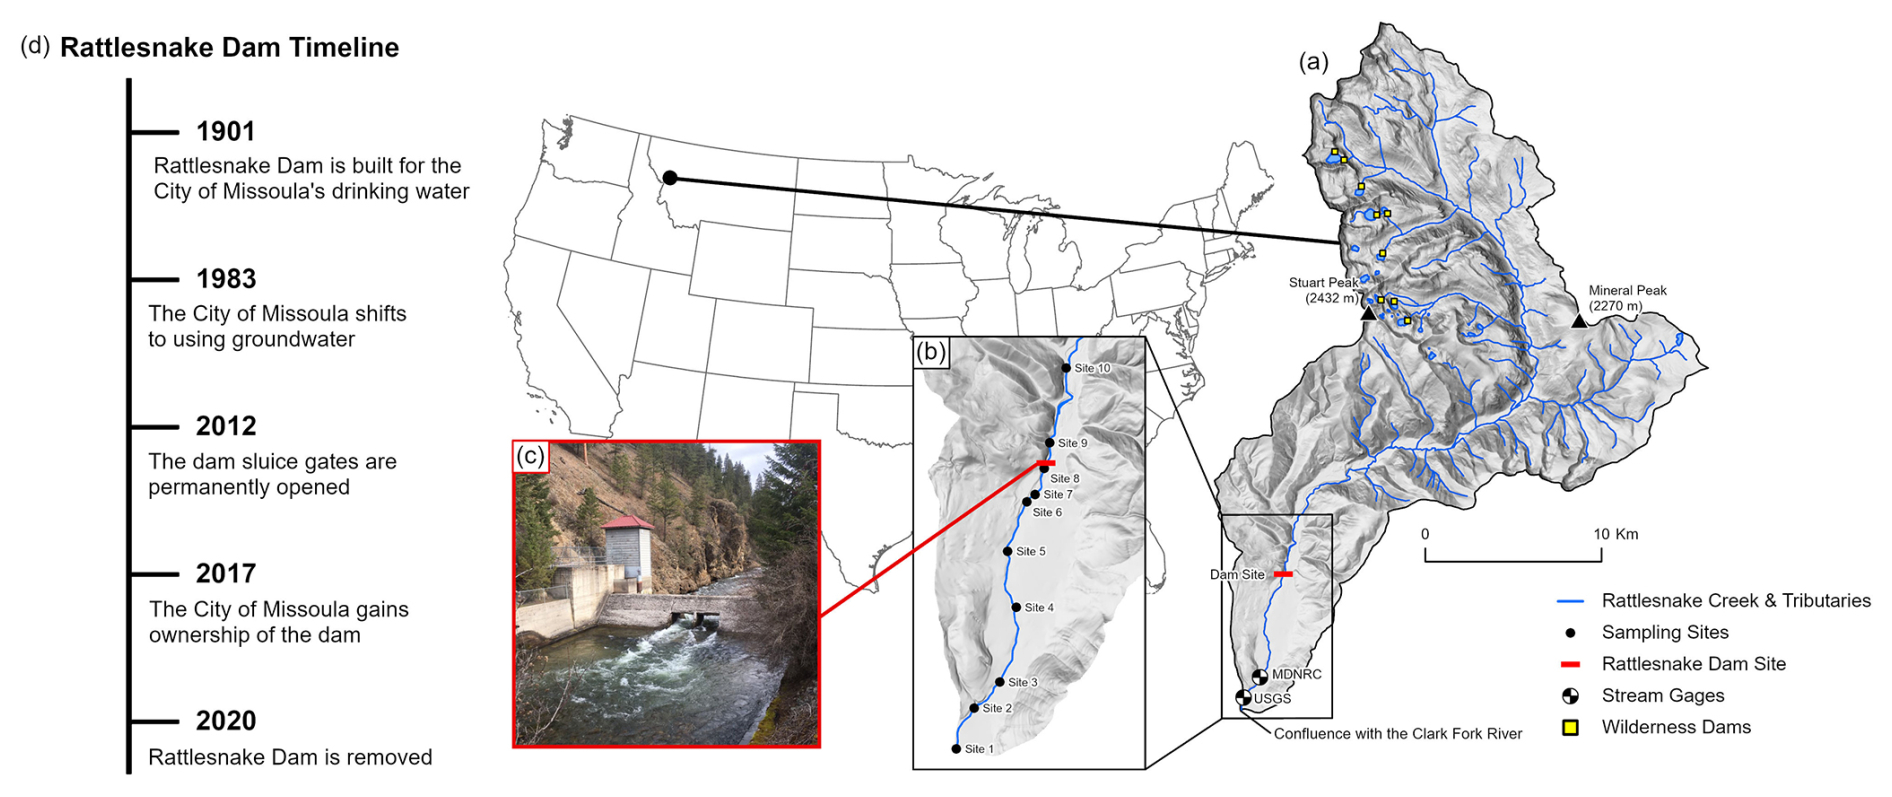
Figure 1Location of the Rattlesnake Creek watershed (a) in Montana, United States, with the locations of the nine upstream wilderness dams (yellow squares). Stream Team monitoring site locations are indicated along with the Rattlesnake Dam site (red bar) and the Montana Department of Natural Resources and Conservation (MDNRC) stream gage and decommissioned USGS stream gage. Downstream sites 1–8 are the impact sites (b), upstream sites 9 and 10 are the reference sites (b). A photo of the dam (c) before removal and after permanent opening of the sluice gates is shown (from TU). A timeline of the Rattlesnake dam (d) highlights main events from the construction to removal of the dam.
An active stream gage managed by the Montana Department of Natural Resources and Conservation (MDNRC) is located at the upper end of Greenough Park, 2.3 km from the outlet of Rattlesnake Creek into the Clark Fork River. The upper 98.8 % of the watershed is discharged through this gaging station. This station began recording in 2017, documenting discharge that ranges from 0.23 to 31.8 m3 s−1, with an average annual discharge of approximately 3.0 m3 s−1. There is also an abandoned USGS gage (12341000) on the creek that operated briefly in 1899 and continuously from 1958 to 1967 and is located 270 meters upstream from the outlet to the Clark Fork River. In its headwaters, Rattlesnake Creek is fed by approximately 45 high-elevation lakes, seven of which are dammed (Rice and Armatas, 2024). The dams were built between 1911 and 1923 to increase water storage for the City of Missoula. In 2024, the McKinley Lake dam was removed, leaving nine dams in the wilderness (Engage Missoula, 2026).
The downstream-most dam on Rattlesnake Creek was located 8 km from the confluence with the Clark Fork River (Fig. 1). The dam was constructed in 1901 and was 18 m wide, 3 m tall, and 4.5 m thick, and at that location, blocked 95 % of the watershed. The reservoir provided drinking water for the City of Missoula until 1983, when, due to giardia concerns, the City shifted to using groundwater (Trout Unlimited et al., 2021). The reservoir was maintained as a backup water supply, but because Rattlesnake Creek supports native species of fish, including bull trout (Salvelinus confluentus), westslope cutthroat trout (Oncorhynchus clarkii lewisi), longnose dace (Rhinichthys cataractae), and mountain whitefish (Prosopium williamsoni), a fish ladder was installed in 2003. The fish ladder had an estimated 50 %–90 % efficiency (Deb Fassnacht, personal communication, 30 March 2025; Trout Unlimited et al., 2021; Stephie Novak, personal communication, 21 October 2024). By 2011, the reservoir was no longer being used as a backup water supply, and in 2012 the dam sluice gates were permanently opened, allowing passage of water, fish, and sediment during low to moderate flow through the holes that were previously the sluice gates (Fig. 1c). During high flow, however, the water velocity through the sluice gate opening was too high for spring fish migration (Trout Unlimited et al., 2021). Studies have shown fish recovery through spawning success after weir removal in similar riverine settings (e.g. Birnie-Gauvin et al., 2018), however no fish specific study was conducted on Rattlesnake Creek after the full dam removal had been completed (Trout Unlimited et al., 2021).
In 2017, the City of Missoula obtained ownership of the dam and agreed to work with Trout Unlimited (TU) to develop a plan for its removal due to safety and conservation concerns related to the dam's deterioration. In 2020, the dam removal project began: Rattlesnake Creek was dewatered in July, and the stream channel and banks were reconstructed using gravel, logs, brush, cobbles, and boulders from the site. In total, over 300 m of stream were reconstructed by the completion of the project in October 2020 (Trout Unlimited et al., 2021). The total cost of the dam removal was USD 1.1 million, and Rattlesnake Creek remains heavily dammed upstream in the wilderness area (Rice and Armatas, 2024).
2.3 Citizen science and public engagement in the environment
Getting the public involved in environmental education promotes actions, behaviors, and improvements for the environment (Ardoin et al., 2019; Church et al., 2019; Frigerio et al., 2021). The most effective environmental education programs focus on localized environmental issues, collaboration with scientists and resource managers, and taking actions that lead to physical environmental improvements (Ardoin et al., 2019). Citizen science is an especially effective method of environmental education, as it involves local focus, taking action, and reporting and has shown improvement in the scientific knowledge of participants (Ardoin et al., 2019; Bonney et al., 2015; Frigerio et al., 2021). Community-based scientific monitoring also helps shape scientific questions to address community needs and gives community members opportunities to engage with local environmental issues and take environmental action (Ardoin et al., 2019; Bonney et al., 2015; Novacek, 2008).
Citizen science is also an effective means for collecting data at temporal and spatial scales that are often not possible otherwise (Blake and Rhanor, 2020; Church et al., 2019; Deacon et al., 2023; Rubio-Iglesias et al., 2020). Despite some scientists being skeptical of the quality of datasets generated by volunteers from the general public (e.g. Aceves-Bueno et al., 2017; Downs et al., 2021; Kosmala et al., 2016), the potential for citizen science to advance environmental research exceeds those concerns (Kosmala et al., 2016; Rubio-Iglesias et al., 2020). Some researchers have found citizen science data to be more variable than data collected by professionals, other studies have found volunteers' data collection to be comparable to that of scientists, and others assert that direct comparisons between data from professional scientists and citizen scientists are not appropriate for assessing quality due to different methods and the ability to find and correct for patterns in citizen science data (Aceves-Bueno et al., 2017; Downs et al., 2021; Kosmala et al., 2016; Specht and Lewandowski, 2018). Importantly, citizen science frequently produces data that is scientifically sound and of high enough quality to use in scientific research, especially when data quality is documented (Ardoin et al, 2019; Deacon et al., 2023; Downs et al., 2021; Kosmala et al., 2016).
2.4 The Watershed Education Network and the Rattlesnake Creek project
WEN's mission is to “foster knowledge, awareness, and appreciation of watershed health through citizen science, youth and school engagement, and outreach to our [sic] communities” (WEN, 2025). WEN organizes school programs for rural and under-served schools in Western Montana, a Backyard Citizen Science program to give families kits to monitor water near their homes, Backcountry Stream Corps to conduct wood surveys, groundwater monitoring excursions, and Stream Team to monitor Rattlesnake Creek and Grant Creek (Stephie Novak, personal communication, 21 October 2024). Stream Team's monitoring of Rattlesnake Creek began in 2017, 3 years before the dam removal in 2020, and has been ongoing post–dam removal with annual monitoring of locations above and below the dam site (Fig. 1b). Throughout this project, WEN has involved hundreds of citizen scientists who have collectively volunteered over 4000 h from 2017 to 2024 (Table 1; Deb Fassnacht, personal communication, 30 March 2025).

During the planning stages of the dam removal, TU gave funds to WEN to support monitoring the health of the creek before and after the dam removal. This study analyzes the data collected by citizen scientists from WEN's Stream Team program, which received supplemental support from the Open Rivers Fund and other partners to monitor Rattlesnake Creek's response to the removal of this small dam. The Stream Team data will be used to quantify impact from the removal of the dam, assess the efficacy of the citizen science stream health monitoring protocol, and contribute to the broader understanding of how similar small dam removals impact streams in the Pacific Northwest.
3.1 Stream Team: citizen science data collection
WEN's Stream Team is a citizen science program where community members volunteer to monitor various stream attributes. Volunteers, including families, students, retirees, and community members, meet every Sunday from August to November. WEN actively recruits for Stream Team by tabling at community events, word of mouth, posters at schools and businesses, and sandwich boards set up during Stream Team outings (Stephie Novak, personal communication, 27 March 2026). Anyone is welcome to volunteer, and they do so by acknowledging their interest via e-mail or signing up at a tabling event. Stream Team outing dates are communicated to those who indicated their interest and volunteers show up at the given time and location. WEN strives to include individuals of all backgrounds and abilities in their programs, adjusting programs as needed to minimize risk to participants while maintaining scientific rigor. Citizen scientists act in the capacity of a true researcher and any identifying information they provide is kept strictly confidential. The only exception to this is when participants agree to share their identity with WEN, such as for photos or testimonials, and signed permissions are obtained. All volunteers sign waivers prior to attending Stream Team outings (Stephie Novak, personal communication, 27 March 2026).
Stream Team monitored Rattlesnake Creek from 2017 to 2024. On average a Stream Team outing has up to 20 % new volunteers accompanying a consistent core group of citizen scientists (Stephie Novak, personal communication, 27 March 2026). Stream Team collects a variety of stream health monitoring data that includes cross-sectional profiles, pebble counts, velocity, temperature, chemistry, turbidity, and aquatic macroinvertebrate counts (Fig. S1 in the Supplement). For detailed monitoring protocol that Stream Team volunteers are trained in every outing morning see Blakey (2025).
Because the dam sluice gates were permanently opened in 2012, allowing most streamflow to travel unimpeded downstream, we didn't expect to see changes in water properties like chemistry, temperature, or turbidity, and chose not to analyze these data in the present study. To address research question 1, “how has Rattlesnake Creek changed since the dam removal in 2020”, we planned to analyze cross-sections, pebble counts, and aquatic macroinvertebrates as these characteristics have been shown to change post-dam removal (Hart et al., 2002; Maloney et al., 2008; Orr et al., 2008). Previous studies have also found sediment transport and geomorphology to vary greatly depending on stream characteristics (East et al., 2018; Hart et al., 2002). Unfortunately, cross-sections could not be analyzed, which is discussed in Limitations. The details for site selection, pebble counts, and macroinvertebrate counts are described below as provided by Stephie Novak, WEN Stream Team coordinator (personal communication, 21 October 2024).
Ten sites, two upstream and eight downstream of the dam site along Rattlesnake Creek, were identified at the beginning of the project in 2017. Ten sites were selected to ensure that all sites could be visited with a once-a-week outing schedule during the nine to twelve weeks of baseline flow during the field season. The site locations (Table S1 in the Supplement) were chosen to be within a 15 min walk from a trailhead and with all but one site outside the Rattlesnake National Recreation Area and Wilderness, which has stricter access regulations. These selection criteria resulted in only two upstream sites, with the remaining eight downstream of the dam. The three lowermost sites were selected because of their location downstream of a bridge where future construction (beyond the timeline of the present study) is planned. Each year, photos and GPS points were used to ensure monitoring at sites remained consistent. Site information and summary of the vegetation, general morphology, and weather conditions were also reported as part of the monitoring protocol. The Stream Team monitoring hours each season varied, ranging from about 200 to nearly 900 h, depending on weather (influencing season duration) and the number of volunteers (Table 1). The initiation of the project in 2017, followed by the first full monitoring season in 2018, meant fewer volunteers and fewer site visits in those years, including only one of the upstream sites. Upstream and downstream cross-sections were delineated at the same locations every year using the site guide (including photos and GPS points). All additional data was collected between the two established cross-section locations. The cross-sections were set up at least 15 m apart, each delineated by a levelled and tightened string and tape measure attached at bankfull level across the stream.
A pebble count was conducted between the two cross-section locations from left to right bankfull following Wolman's (1954) procedure, measuring at least 100 samples. For aquatic macroinvertebrate counts, volunteers placed a D-ring net on the river bottom downstream of their position. With the net facing upstream, volunteers kicked the stream bed to collect macroinvertebrates and brought the nets back to the bank to sort by taxa. Volunteers continued collection at locations approximately 9 m apart until at least 300 macroinvertebrates were collected.
WEN created fill-in-the-blank paper datasheets for each data type collected by Stream Team volunteers. The forms include date, names of volunteers, instructions, number of trials, and information relevant to each data type. Datasheets were filled out and collected at the end of each Stream Team outing. During the winter season, after the completion of site visits, WEN volunteers entered the data into Excel workbooks for each site, with a sheet for every paper datasheet and corresponding cells for the information collected (i.e., a block of cells designated for entering each pebble's b-axis on the pebble count sheet). An example of a page from the workbook is included in the supplemental materials (Fig. S2). Each cell is color-coded and labeled to ensure information is placed correctly. Cells not intended to have data entered are filled with black to ensure data goes in the correct place. Calculations are automated, including a stream quality metric from the macroinvertebrate count, a histogram of pebble count data, velocity measurements, and data averages. Any additional information was recorded as notes. WEN staff verified that the Excel workbook and physical datasheets had the same information.
3.2 Data analysis
To analyze the data in RStudio (Version 4.6.1), we extracted values from the sheets in the Excel workbooks and put them in CSV files organized by site, year, and datatype that could be read into the program. Further cleaning was done in R to remove spaces before and after data and establish all data entries into a single column in the workbook. Missing data and obvious data entry errors were cross-checked with WEN to ensure all data were included and there weren't entry errors from the physical datasheets. Unfortunately, the cross-section profiles had substantial missing data until 2021. Thus, we chose to only analyze pebble counts and macroinvertebrates, as both datasets were mostly complete.
To analyze the pebble counts, we plotted grain size distributions for each site for every year and calculated the median grain size, D50; the 84th percentile grain size, D84; and the 16th percentile grain size, D16, as described by Wolman (1954) and others (e.g., Kibler et al., 2011).
To quantify stream health from macroinvertebrate data, we used the Water Action Volunteers (WAV) Biotic Index, a water quality index developed for Wisconsin streams that classifies taxa of macroinvertebrates based on how pollutant tolerant they are (WAV, 2015). This biotic index was adapted from the Hilsenhoff Biotic Index (HBI), which identifies organisms down to genus or species (Crall et al., 2011). Because species identification is not always possible in the field and difficult for citizen scientists, Wisconsin scientists from the Department of Natural Resources and the University of Wisconsin-Madison designed the WAV Biotic Index to align with the HBI, but with less taxonomic resolution (WAV, 2015). While this index was designed for use in Wisconsin streams, the taxa included in this biotic index are the same as the taxa monitored by WEN. Because the taxa are the same and the application is for citizen science-based stream monitoring, we determined that the WAV Biotic Index is appropriate to use for the present study's macroinvertebrate data.
This study uses the concepts developed for assessing the impacts of dam removal, including before-after/control-impact (BACI). BACI is a method that takes control sites and impacted sites to quantify change related to a time-specific event. For the present study, BACI is used to compare upstream and downstream reaches of this section of Rattlesnake Creek before and after the dam removal. Upstream sites are used for comparison (reference sites) as the characteristics from the upstream locations should not change post–dam removal (Conner et al., 2016; East et al., 2018; Orr et al., 2008; Smith, 2002; Stewart-Oaten et al., 1986). We used the BACI approach to quantitatively evaluate if the difference between upstream and downstream variables changed after the dam removal using the equation:
which calculates the mean difference between upstream and downstream sites following the dam removal minus the mean difference between upstream and downstream sites prior to dam removal (Abbott et al., 2022; Stewart-Oaten et al., 1986). We also calculated the standard error for each. We did not include data collected in 2020, as data for some sites was collected during the dam removal and some was collected after. Due to the small numbers of observations, especially for the reference sites (n=4 before dam removal and n=8 after dam removal), descriptive statistics were used for this analysis, rather than an ANOVA or t-test.
To address research question 1, “how has Rattlesnake Creek changed since the dam removal in 2020”, we conducted a comparison of pebble counts and biotic index values upstream and downstream of the dam site from pre– to post–dam removal datasets. A fining in the median grain size downstream post–dam removal and a transition to upstream and downstream reaches having similar grain sizes would indicate restored movement of sediment past the dam (East et al., 2018; Lu et al., 2022; Magilligan et al., 2021; Potyondy and Hardy, 1994). For macroinvertebrates, a decreasing WAV Biotic Index downstream would indicate a decrease in stream health and increase in pollution, while an increase in the index would indicate an increase in stream health and decrease in pollution (WAV, 2015).
Before the dam removal (2017–2019), the D16, D50, and D84 were roughly similar between sites upstream (sites 9–10; e.g. D50 had a mean of 105.9 ± 7.6 mm and ranged from 88.0 to 124.3 mm) and downstream (sites 1–8; e.g. D50 had a mean of 100.1 ± 6.9 mm and ranged from 59.0 to 146.7 mm; Table 2, Figs. 2a, S3, S4, and S5). Following dam removal, the grain size distributions remained similar between sites upstream (e.g. D50 had a mean of 92.9 ± 8.4 mm and ranged from 71.6 to 128 mm) and downstream (e.g. D50 had a mean of 93.3 ± 3.0 mm and ranged from 63.6 to 127 mm; Table 2, Figs. 2b, S3, S4, and S5). To quantify the effect of the dam removal while accounting for background effects, the magnitude of difference was calculated using Eq. (1). We found that all BACI values were less than their standard error, indicating that there was no notable magnitude of difference following dam removal across any of the measured grain size percentiles (Table S2; e.g. D50 value of 6.2 ± 13.6 mm).
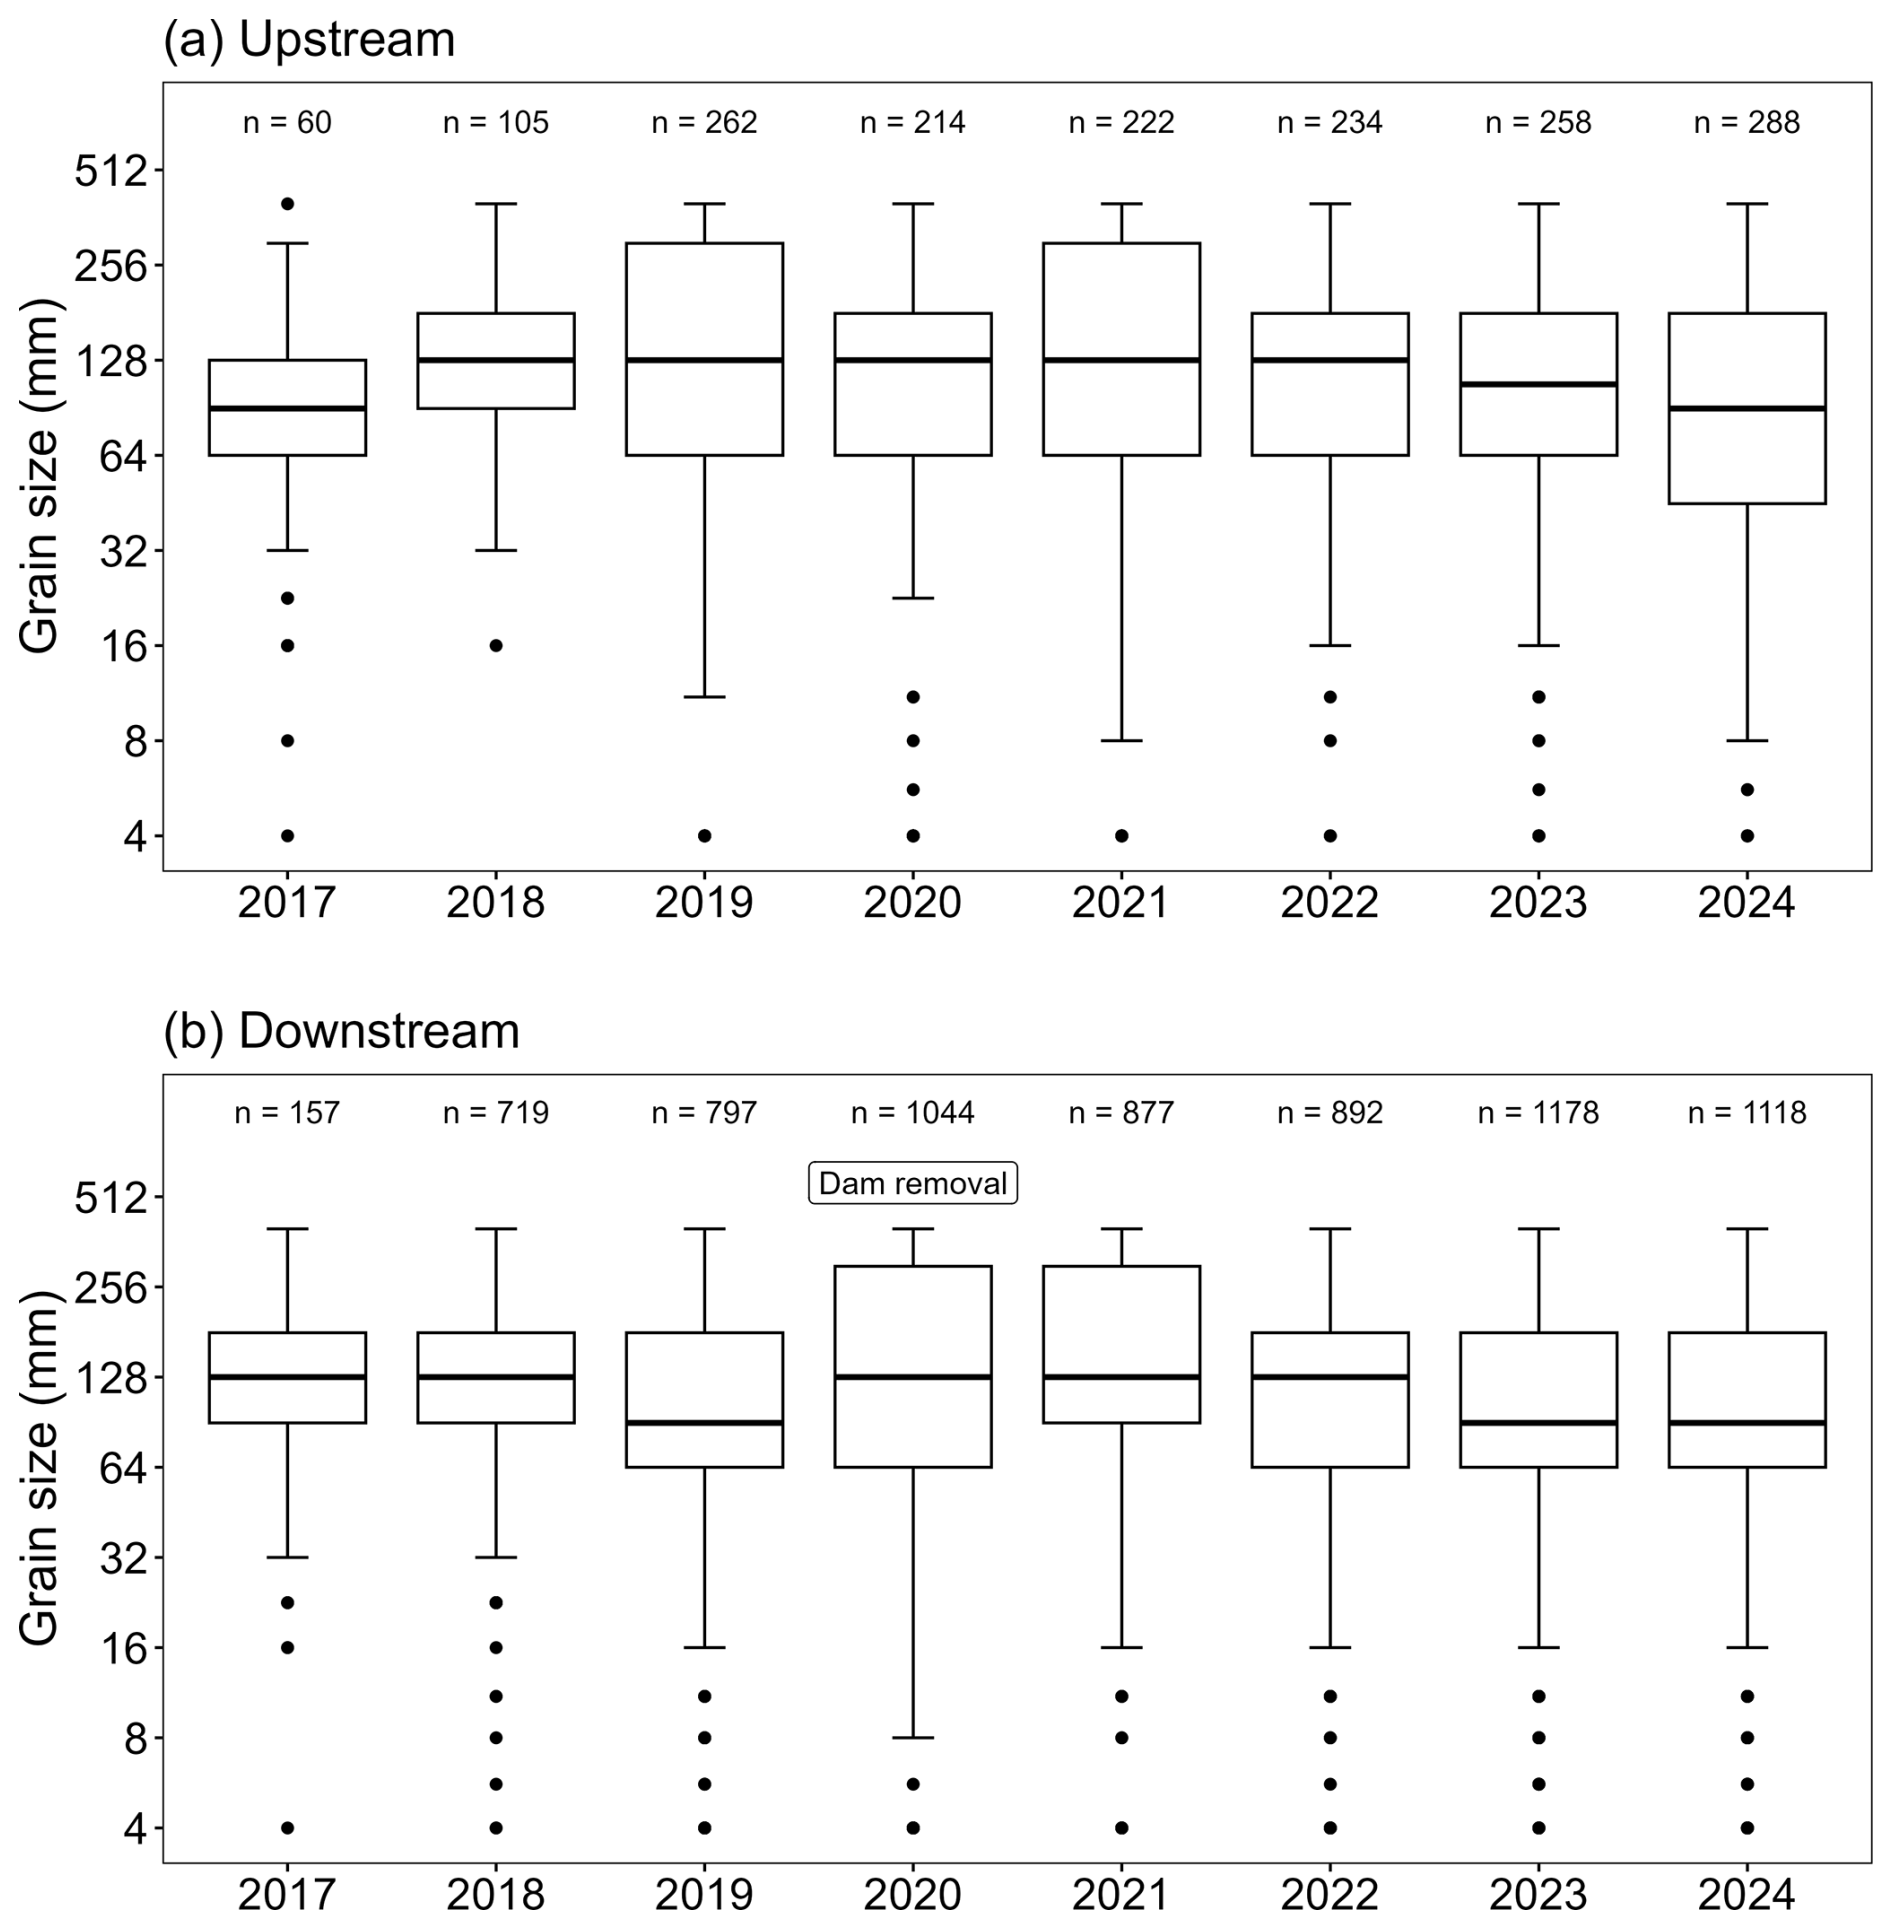
Figure 2Grain size variations from 2017 to 2024. Top chart (a) shows grain size variations in sites 9 and 10, which are upstream of the dam. Bottom chart (b) shows grain size variations in sites 1–8, downstream of the dam. The thick horizontal line through the box shows the median, the height of the box shows the interquartile range, the vertical lines represent 1.5 times the interquartile range, and the circles represent data points outside of 1.5 times the interquartile range. The number of observations (pebbles counted) for each year are indicated at the top of the plot. Dam removal occurred in 2020, and sites were sampled before, during, and after dam removal that year.
Table 2Mean and standard error values of grain size percentiles and WAV Biotic Index values for sites upstream and downstream of the dam before and after dam removal.
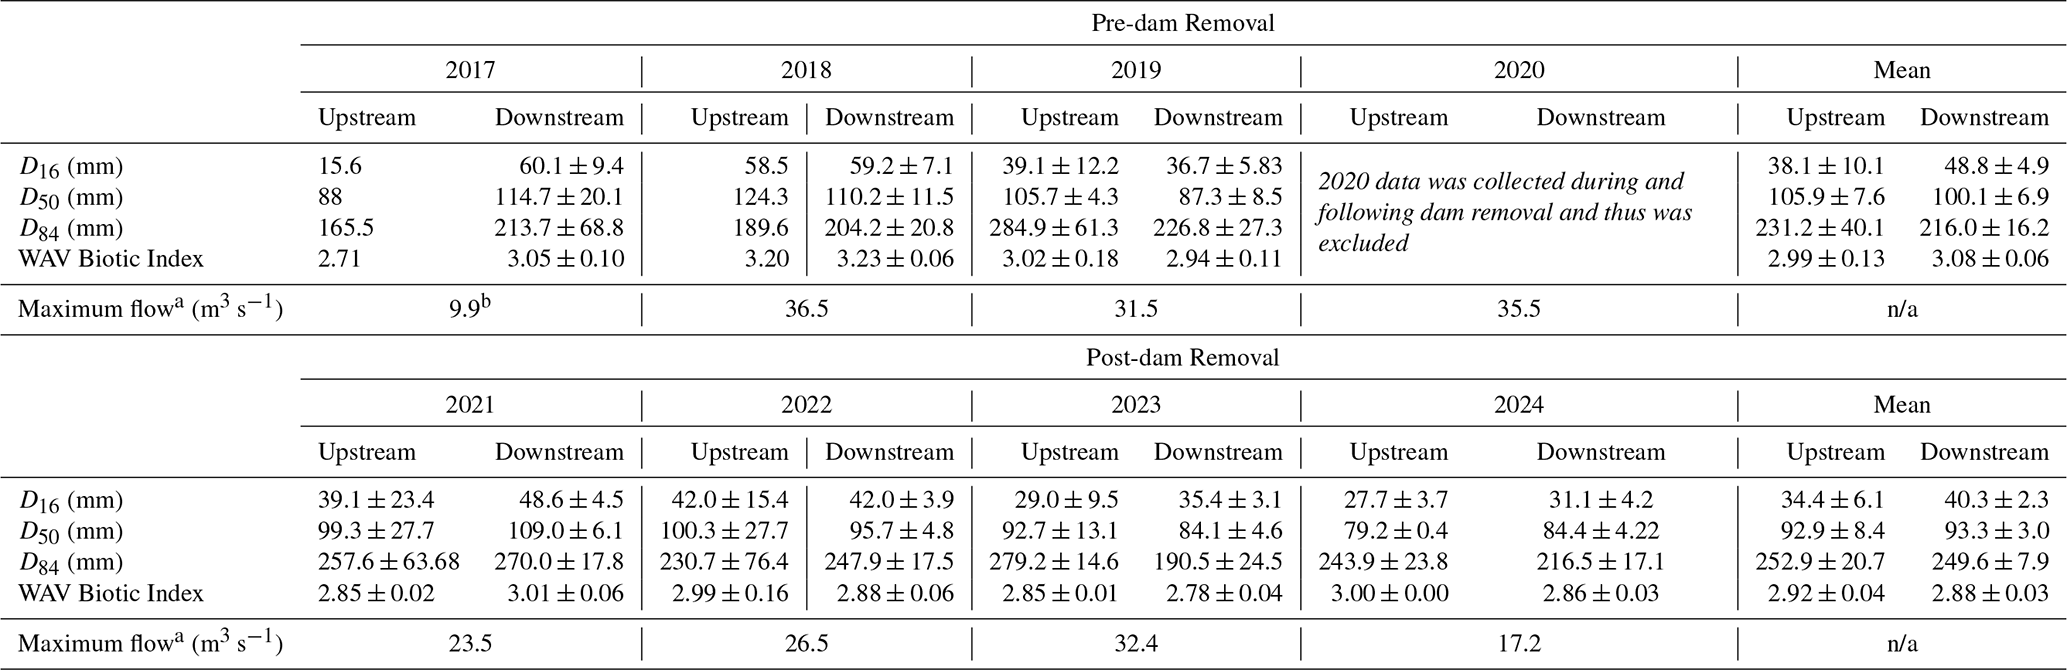
a Discharge data was collected from the Montana Division of Natural Resources gage on Rattlesnake Creek. b Discharge measurements began on 7 November 2017. n/a – not applicable
At the site immediately downstream of the dam, mean D16 grain sizes fined from the mean before dam removal (2017–2019; 55.1 ± 16.4 mm) to immediately after dam removal in October 2020 (26.9 mm; Fig. S6), though the D50 and D84 were not substantially different. However, compared to the year immediately prior to dam removal (2019; D16 = 22.5 mm), the post-removal measurement shows minor coarsening. The D50 and D84 showed no substantial trends at this site, and overall, we found no notable change in grain size downstream of the dam following dam removal across any site (Fig. S6).
Similarly, there was no notable difference in the WAV Biotic Index values before the dam removal between sites upstream (mean of 2.99 ± 0.13 and range of 2.71 to 3.20) and downstream (mean of 3.08 ± 0.06 and range of 2.33 to 3.50; Table 2, Figs. 3a and S7). Following dam removal, the index values remained similar between sites upstream (mean of 2.92 ± 0.04 and range of 2.83 to 3.14) and downstream (mean of 2.88 ± 0.03 and range of 2.57 to 3.25; Table 2; Figs. 3b and S7). The mean WAV Biotic Index scores upstream, downstream, before, and after dam removal were all within the “Good” threshold (2.5–3.5). Overall, there was no substantial difference in index values following the dam removal after accounting for differences between upstream and downstream reaches (Eq. 1; Table S2; −0.13 ± 0.15). Individual sites saw variation largely within the “Good” health threshold throughout the study period (2.5–3.5; WAV, 2015), and no prominent trends exist, including for the site immediately downstream of the dam (Fig. S8).
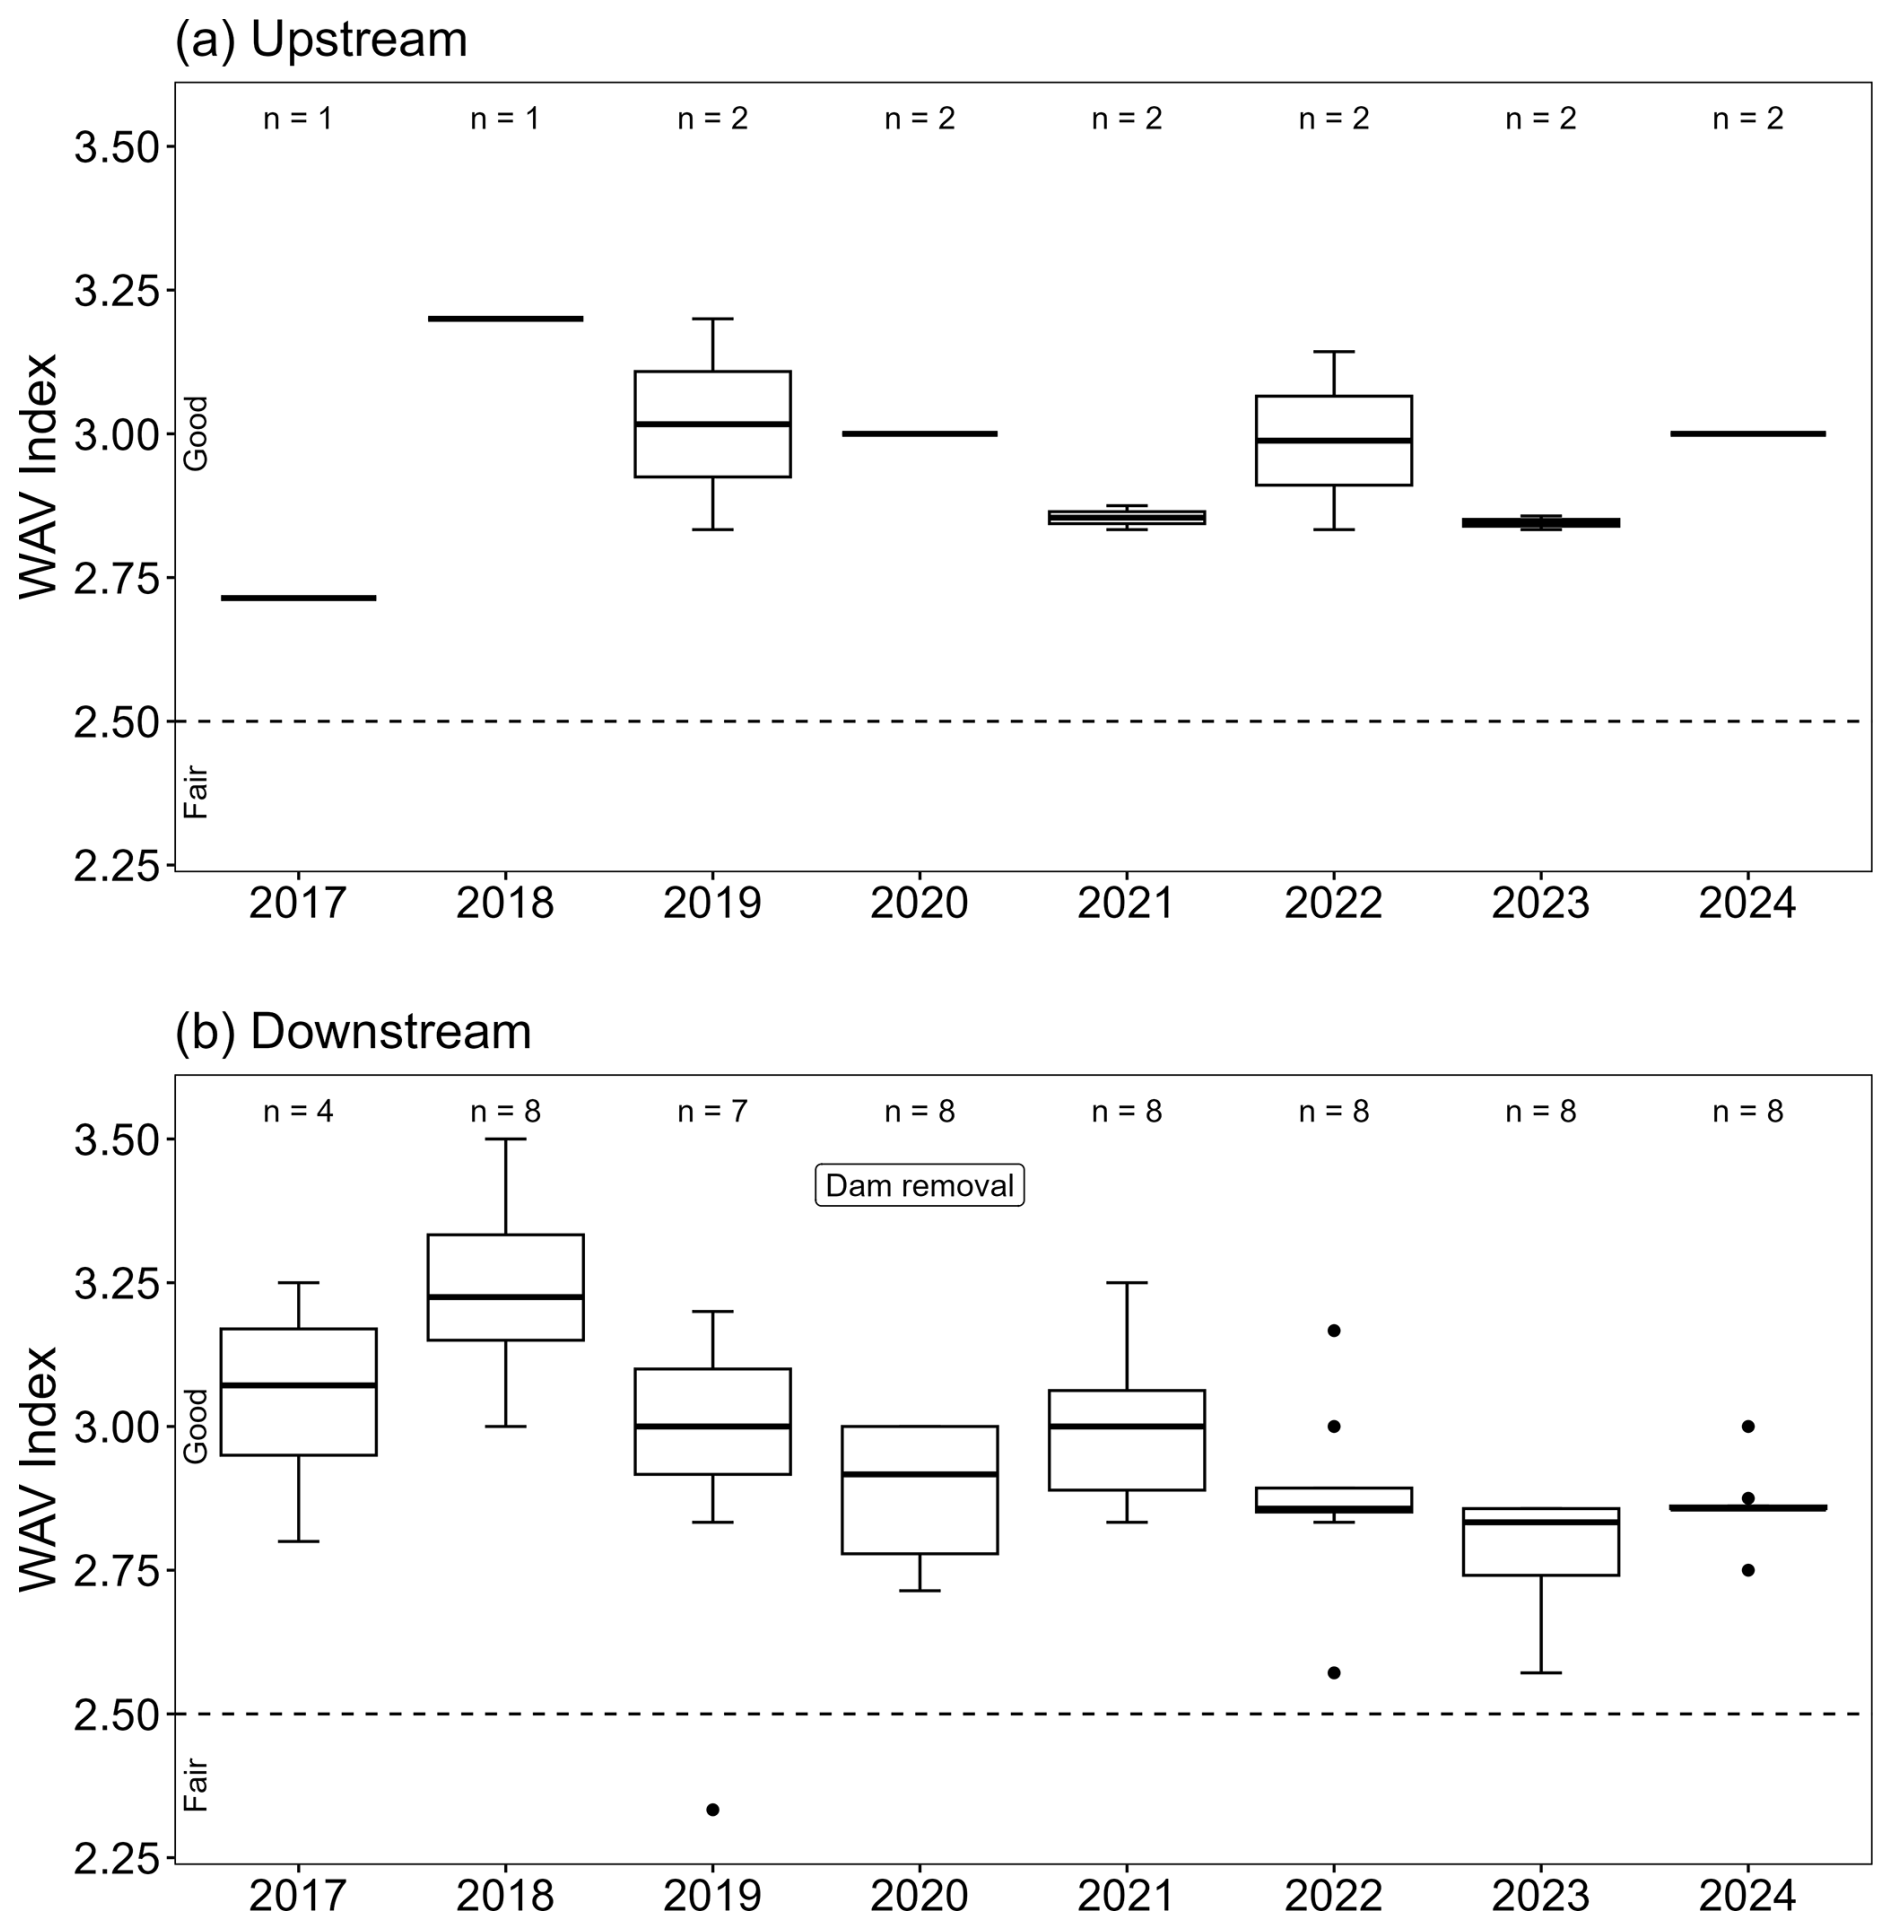
Figure 3WAV biotic index data from macroinvertebrate counts from 2017 to 2024. Top chart (a) shows WAV variations in reference sites 9 and 10, which are upstream of the dam. Bottom chart (b) shows WAV variations in comparison sites 1–8, downstream of the dam. The thick horizontal line through the box shows the median, the height of the box shows the interquartile range, the vertical lines represent 1.5 times the interquartile range, and the circles represent data points outside of 1.5 times the interquartile range. The number of observations for each year are indicated at the top of the plot. Dam removal occurred in 2020, and sites were sampled before, during, and after dam removal that year. Stream health thresholds defined by WAV are included with a horizontal dashed line.
5.1 Overall assessment of dam removal impacts
Our complete pebble count and macroinvertebrate data analysis results span three years before the dam removal to four years after and demonstrate no notable shifts in grain size, indicating that the removal of this dam on Rattlesnake Creek caused minimal impact on sediment distribution downstream. Similarly, macroinvertebrate diversity, frequently used as the biotic indicator of stream health, showed no discernible trend from before to after the dam removal. We attribute the lack of change and the similarity between upstream and downstream reaches prior to dam removal to two factors: first, the open sluice gates, and second, the lack of major discharge events following dam removal.
At the time of complete dam removal, the sluice gates had been open for eight years, analogous to a staged dam removal rather than a single-phase removal (Sawaske and Freyberg, 2012). Staged dam removal has been found to significantly reduce the volume of eroded sediment (Sawaske and Freyberg, 2012) and is often favored for this reason to mitigate sediment release (Foley et al., 2017). Strongly considering the role of the opening left behind from the removal of the sluice gates, the findings from our data suggest that the removal of a small dam with a large opening in the center does not impact sediment transport or aquatic macroinvertebrate populations on the scale of years. As evidenced by the lack of difference between upstream and downstream reaches prior to post dam removal, we interpret that the dam removal itself served as an ecological and geomorphic “non-event”, as the river was fully adjusted prior to the removal of the dam. As such, we argue that this multi-year “staged removal” was an effective management strategy to eliminate downstream ecological trauma.
Our results may support the two-phase dam removal response where initially large quantities of reservoir sediment are eroded, followed by slower erosion rates that are dependent on larger floods (Collins et al., 2017; East et al., 2018; Pearson et al., 2011). The first phase of this response may have occurred during the permanent opening of the sluice gates, and as such data collection before and after the sluice gate opening may have revealed some change in sediment transport and macroinvertebrate populations downstream. At the time of Stream Team surveying, it is possible that the river had already transitioned to the second “event-driven” phase (Pearson et al., 2011). During the study period, no significant flood events occurred. The discharge record from the MDNRC gaging station (Table 2) shows that the two years prior to dam removal had higher maximum flows than the two years that followed removal (∼ 32 m3 s−1 in May 2018 and ∼29 m3 s−1 in May 2019 versus ∼ 21 m3 s−1 in June 2021 and ∼ 25 m3 s−1 in June 2022), however the maximum flow in 2023 was much closer to that of 2018 (∼ 30 m3 s−1 in May 2023) and no significant flooding events occurred. In line with the two-phase model, interpreting the lack of change in sediment distribution requires considering the possibility that flows were insufficient after the dam removal to entrain and transport much sediment. This is consistent with the findings of Foley et al. (2017) with respect to both the occasional necessity of high flows to erode accumulated sediment and that most erosion occurs when a dam is breached instantaneously rather than in stages.
5.2 Effectiveness and community impact of citizen science stream monitoring
To address research question 2, “can citizen science projects effectively monitor local streams?”, we must consider the completeness and usability of the data collected by WEN volunteers. Stream Team citizen scientists include students, professionals, families, and retirees. Anecdotally, people love identifying the bugs, walking in the creek, and connecting with their environment (Deb Fassnacht, personal communication, 30 March 2025). For example, a volunteer said:
I love the camaraderie of the group, being in the stream together and trying to figure things out … … a great way for people to kinda fulfill childhood dreams of looking at bugs and counting rocks and it's going to matter for something. You get to learn about some sort of stream ecology and share it with friends. (WEN, 2026)
Indeed, the citizen science data collection protocol yielded eight consecutive years of data for pebble counts and aquatic macroinvertebrate taxa that were complete and viable for our analyses. For these datasets, this demonstrates the efficacy of citizen science endeavors for long-term stream monitoring.
While irregular variation from year to year may be due to user-dependent bias from mistakes in measuring and biased selection – which has been shown to increase as different observers collect data (Downs et al., 2021; Marcus et al., 1995) – this problem is also observed in data from professional scientists (Crall et al., 2011; Kosmala et al., 2016). Additional variation in the data may be attributed to the fact that Rattlesnake Creek, particularly the reaches within this study area, is heavily used for recreation. From children building rock piles to kayakers moving large pieces of wood, there is an unquantifiable human impact that must be considered with respect to both sediment transport and macroinvertebrates in this area.
We attribute the successful monitoring of pebble counts and aquatic macroinvertebrate populations to verification of the data in the field, well-designed field data entry sheets, and the relative simplicity of data collection. Both pebble counts and macroinvertebrate counts include working with a large team and routine verification, as well as collecting only tallies. Conversely, the cross-section dataset was incomplete due to missing field data, which is discussed further in Limitations. This missing data provides important insights into where to make improvements in the data collection and verification protocol, including ensuring field verification. Previous work confirms that successful data collection from citizen science projects includes effective planning, working in groups, and including quality assessment throughout the project (Crall et al., 2011; Downs et al., 2021).
Programs like Stream Team also give members of the community the chance to learn things, collect valuable data, and work without stress or a “traditional education” background knowledge requirement. For example, a volunteer said:
...it showed me that, “oh hey you can do science” it's not all organic chemistry, and it can be collecting data or doing these fun things in the stream. I think that's what it does for me… (WEN, 2026)
WEN's Stream Team program teaches people that science is approachable and helps them build camaraderie with like-minded people in their community, solving problems on the fly, and pointing out the wildlife, rocks, and bugs. Since Rattlesnake Creek is a popular recreational area, hikers are often walking by, and they love stopping and seeing what bugs Stream Team has found and ask what the volunteers are doing in the creek (Deb Fassnacht, personal communication, 30 March 2025). Volunteers, in turn, get the opportunity to share what they're doing and invite the hikers to join next time. Previous studies have similarly found that participating in citizen science is an effective way of introducing environmental science as something that is approachable and understandable (Ardoin et al., 2019; Bonney et al., 2015; Novacek, 2008).
To analyze the impacts of the dam removal, we had intended to compare upstream and downstream cross-sections over time, as these data would have given us insights on how the dam removal impacted the geomorphology of the stream (Magilligan et al., 2021). Unfortunately, cross-sectional data was not usable, as the dataset was incomplete in multiple ways. The two major missing data issues for the cross-sections were related to measurement locations and location labeling. Most water depth and bankfull data were recorded, but almost every dataset before 2021 was missing the measurement increments across the stream, making it impossible to discern where the elevation and water depths were taken. Prior to 2021, volunteers recorded numeric intervals rather than measurements across the stream (for example, channel widths from year to year could be divided into 20–50 increments without noting the length of those increments). Proper datasheet set-up could have rendered more complete datasets (e.g. including specific quantitative increments across the stream channel). Additionally, for each site, the protocol requires the measurement of two cross-sections: one upstream and one downstream, marking the boundaries for all other data collection. Unfortunately, though datasheets provide evidence that two cross sections were measured, identification of which cross-section was upstream and which was downstream was frequently not recorded, making year-to-year comparisons between them impossible.
Data consistency was also limited because both physical and digital datasheets varied with revisions as both Stream Team coordinators and the volunteers changed over time. Fundamentally, and specifically for the cross-section data, a lack of in-situ verification of complete data collection and accurate data recording before leaving the site at the end of Stream Team field days led to these missing data.
We found no evidence of a change in stream sediment size or macroinvertebrate diversity following the removal of the Rattlesnake Creek dam. We believe there are many contributing factors to this lack of change, emphasizing the unimpeded flow through the open sluice gates for eight years prior to dam removal and the lack of major flood events following dam removal, as well as the ongoing recreation activities in the stream. We do not attribute the lack of change in these variables to a lack of quality of the citizen scientist–collected data of sediment size or macroinvertebrates.
Citizen science data that was collected consistently over time was helpful for monitoring the stream when it was recorded completely and correctly, which was the case for most (e.g., sediment size and macroinvertebrates), but not all (e.g., cross-sections), datasets. Based on the extensive data compilation and cleaning prior to analysis, we have identified four “best practices” for improving citizen science data collection for use in scientific analysis: (1) ensure everything that needs to be recorded has a place in the datasheet for recording it and verify that the data has been collected before leaving the field; (2) design digital datasheets that make it clear where data needs to be entered and makes it easy to do so for volunteers; (3) keep data in one column or row for the same data (i.e. keep all pebble count measurements in one column); (4) create an easy-to-access location for the data, such as a summary page, where the data can be read by a coding language to do the analysis. At the time of publication, WEN is developing an app with Aelid Development Inc. that will be used to record site visit data on tablets including required entry fields. The app will be designed to address data entry and quality concerns by mitigating data loss that can occur in the field and during transfer from field notes to spreadsheet.
Finally, future work should include an examination of the completeness of the data not analyzed in this study, which includes all the stream chemistry measurements, temperature, velocity, and turbidity.
Quarto R files for the analysis and plotting of this data are available at https://doi.org/10.6084/m9.figshare.30758267 (Blakey, 2026).
The citizen science data that supports this research are online at https://doi.org/10.6084/m9.figshare.30752828 (Blakey et al., 2025).
The supplement related to this article is available online at https://doi.org/10.5194/gc-9-401-2026-supplement.
BB, in collaboration with WEN, conceived the experiment and designed the research protocol for this study. The manuscript was written by NB and BB. BB created the figures. BB and NB discussed the results and manuscript narrative as well as contributed to the editing process.
The contact author has declared that neither of the authors has any competing interests.
This study did not involve human-subject research as it involved the examination of empirical data collected by citizen scientists; therefore, formal ethical approval was not required. All anecdotal statements from citizen scientists were previously published and contributed voluntarily to the Watershed Education Network.
Publisher's note: Copernicus Publications remains neutral with regard to jurisdictional claims made in the text, published maps, institutional affiliations, or any other geographical representation in this paper. The authors bear the ultimate responsibility for providing appropriate place names. Views expressed in the text are those of the authors and do not necessarily reflect the views of the publisher.
This article is part of the special issue “Citizen science and co-creating with communities”. It is a result of the the EGU General Assembly 2025, Session ITS3.2/EOS1.9 “Citizen Science and Co-creating with Communities”, Vienna, Austria, 27 April–2 May 2025.
The authors would like to acknowledge the staff, volunteers, and colleagues from the Watershed Education Network for their time and generosity in collecting and sharing this data, especially Stephie Novak and Deb Fassnacht. We would also like to thank Ben Colman, Frederick Peck, and Andrew Wilcox for their assistance with data analysis and discussion. The data analyzed in this study could not have been collected without the many supporters of the Watershed Education Network's Citizen Science Stream Team, including: a grant from the Resources Legacy Fund (a Program of Open Rivers Fund, funded by William and Flora Hewlett Foundation), Westslope Chapter Trout Unlimited, City of Missoula Public Works, The Cinnabar Foundation, Parkside Credit Union, and many other local contributors and partners. Lastly, we would like to thank the reviewers and editors whose constructive feedback resulted in a stronger final manuscript.
This paper was edited by Sarath Guttikunda and reviewed by two anonymous referees.
Abbott, K. M., Zaidel, P. A., Roy, A. H., Houle, K. M., and Nislow, K. H.: Investigating impacts of small dams and dam removal on dissolved oxygen in streams, PLoS ONE, 17, e0277647, https://doi.org/10.1371/journal.pone.0277647, 2022.
Aceves-Bueno, E., Adeleye, A. S., Feraud, M., Huang, Y., Tao, M., Yang, Y., and Anderson, S. E.: The Accuracy of Citizen Science Data: A Quantitative review, Bull. Ecol. Soc. Am., 98, 278–290, https://doi.org/10.1002/bes2.1336, 2017.
Ardoin, N. M., Bowers, A. W., and Gaillard, E.: Environmental education outcomes for conservation: A systematic review, Biol. Conserv., 241, 108224, https://doi.org/10.1016/j.biocon.2019.108224, 2019.
Bellmore, J. R., Duda, J. J., Craig, L. S., Greene, S. L., Torgersen, C. E., Collins, M. J., and Vittum, K.: Status and trends of dam removal research in the United States, WIREs Water, 4, https://doi.org/10.1002/wat2.1164, 2016.
Birnie-Gauvin K., Candee M. M., Baktoft H., Larsen M. H., Koed A., Aarestrup K:. River connectivity reestablished: Effects and implications of six weir removals on brown trout smolt migration, River Res. Applic., 34, 548–554, https://doi.org/10.1002/rra.3271, 2018.
Blake, C. and Rhanor, A.: The impact of channelization on macroinvertebrate bioindicators in small order Illinois streams: insights from long-term citizen science research, Aquat. Sci., 82, https://doi.org/10.1007/s00027-020-0706-4, 2020.
Blakey, B.: Restoring Rattlesnake Creek: Using Citizen Science to Assess the Ecological and Morphological Impacts of Dam Removal in Western Montana, Scholarworks at University of Montana, https://scholarworks.umt.edu/utpp/565/ (last access: 13 July 2026), 2025.
Blakey, B.: Code for cleaning, analyzing, and plotting pebble count and macroinvertebrate count data from citizen science surveys, figshare [code], https://doi.org/10.6084/m9.figshare.30758267, 2026.
Blakey, B., Fassnacht, D., and Novak, S.: Pebble count and macroinvertebrate count data from Watershed Education Network citizen science surveys in Missoula, Montana, USA, figshare [data set], https://doi.org/10.6084/m9.figshare.30752828, 2025.
Bonney, R., Phillips, T. B., Ballard, H. L., and Enck, J. W.: Can citizen science enhance public understanding of science?, Public Underst. Sci., 25, 2–16, https://doi.org/10.1177/0963662515607406, 2015.
Brewitt, P. K. and Colwyn, C. L. M.: Little dams, big problems: The legal and policy issues of nonjurisdictional dams, Wires Water, 7, e1393, https://doi.org/10.1002/wat2.1393, 2019.
Chiu, M. C., Yeh, C. H., Sun, Y. H., and Kuo, M. H.: Short-term effects of dam removal on macroinvertebrates in a Taiwan stream, Aquat. Ecol., 47, 245–252.36, https://doi.org/10.1007/s10452-013-9439-y, 2013.
Church, S. P., Payne, L. B., Peel, S., and Prokopy, L. S.: Beyond water data: benefits to volunteers and to local water from a citizen science program, J. Environ. Plan. Manage., 62, 306–326, https://doi.org/10.1080/09640568.2017.1415869, 2019.
Collins, M. J., Snyder, N. P., Boardman, G., Banks, W. S., Andrews, M., Baker, M. E., Conlon, M., Gellis, A., McClain, S., Miller, A., and Wilcock, P.: Channel response to sediment release: insights from a paired analysis of dam removal, Earth Surf. Proc. Land., 42, 1636–1651, https://doi.org/10.1002/esp.4108, 2017.
Conner, M. M., Saunders, W. C., Bouwes, N., and Jordan, C.: Evaluating impacts using a baci design, ratios, and a Bayesian approach with a focus on restoration, Environ. Monit. Assess., 188, https://doi.org/10.1007/s10661-016-5526-6, 2016.
Crall, A., Newman, G., Stohlgren, T., Holfelder, K., and Graham, J.: Assessing citizen science data quality: an invasive species case study, Cons. Lett., 4, 433–442, https://doi.org/10.1111/j.1755-263x.2011.00196.x, 2011.
Deacon, C., Govender, S., and Samways, M. J.: Overcoming biases and identifying opportunities for citizen science to contribute more to global macroinvertebrate conservation, Biodivers. Conserv., 32, 1789–1806, https://doi.org/10.1007/s10531-023-02595-x, 2023.
Ding, L., Chen, L., Ding, C., and Tao, J.: Global Trends in Dam Removal and Related Research: A systematic review based on associated datasets and bibliometric analysis, Chinese Geogr. Sci., 29, 1–12, https://doi.org/10.1007/s11769-018-1009-8, 2019.
Downs, R., Ramapriyan, H., Peng, G., and Wei, Y.: Perspectives on Citizen Science Data Quality, Front. Clim, 3, https://doi.org/10.3389/fclim.2021.615032, 2021.
Duda, J. J. and Bellmore, J. R. Dam removal and river restoration, in: Encyclopedia of Inland Waters, edited by: Mehner, T. and Tockner, K., 2nd Edn., Elsevier, 576–585, https://doi.org/10.1016/b978-0-12-819166-8.00101-8, 2022.
East, A. E., Logan, J. B., Mastin, M. C., Ritchie, A. C., Bountry, J. A., Magirl, C. S., and Sankey, J. B.: Geomorphic evolution of a gravel-bed river under sediment-starved versus sediment-rich conditions: River response to the world's largest dam removal, J. Geophys. Res.-Earth, 123, 3338–3369, https://doi.org/10.1029/2018JF004703, 2018.
Engage Missoula: Rattlesnake Wilderness Dams, https://www.engagemissoula.com/rattlesnake-wilderness-dams, last access: 15 July 2026.
Foley, M. M., Bellmore, J. R., O'Connor, J. E., Duda, J. J., East, A. E., Grant, G. E., Anderson, C. W., Bountry, J. A., Collins, M. J., Connolly, P. J., Craig, L. S., Evans, J. E., Greene, S. L., Magilligan, F. J., Magirl, C. S., Major, J. J., Pess, G. R., Randle, T. J., Shafroth, P. B., Torgersen, C. E., Tullos, D., and Wilcox, A. C.: Dam removal: Listening in, Water Resour. Res., 53, 5229–5246, https://doi.org/10.1002/2017wr020457, 2017.
Frigerio, D., Richter, A., Per, E., Pruse, B., and Vohland, K.: Citizen Science in the Natural Sciences, in: The Science of Citizen Science, Springer, Cham, 79–96, https://doi.org/10.1007/978-3-030-58278-4_5, 2021.
Hart, D. D., Johnson, T. E., Bushaw-Newton, K. L., Horwitz, R. J., Bednarek, A. T., Charles, D. F., Kreeger, D. A., and Velinsky, D. J.: Dam Removal: Challenges and Opportunities for Ecological Research and River Restoration, BioScience, 52, 669–682, https://doi.org/10.1641/0006-3568(2002)052[0669:DRCAOF]2.0.CO;2, 2002.
Kibler, K., Tullos, D., and Kondolf, M.: Evolving Expectations of Dam Removal Outcomes: Downstream Geomorphic Effects Following Removal of a Small, Gravel‐Filled Dam, JAWRA J. Am. Water Resour. Assoc., 47, 408–423, https://doi.org/10.1111/j.1752-1688.2011.00523.x, 2011.
Kosmala, M., Wiggins, A., Swanson, A., and Simmons, B.: Assessing data quality in citizen science, Front. Ecol. Environ., 14, 551–560, https://doi.org/10.1002/fee.1436, 2016.
Lu, Y., Zhu, W.-Y., Liu, Q.-Y., Li, Y., Tian, H.-W., Cheng, B.-X., Zhang, Z.-Y., Wu, Z.-H., Qing, J., Sun, G., and Yan, X.: Impact of low-head dam removal on river morphology and habitat suitability in mountainous rivers, Int. J. Environ. Res. Publ. Hlth., 19, 11743, https://doi.org/10.3390/ijerph191811743, 2022.
Magilligan, F. J., Nislow, K. H., Dietrich, J. T., Doyle, H., and Kynard, B.: Transient versus sustained biophysical responses to dam removal, Geomorphology, 389, 107836, https://doi.org/10.1016/j.geomorph.2021.107836, 2021.
Mahan, D. C., Betts, J. T., Nord, E., Van Dyke, F., and Outcalt, J. M.: Response of benthic macroinvertebrates to dam removal in the restoration of the Boardman River, Michigan, USA, PLoS ONE, 16, e0245030, https://doi.org/10.1371/journal.pone.0245030, 2021.
Maloney, K. O., Dodd, H. R., Butler, S. E., and Wahl, D. H.: Changes in macroinvertebrate and fish assemblages in a medium‐sized river following a breach of a low‐head dam, Freshw. Biol., 53, 1055–1068, https://doi.org/10.1111/j.1365-2427.2008.01956.x, 2008.
Marcus, W. A., Ladd, S. C., Stoughton, J. A., and Stock, J. W.: Pebble counts and the role of user‐dependent bias in documenting sediment size distributions, Water Resour. Res., 31, 2625–2631, https://doi.org/10.1029/95WR02171, 1995.
Novacek, M. J.: Engaging the public in biodiversity issues, Proc. Natl. Acad. Sci., 105, 11571–11578, https://doi.org/10.1073/pnas.0802599105, 2008.
Orr, C. H., Kroiss, S. J., Rogers, K. L., and Stanley, E. H.: Downstream benthic responses to small dam removal in a coldwater stream, River Res. Appl., 24, 804-822, https://doi.org/10.1002/rra.1084, 2008.
Pearson, A. J., Snyder, N. P., and Collins, M. J.: Rates and process of channel response to dam removal with a sand-filled impoundment, Water Resour. Res., 47, W08504, https://doi.org/10.1029/2010WR009733, 2011.
Potyondy, J. P. and Hardy, T.: Use of pebble counts to evaluate fine sediment increase in stream channels, J. Am. Water Resour. Assoc., 30, 509–520, https://doi.org/10.1111/j.1752-1688.1994.tb03309.x, 1994.
Rice, W. L. and Armatas, C. A.: Answering the dam question: visitor perspectives on removing and maintaining dams in wilderness, Int. J. Wilderness, 30, 40–53, 2024.
Rubio-Iglesias, J. M., Edovald, T., Grew, R., Kark., T., Kideys, A. E., Peltola, T., and Volten, H.: Citizen Science and Environmental Protection Agencies: Engaging Citizens to Address Key Environmental Challenges, Front. Clim., 2, https://doi.org/10.3389/fclim.2020.600998, 2020.
Sawaske, S. R. and Freyberg, D. L.: A comparison of past small dam removals in highly sediment-impacted systems in the US, Geomorphology, 151, 50–58, https://doi.org/10.1016/j.geomorph.2012.01.013, 2012.
Smith, E. P.: BACI Design, Encyclopedia of Environmetrics, 1, 141–148, 2002.
Specht, H. and Lewandowski, E.: Biased Assumptions and Oversimplifications in Evaluations of Citizen Science Data Quality, Bull. Ecol. Soc. Am., 99, 251–256, https://doi.org/10.1002/bes2.1388, 2018.
Stewart-Oaten, A., Murdoch, W. W., and Parker, K. R.: Environmental impact assessment: “pseudoreplication” in time?, Ecology, 67, 929–940, https://doi.org/10.2307/1939815, 1986.
Tonitto, C. and Riha, S. J.: Planning and implementing small dam removals: lessons learned from dam removals across the eastern United States, Sustain. Water Resour. Manage., 2, 489–507, https://doi.org/10.1007/s40899-016-0062-7, 2016.
Trout Unlimited (TU), Watershed Education Network (WEN), Montana Fish, Wildlife and Parks Fisheries Division (MFWP): Rattlesnake Dam Removal Monitoring Report, https://www.montanawatershed.org/resources (last access: 10 March 2025), 2021.
Tullos, D. D., Finn, D. S., and Walter, C.: Geomorphic and Ecological Disturbance and Recovery from Two Small Dams and Their Removal, PLoS ONE, 9, e108091, https://doi.org/10.1371/journal.pone.0108091, 2014.
U.S. Geological Survey (USGS): The StreamStats program, https://streamstats.usgs.gov/ss/ (last access: 10 March 2025), 2019.
Water Action Volunteers (WAV): Water Action Volunteers – Volunteer Stream Monitoring Factsheet Series: Macroinvertebrate Biotic Index, https://wateractionvolunteers.org/what-exactly-does-a-biotic-index-measure/ (last access: 20 April 2026), 2015.
Watershed Education Network (WEN): Welcome to citizen science, https://www.montanawatershed.org/, last access: 26 March 2025.
Watershed Education Network (WEN): Hear from our stream team volunteers, https://www.montanawatershed.org/streamteaminterviews, last access: 14 April 2026.
Wolman, M. G.: A method of sampling coarse river‐bed material, EOS, Trans. Am. Geophys. Union, 35, 951–956, 1954.