the Creative Commons Attribution 4.0 License.
the Creative Commons Attribution 4.0 License.
 | 21 Feb 2023
GC Insights: Nature stripes for raising engagement with biodiversity loss
Miles Richardson
Globally, there has been a stark decline in biodiversity since 1970, yet climate change receives far greater attention. The “warming stripes” have shown the power of very simple graphical visualisations of data for communicating with broad audiences. The “nature stripes” show how biodiversity data can also be presented in a similar way for a positive effect.
- Article
(679 KB) - Full-text XML
-
Supplement
(354 KB) - BibTeX
- EndNote


The climate and biodiversity crises are interlinked with transformational change required. However, biodiversity loss receives up to eight times less media coverage than climate change (Legagneux et al., 2018). The public need to be aware of the problems and be willing participants in enacting the solutions. Intergovernmental science–policy initiatives to resolve these two environmental crises are insufficient without public awareness, because policy decisions are closely related to awareness of the issues by the public (McCombs and Shaw, 1972). There is therefore a clear need to inform a wider audience about biodiversity loss.
The imbalance between attention given to climate warming and biodiversity loss is potentially surprising as there is a sense that many people love the natural world. In the UK and beyond, people enjoy art and poetry that considers nature, many cherish naturalists and enjoy nature documentaries, and millions of people are members of nature conservation organisations. Yet nature is in decline.
Climate change differs through being structurally global, whereas global data for biodiversity loss must be aggregated across many species and populations (Moran and Kanemoto, 2017), and there are differences in how climate and biodiversity are monitored (O'Conner et al., 2020). Emergent data suggest that the Earth is entering a mass extinction (Ceballos et al., 2015), with others noting population declines, rather than species loss, above natural variations (Briggs, 2017). It is perhaps the case that the costs and effects of climate change are more visible through the impact on local weather patterns. Whereas the loss of wildlife, even when local, can be imperceptible, baselines shift in such a way that each generation has a new norm (Soga and Gaston, 2018). It has also been suggested that biodiversity researchers have invested less effort in promoting their findings (Legagneux et al., 2018), although the comparative lack of media interest also makes this more difficult.
Professor Ed Hawkins at the University of Reading created the “warming stripes” in 2018. A series of coloured vertical bars shows how the planet has warmed over 200 years. In the first week alone, warming stripes were downloaded by over a million people from the website (https://showyourstripes.info, last access: 7 October 2022). The warming stripes have been shared widely, increasing the awareness of climate change by being simple and adaptable.
Effective communication of geoscience issues such as biodiversity loss present an enormous challenge and there is a need to create and share ideas (Hawkins et al., 2019). In that spirit and responding to Legagneux's call to focus on public and media awareness of biodiversity through conveying accurate and well-structured information, this short paper shares the “nature stripes” as a communication engagement tool and considers some reasons for their emerging success.
Conveying accurate information on biodiversity over time requires a suitable dataset. Biodiversity is widely understood at the species level, and the Living Planet Index (LPI; LPI, 2022) is a multi-species indicator based on mean levels of the population abundance of vertebrate species around the world for 1970–2016. The LPI is closely linked to ecosystem function and ecological process and measures trends in species abundance. The LPI is constructed from time-series population indicators and the global data are aggregated from over 20 000 populations of more than 4000 species. The LPI reveals an average drop of 68 % in the population of mammals, birds, fish, amphibians, and reptiles since 1970. Given the complexities of biodiversity measurement, the LPI can be misrepresented by the popular media. However, it provides an important tool in communicating biodiversity trends, such as in the high-profile Living Planet Report (WWF, 2020) and associated communications (WWF, 2022). Combined with powerful graphical representations, the data can capture attention and drive action around biodiversity loss.
To create the stripes, conditional formatting of the LPI data allows each data point to be assigned a colour. The choice of colours is critical to ensure that the graphic is as intuitive as possible, as with the blues and reds used in the warming stripes. Since biodiversity and nature is commonly depicted by the colour green, the 1970 LPI of “1” was represented by a vibrant green. Since the decline of wildlife can be seen as a loss of colour, the lowest LPI figure was represented by grey. A mid-point value in the data was represented by yellow, the most eye-catching colour (Crameri et al., 2020), which is harmonious with green and a combination preferred by users (Weingerl and Javoršek, 2018). The colour selection also avoids the problematic red–green and rainbow colour maps (Crameri et al., 2020). The declining trend in the LPI was therefore captured by a transition from green to yellow and then from yellow to grey, as depicted in the striped bars in Fig. 1.
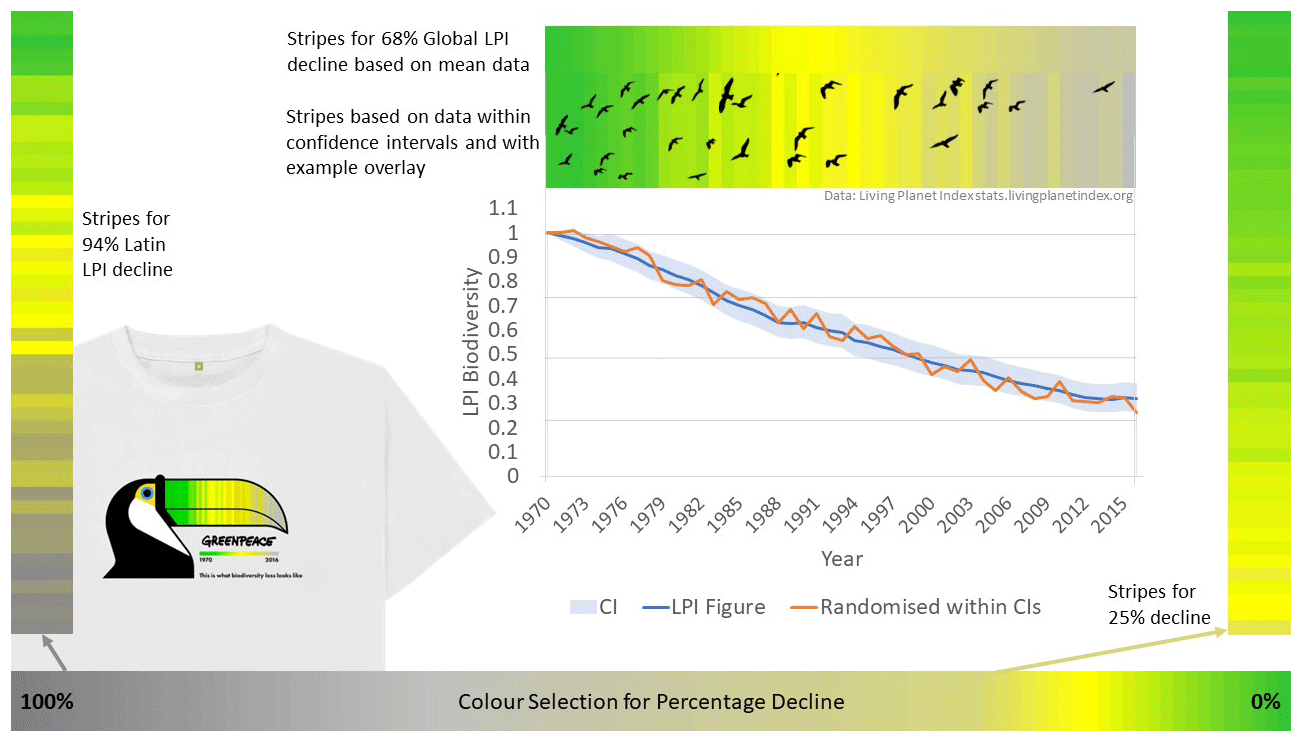
Figure 1LPI mean and “striped” data in traditional line-chart form and represented with stripes, together with overlay, colour-selection map examples, and use on a Greenpeace T-shirt (© Greenpeace/teemill).
However, given the fact that the LPI is a single value representing many species globally, the decline since 1970 is smooth. The colour changes are too subtle for clear stripes to emerge as depicted by the smooth bar in Fig. 1. In order to capture the trend and produce stripes, the high and low confidence intervals for each year were used to calculate a random point using a formula in MS Excel (see Supplement). To allow differing levels of decline to be represented, a protocol and colour map are used to ensure that higher levels of decline use a darker grey, with low levels of decline only reaching yellow (see Fig. 1).
The creation of artificial variability within the confidence intervals is openly acknowledged. However, it is reiterated that the nature stripes are intended to be a communication and public engagement tool to motivate action on the acknowledged, yet underreported issue of biodiversity loss, rather than a visualisation of the data for further analysis. The stripes engage people with the overall declining trend in biodiversity over time. The random variability also means stripes for the same data can differ however, once again as a communication rather than analysis tool; replication is not a significant issue.
Although such striped graphics alone have proven to be successful, science communication must also make people care. To do so, there is a need to go beyond facts to creating emotional connections by telling stories (Joubert et al., 2019); this can be seen as facts wrapped in emotions (Olson, 2009). Stories provide a powerful way to engage people with science and help them to understand it (Dahstrom, 2014; ElShafie, 2018). Within this context, imagery can be combined with the stripes to add meaning, emotion, and help to tell a story. Or, as shown in Fig. 1, the stripes can be combined with iconic and colourful species, such as the toucan or flocks of birds. There are many opportunities to use the nature stripes to prompt emotions, trigger meaning, and tell a story (see https://biodiversitystripes.info/, last access: 2 February 2023). This opportunity was soon spotted by Greenpeace (2022), as shown in Fig. 1, and Nature4Climate (2022). Nature4Climate, comprising 16 international environmental and civil society groups, used the stripes to announce a global effort to raise the profile of protecting and restoring ecosystems in the nature zones at both COP27 and COP15.
Sadly, climate warming and biodiversity loss face a battle for attention against well-funded opposition. This takes place in a modern world of decreasing attention spans combined with a myriad of fast-paced options (van de Sand et al., 2020). Several high-profile users of the warming stripes have reported that the graphic stopped them from “scrolling” through their social media feeds. Environmental scientists and nature conservation organisations must learn the power of meaning and emotion that those engaging consumers have been using for decades (Holbrook and Hirschman, 1982), often contributing to the environmental challenges we face today.
The original warming stripes, biodiversity stripes, or nature stripes (using more familiar terminology), meet many of the principles of effective data visualisation (Midway, 2020). The core information to be conveyed was identified and represented in a different form, using colour, which always adds meaning while retaining simplicity. Collaboration with artists adds an opportunity for sharing further stories about nature and the human relationship with it.
Using the stripes concept with alternative datasets also allows messages to be modified for particular audiences. The LPI database includes several continental regions and groups of species, for example, freshwater species where the stripes can be coloured from blue to grey. Alternative data sources should allow stripes that focus on the biodiversity of specific nations, regions, and stripes for a variety of species, from insects to birds. The stripes concept can also be used to represent the declining use of nature words in cultural products (Kesebir and Kesebir, 2017).
The story told by the nature stripes engages people and can help them to care about the loss of wildlife and loss of colour in the world. This matters since organisations such as the UN and the Intergovernmental Science–Policy Platform on Biodiversity and Ecosystem Services (IPBES) recognise that the failing human relationship with nature is an underlying cause of the environmental crises. Compassion and care for nature are a pathway to rebuild the human–nature relationship (Lumber et al., 2017; Richardson et al., 2020). The nature stripes can potentially connect people with these issues so that they start to care for nature and begin to green the grey.
Living Planet Index is available from https://stats.livingplanetindex.org/latest_results (LPI, 2022). Note that products derived from LPI data for financial gain are prohibited without written permission of ZSL and WWF.
The supplement related to this article is available online at: https://doi.org/10.5194/gc-6-11-2023-supplement.
The author has declared that there are no competing interests.
Ethical clearance not required for data visualisation using publicly available data.
Publisher’s note: Copernicus Publications remains neutral with regard to jurisdictional claims in published maps and institutional affiliations.
The author would like to thank Ed Hawkins for support in creating the nature stripes and comments on a draft version of the paper.
This paper was edited by Mathew Stiller-Reeve and reviewed by two anonymous referees.
Briggs, J.: Emergence of a sixth mass extinction?, Biol. J. Linn. Soc., 122, 243–248, https://doi.org/10.1093/biolinnean/blx063, 2017.
Ceballos, G., Ehrlich, P., Barnosky, A., García, A., Pringle, R., and Palmer, T.: Accelerated modern human–induced species losses: Entering the sixth mass extinction, Sci. Adv., 1, https://doi.org/10.1126/sciadv.1400253, 2015.
Crameri, F., Shephard, G. E., and Heron, P. J.: The misuse of colour in science communication, Nat. Commun., 11, 1–10, 2020.
Dahlstrom, M.: Using narratives and storytelling to communicate science with nonexpert audiences, P. Natl. Acad. Sci. USA, 111, 13614–13620, https://doi.org/10.1073/pnas.1320645111, 2014.
ElShafie, S.: Making Science Meaningful for Broad Audiences through Stories, Integr. Comp. Biol., 58, 1213–1223, https://doi.org/10.1093/icb/icy103, 2018.
Greenpeace: https://greenpeaceshop.co.uk/product/toucan-t-shirt/, last access: 7 September 2022.
Hawkins, E., Fæhn, T., and Fuglestvedt, J.: The Climate Spiral Demonstrates the Power of Sharing Creative Ideas, B. Am. Metrol. Soc, 100, 753–756, https://doi.org/10.1175/bams-d-18-0228.1, 2019.
Holbrook, M. and Hirschman, E.: The Experiential Aspects of Consumption: Consumer Fantasies, Feelings, and Fun, J. Consum. Res., 9, 132, https://doi.org/10.1086/208906, 1982.
Joubert, M., Davis, L., and Metcalfe, J.: Storytelling: the soul of science communication, J. Sci. Commun., 18, https://doi.org/10.22323/2.18050501, 2019.
Kesebir, S. and Kesebir, P.: A Growing Disconnection From Nature Is Evident in Cultural Products, Perspect. Psychol. Sci, 12, 258–269, https://doi.org/10.1177/1745691616662473, 2017.
Legagneux, P., Casajus, N., Cazelles, K., Chevallier, C., Chevrinais, M., Guéry, L., Jacquet, C., Jaffré, M., Naud, M., Noisette, F., Ropars, P., Vissault, S., Archambault, P., Bêty, J., Berteaux, D., and Gravel, D.: Our House Is Burning: Discrepancy in Climate Change vs. Biodiversity Coverage in the Media as Compared to Scientific Literature, Front. Ecol. Evol., 5, https://doi.org/10.3389/fevo.2017.00175, 2018.
LPI (Living Planet Index): Latest results, WWF [data set], https://stats.livingplanetindex.org/latest_results, last access: 8 August 2022.
Lumber, R., Richardson, M., and Sheffield, D.: Beyond knowing nature: Contact, emotion, compassion, meaning, and beauty are pathways to nature connection, PLOS ONE, 12, e0177186, https://doi.org/10.1371/journal.pone.0177186, 2017.
McCombs, M. and Shaw, D.: The Agenda-Setting Function of Mass Media, Public Opin. Quart., 36, 176, https://doi.org/10.1086/267990, 1972.
Midway, S.: Principles of Effective Data Visualization, Patterns, 1, 100141, https://doi.org/10.1016/j.patter.2020.100141, 2020.
Moran, D. and Kanemoto, K.: Identifying species threat hotspots from global supply chains, Nat. Ecol. Evol., 1, 0023, https://doi.org/10.1038/s41559-016-0023, 2017.
Nature4Climate: GOOD NEWS ALERT: 16 of the biggest civil society groups in the nature, climate and environment sectors have come together to bring nature's voices to the heart of #COP27, Twitter, https://twitter.com/Nature4Climate/status/1573335740305530883?s=20&t=2xqWf85mSnb9BbcF0q2q5g (last access: 23 September 2022), posted: 05:37 p.m., 23 September 2022.
O'Connor, B., Bojinski, S., Röösli, C., and Schaepman, M. E.: Monitoring global changes in biodiversity and climate essential as ecological crisis intensifies, Ecol. Inform., 1, 101033, https://doi.org/10.1016/j.ecoinf.2019.101033, 2020.
Olson, R.: Don't be such a scientist: talking substance in an age of style, Island Press, Washington, DC, USA, ISBN 1597265632, 2009.
Richardson, M., Dobson, J., Abson, D., Lumber, R., Hunt, A., Young, R., and Moorhouse, B.: Applying the pathways to nature connectedness at a societal scale: a leverage points perspective, Ecosystems and People, 16, 387–401, https://doi.org/10.1080/26395916.2020.1844296, 2020.
Soga, M. and Gaston, K.: Shifting baseline syndrome: causes, consequences, and implications, Front. Ecology. Env., 16, 222–230, https://doi.org/10.1002/fee.1794, 2018.
van de Sand, F., Frison, A., Zotz, P., Riener, A., and Holl, K.: The Battle for Attention, in: User Experience Is Brand Experience, Springer International Publishing, Cham., ISBN 3030298671, 2020.
Weingerl, P. and Javoršek, D.: Theory of colour harmony and its application, Tehnički vjesnik, 25, 1243–1248, 2018.
WWF Living Planet Report 2020: Bending the curve of biodiversity loss, edited by: Almond, R. E. A., Grooten, M., and Petersen, T., WWF, Gland, Switzerland, https://wwfin.awsassets.panda.org/downloads/lpr_2020_full_report.pdf (last access: 20 February 2023), 2020.
WWF Living Planet Report 2022: https://livingplanet.panda.org/en-gb/, last access: 17 February 2022.
warming stripeshave shown how simple graphics can engage broad audiences. The
nature stripesshow how the loss of wildlife and biodiversity can also be presented in a similar way for positive effects.