the Creative Commons Attribution 4.0 License.
the Creative Commons Attribution 4.0 License.
 | 01 Mar 2022
Virtual strike and dip – advancing inclusive and accessible field geology
Natalie Bursztyn
Pejman Sajjadi
Hannah Riegel
Jiawei Huang
Jan Oliver Wallgrün
Jiayan Zhao
Bart Masters
Alexander Klippel
Accessibility and inclusivity in field geology have become increasingly important issues to address in geoscience education and have long been set aside due to the tradition of field geology and the laborious task of making it inclusive to all. Although a popular saying among geologists is “the best geologists see the most rocks”, field trips cost money, time, and are only accessible to those who are physically able to stay outside for extended periods. With the availability of 3D block diagrams, an onslaught of virtual learning environments is becoming increasingly viable. Strike and dip is at the core of any field geologist's education and career; learning and practicing these skills is fundamental to making geologic maps and understanding the regional geology of an area.
In this paper, we present the Strike and Dip virtual tool (SaD) with the objective of teaching the principles of strike and dip for geologic mapping to introductory geology students. We embedded the SaD tool into an introductory geology course and recruited 147 students to participate in the study. Participants completed two maps using the SaD tool and reported on their experiences through a questionnaire. Students generally perceived the SaD tool positively. Furthermore, some individual differences among students proved to be important contributing factors to their experiences and subjective assessments of learning. When controlling for participants' past experience with similar software, our results indicate that students highly familiar with navigating geographical software perceived the virtual environment of the tool to be significantly more realistic and easier to use compared with those with lower levels of familiarity. Our results are corroborated by a qualitative assessment of participants' feedback to two open-ended questions, highlighting both the overall effectiveness of the SaD tool and the effect of geographical software familiarity on measures of experience and learning.
- Article
(10422 KB) - Full-text XML
- BibTeX
- EndNote


1.1 The “field” environment: real, virtual, and implementation for remote learning
The “field” may be the single most prominent element defining geosciences. Processes relevant to Earth sciences happen in the field, and their phenomenological traces are observable in that physical space. Thus, fieldwork and the educational components of field trips and field camps are frequently held in the highest regard (Orion and Hofstein, 1994; Elkins and Elkins, 2017; Pyle, 2009; Semken et al., 2018). Fieldwork remains a graduation requirement for most geoscience programs despite increasing concerns that it may be inaccessible to many students, predominantly from underrepresented groups, as a result of financial, cultural, physical, and safety barriers.
Frequently, physical locations are hard to reach or may be impossible, dangerous, or too expensive to access (e.g., the location is on a different continent, in a restricted area, or only existed in the past) (Slater, 1999; Bowman and McMahan, 2007); moreover, from the spring of 2020 to at least into the summer of 2021, the global COVID-19 pandemic has been/will be impeding physical field experiences. Furthermore, recent studies have shown that the field experience is not inclusive and may be hindering retention and diversity within geoscience undergraduate programs (Hall et al., 2004; Giles et al., 2020; Morales et al., 2020). In contrast, virtual field trips can allow instructors to expose students to widely accessible, relevant, and authentic learning experiences independent of time and space (e.g., Stumpf et al., 2008; Bursztyn et al., 2017; Mead et al., 2019; Klippel et al., 2020a). Leveraging increasingly accessible high-resolution computing devices for education has the potential to positively impact student engagement (Witmer and Singer, 1998; IJsselsteijn and Riva, 2003), and efforts to integrate emerging technology into the classroom to improve undergraduate success in introductory geoscience courses have further demonstrated the importance of experiential learning exemplified best by field trips (Cunningham and Lansiquot, 2019; Dolphin et al., 2019; Lansiquot and MacDonald, 2019; Moysey and Lazar, 2019). While there is some positive evidence that compares actual and virtual field trips (e.g., Klippel et al., 2019; Marshall et al., 2021), considering fieldwork without the field (i.e., in a virtual environment) is a challenging concept for Earth science educators. Consequently, virtual and remote learning in the geosciences has remained a niche product, and it required the COVID-19 pandemic to explore remote learning opportunities for place-based education at scale and across disciplines. We have seen a dramatic influx of efforts (e.g., numerous NAGT workshops; Earth Educators' Rendezvous, 2020) and papers since 2020 that detail the creative ways a community, deprived of their traditional educational methods, has responded to distancing constraints and travel bans (e.g., Andrews et al., 2020; Bethune, 2020; Madon, 2020; Rotzein et al., 2020, 2021; Sajjadi et al., 2020; Tibaldi et al., 2020, Whitmeyer and Dordevic, 2021).
Virtual environments, immersive or desktop-based, allow for the creation of realistic and flexible experiences for (virtual) field trips as well as the learning activities (e.g., measuring geologic structures and building mental models of spatial orientation and scale of landscape features) that are essential to practice on these field trips. Examining digital twins of outcrops through magnification, collecting samples, or measuring the stratigraphy are, with recent technological advances, straightforward to realize virtually. Over the last 4 years, we and others have been building this capacity through combining efficient data collection in the form of 360∘ images, high-resolution images, virtual outcrop models, and simple measuring tools. What we identified as missing are more complex geological tools and pedagogies for the application and practice of concepts such as strike and dip. Strike and dip measurements and rock identification are the fundamental aspects of any geologic map. Taking and interpreting such field measurements both require physical practice and are fundamentally essential for geoscience education, but they are generally not covered extensively in virtual environments (see eRock from Cawood and Bond, 2018, for exceptions). Strike and dip measurements allow students and professionals alike to interpret structures in the Earth's crust and reconstruct deformed regional areas. It is through strike and dip that a geologist understands the regional geology from deposition to deformation.
1.2 Why field geology? Spatial reasoning in the geosciences
Students in the geosciences are frequently required to reason about objects or features that occur at spatial scales too large or small to be directly observed (Gagnier et al., 2017) or hidden from view (Shipley et al., 2013; Ormand et al., 2014; Almquist et al., 2018; Zhao and Klippel, 2019; Atit et al., 2020). As a result, faculty frequently describe students' difficulty with spatial visualization as one of the barriers to success in the geosciences (e.g., Barab and Dede, 2007; Titus and Horsman, 2009; Atit et al., 2020). In particular, spatial visualization is critical to success in courses such as sedimentology and stratigraphy, structural geology, and field techniques (Gagnier et al., 2017). Tectonic and sedimentary processes usually form geo-spatially predictable features, deducible from patterns observed in surface data when one is capable of visualizing the 3D geometry (Alles and Riggs, 2011). Students who possess the spatial visualization abilities necessary to succeed in these courses are also more likely to continue in the geosciences (Titus and Horsman, 2009).
The development of geological reasoning skills can be scaffolded by introducing students to a sequence of exercises starting with prototypical, accessible, and understandable physical locations as well as by introducing more experiential practice opportunities at the lower level prior to the more challenging applications found in subsequent upper-level geoscience courses. In many post-secondary institutions, the concept of strike and dip as geological measurements is introduced in an introductory physical geology course. Later, students practice taking these measurements extensively in a field methods course, apply these methods through different lenses of geologic interpretation in subsequent focus courses, and conclude with a capstone summer field course: Field Camp. Visualizing the 3D forms and structures of our planet is a critical skill for the geosciences, and the foundation of this skill lies in a solid understanding of geological maps and strike and dip measurements.
1.3 A place for virtual and immersive technologies in place-based learning
Place-based learning, such as field trips, combines the practices found in problem-based learning and experiential learning to foster a “sense of place” that generates an authentic learning environment, something valued across disciplines from social to physical sciences. Virtual environments, especially immersive virtual environments, allow for the creation of learning environments grounded in the same learning theories and pedagogies as place-based education. Associated theories are discussed from different angles such as discovery, inquiry, and problem-based learning as well as experiential learning (Kolb, 2015). The focus of this article is not on learning theories; thus, we do not provide an in-depth discussion of the different approaches. Similarities of these approaches are grounded in a constructivist perspective on learning (Winn, 1993; Dalgarno, 2002), building on the power of contextualizing learning through integrating prior knowledge and experience in addition to the context in which the content is embedded. Bangera and Bronwell (2014) found that benefits of these approaches include the fact that they may offer a more effective and accessible starting point for students, including minority, low-income, and first-generation college students, and can provide students with a greater ability to use scientific thinking in other aspects of their lives. These approaches, in particular discovery-based learning, have also been found to be key to successful STEM (science, technology, engineering, and mathematics) education (Olson and Riordan, 2012).
What role can virtual and immersive technologies play in discovery-based courses and fostering equity and access to STEM education, such as geoscience field trips? The theoretical basis for the transformative nature, especially of immersive technologies for education, is growing rapidly (Dede, 2009; O'Connor and Domingo, 2017; Liu et al., 2020; Parong and Mayer, 2020; Wu et al., 2020). Characteristics of virtual and immersive technologies lend themselves to realize place-based learning (Semken et al., 2018), experiential and embodied learning (Johnson-Glenberg, 2018), and designing environments for discovery-based learning. Placing learners into the real world with a specific problem that is relevant to a location provides a more direct connection of key learning points that students can understand and use to become more engaged (Powers, 2004; Bursztyn et al., 2020). Designing virtual environments in which students' learning activities are scaffolded by exercises and instruction is at the core of discovery-based learning (McComas, 2014). Geological processes can sometimes be difficult to visualize during field trips due to vast spatial and temporal scales – this is one area in the discipline where immersive virtual reality (iVR) can offer a distinct advantage. The blending of place-based and discovery-based learning, especially in immersive virtual environments allows for the “perceptual blending of the real and the virtual world with its place-based authenticity” to enable better learning experiences (Barab and Dede, 2007, p. 2). The geosciences have long been either explicitly or implicitly using experiential, place-based exercises to foster discovery-based learning in their curriculum through, for example, field trips (Semken et al., 2018; Atit et al., 2020). Entering the 2020 field camp season, a crucial component of most traditional geoscience programs, instructors and students were faced with limited options: no field camp, a limited and socially distanced field camp, or a virtual field camp. Here, it is pertinent to channel the virtuality momentum into constructive, critical, and empirically grounded discussions of the future and utility of VR for geoscience education. It is important to note that virtual and immersive virtual experiences cannot only be designed to mimic actual field experience but that they offer opportunities beyond physical reality such as reacting to the learner in real time (Lopes and Bidarra, 2011; Vandewaetere et al., 2013; Sajjadi et al., 2014; Shute et al., 2016).
This paper presents a virtual Strike and Dip tool (SaD) in a web-based desktop virtual reality (dVR) environment. In addition to posing many challenges, the COVID-19 pandemic-induced transition to primarily online teaching also presented geoscience educators with a new opportunity to improve introductory field-mapping instruction to be more inclusive if we are able to recreate strike and dip lab experiences through virtual environments. SaD is an interactive experience created for the purpose of guiding students to think spatially for critical geological applications by taking strike and dip measurements from 3D models of geological structures. The SaD tool mimics an introductory geologic mapping lab where students are taught strike and dip measurements using a set of angled boards with accompanying rock samples staged around a classroom (or open space) to reveal an imagined geologic structure. We have replicated this experience and traditional pedagogies in the virtual world with SaD and its series of digital planes and corresponding virtual rock samples (high-resolution 3D digital models downloaded from Sketchfab™). With this tool, students can interactively learn what strike and dip measurements are, practice the basics of field mapping using strike and dip, and practice taking measurements using a variety of geological structure types. The SaD tool mimics geoscience place-based learning experiences and combines them with the flexibility and scalability of dVR. A small-scale pilot assessment (11 participants) using the dVR SaD interface and an accompanying mapping assignment was completed in fall 2020 and presented at a workshop (Bursztyn et al., 2021). Building on the pilot study, we improved the design iteratively and rolled out SaD as a large-scale study in a 250-student introductory geoscience class. Here, we present a more in-depth discussion of SaD, the newly conducted empirical evaluation and analysis, a critical discussion of results showing important considerations for the future of virtual geosciences, and our vision for future SaD and virtual geoscience toolkit developments.
2.1 The Strike and Dip tool
The representation of 3D geologic structures in 2D form requires several standard map notations, the most important of which are strike and dip measurements. New learners are typically introduced to taking strike and dip measurements using the “right-hand rule” (RHR) convention. There are a few variations of the RHR, but a commonly used one (and the one used in this study) is as follows: hold the right hand flat, with the palm down on the planar geologic feature, thumb extended at 90∘ to fingers, and fingers pointing downdip (Fig. 1). Within the SaD tool, RHR is an optional feature that can be toggled off or on per user preference. The concept of strike and dip is often challenging to teach to new learners of geology at the best of times, but the COVID-19 pandemic presented geoscience educators with a new challenge: removing the in-person field trip instruction that provides guided practice in taking strike and dip measurements. Therefore, what were deemed the fundamental components of in-person field instruction for learning to measure geologic structures – identifying strike and dip planes and manipulating a compass to determine their orientation in space – were the primary focus of the SaD tool.
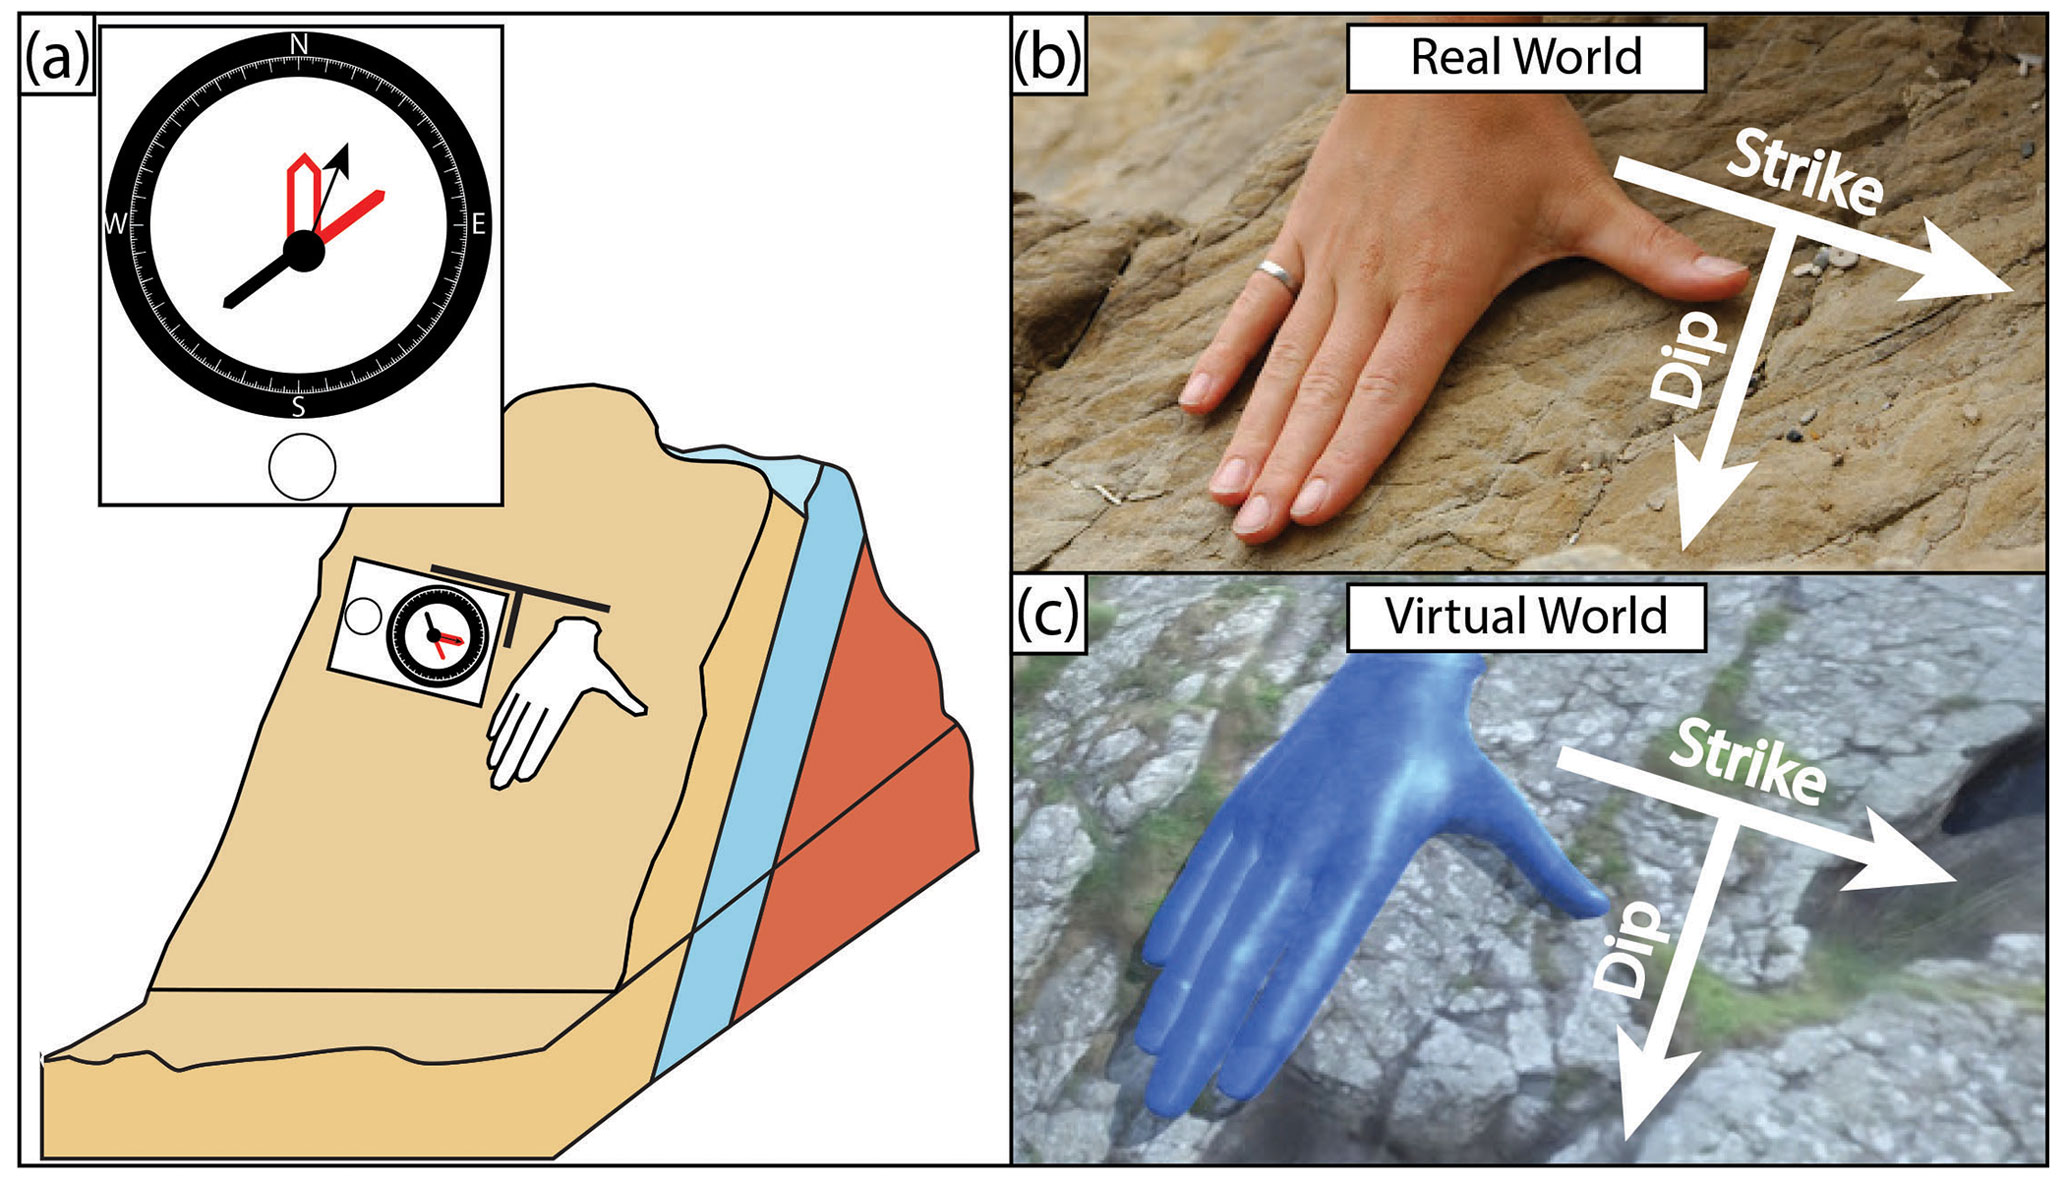
Figure 1A schematic of how one measures strike and dip on an outcrop. (a) Strike and dip are measured on the planar surface of a rock. The strike represents the line at which the planar rock surface intersects with any horizontal plane. The dip angle is the angle between that dipping surface and the horizontal plane. Panels (b) and (c) give examples of RHR use in the real world and in the SaD virtual field environment, respectively.
The primary components of the SaD tool are the Compass Tool and the Small Data Panel/Data Set (Fig. 2a, b). The strike and dip data are recorded in the tool in the All Data Sets panel (Fig. 2b). Users can navigate around a 3D digital environment to locations where they can measure the strike and dip of various slopes (platforms or outcrops). The user can locate their position via the Mini World Map or full screen World Map (Fig. 2c). Once the user is positioned close to the slope that they would like to measure, they orient the position and rotation of the compass tool (using the compass control panel) to correspond to the strike or dip measurements. In the virtual environment levels, “station locations” are specifically laid out to correspond to the assignment maps.
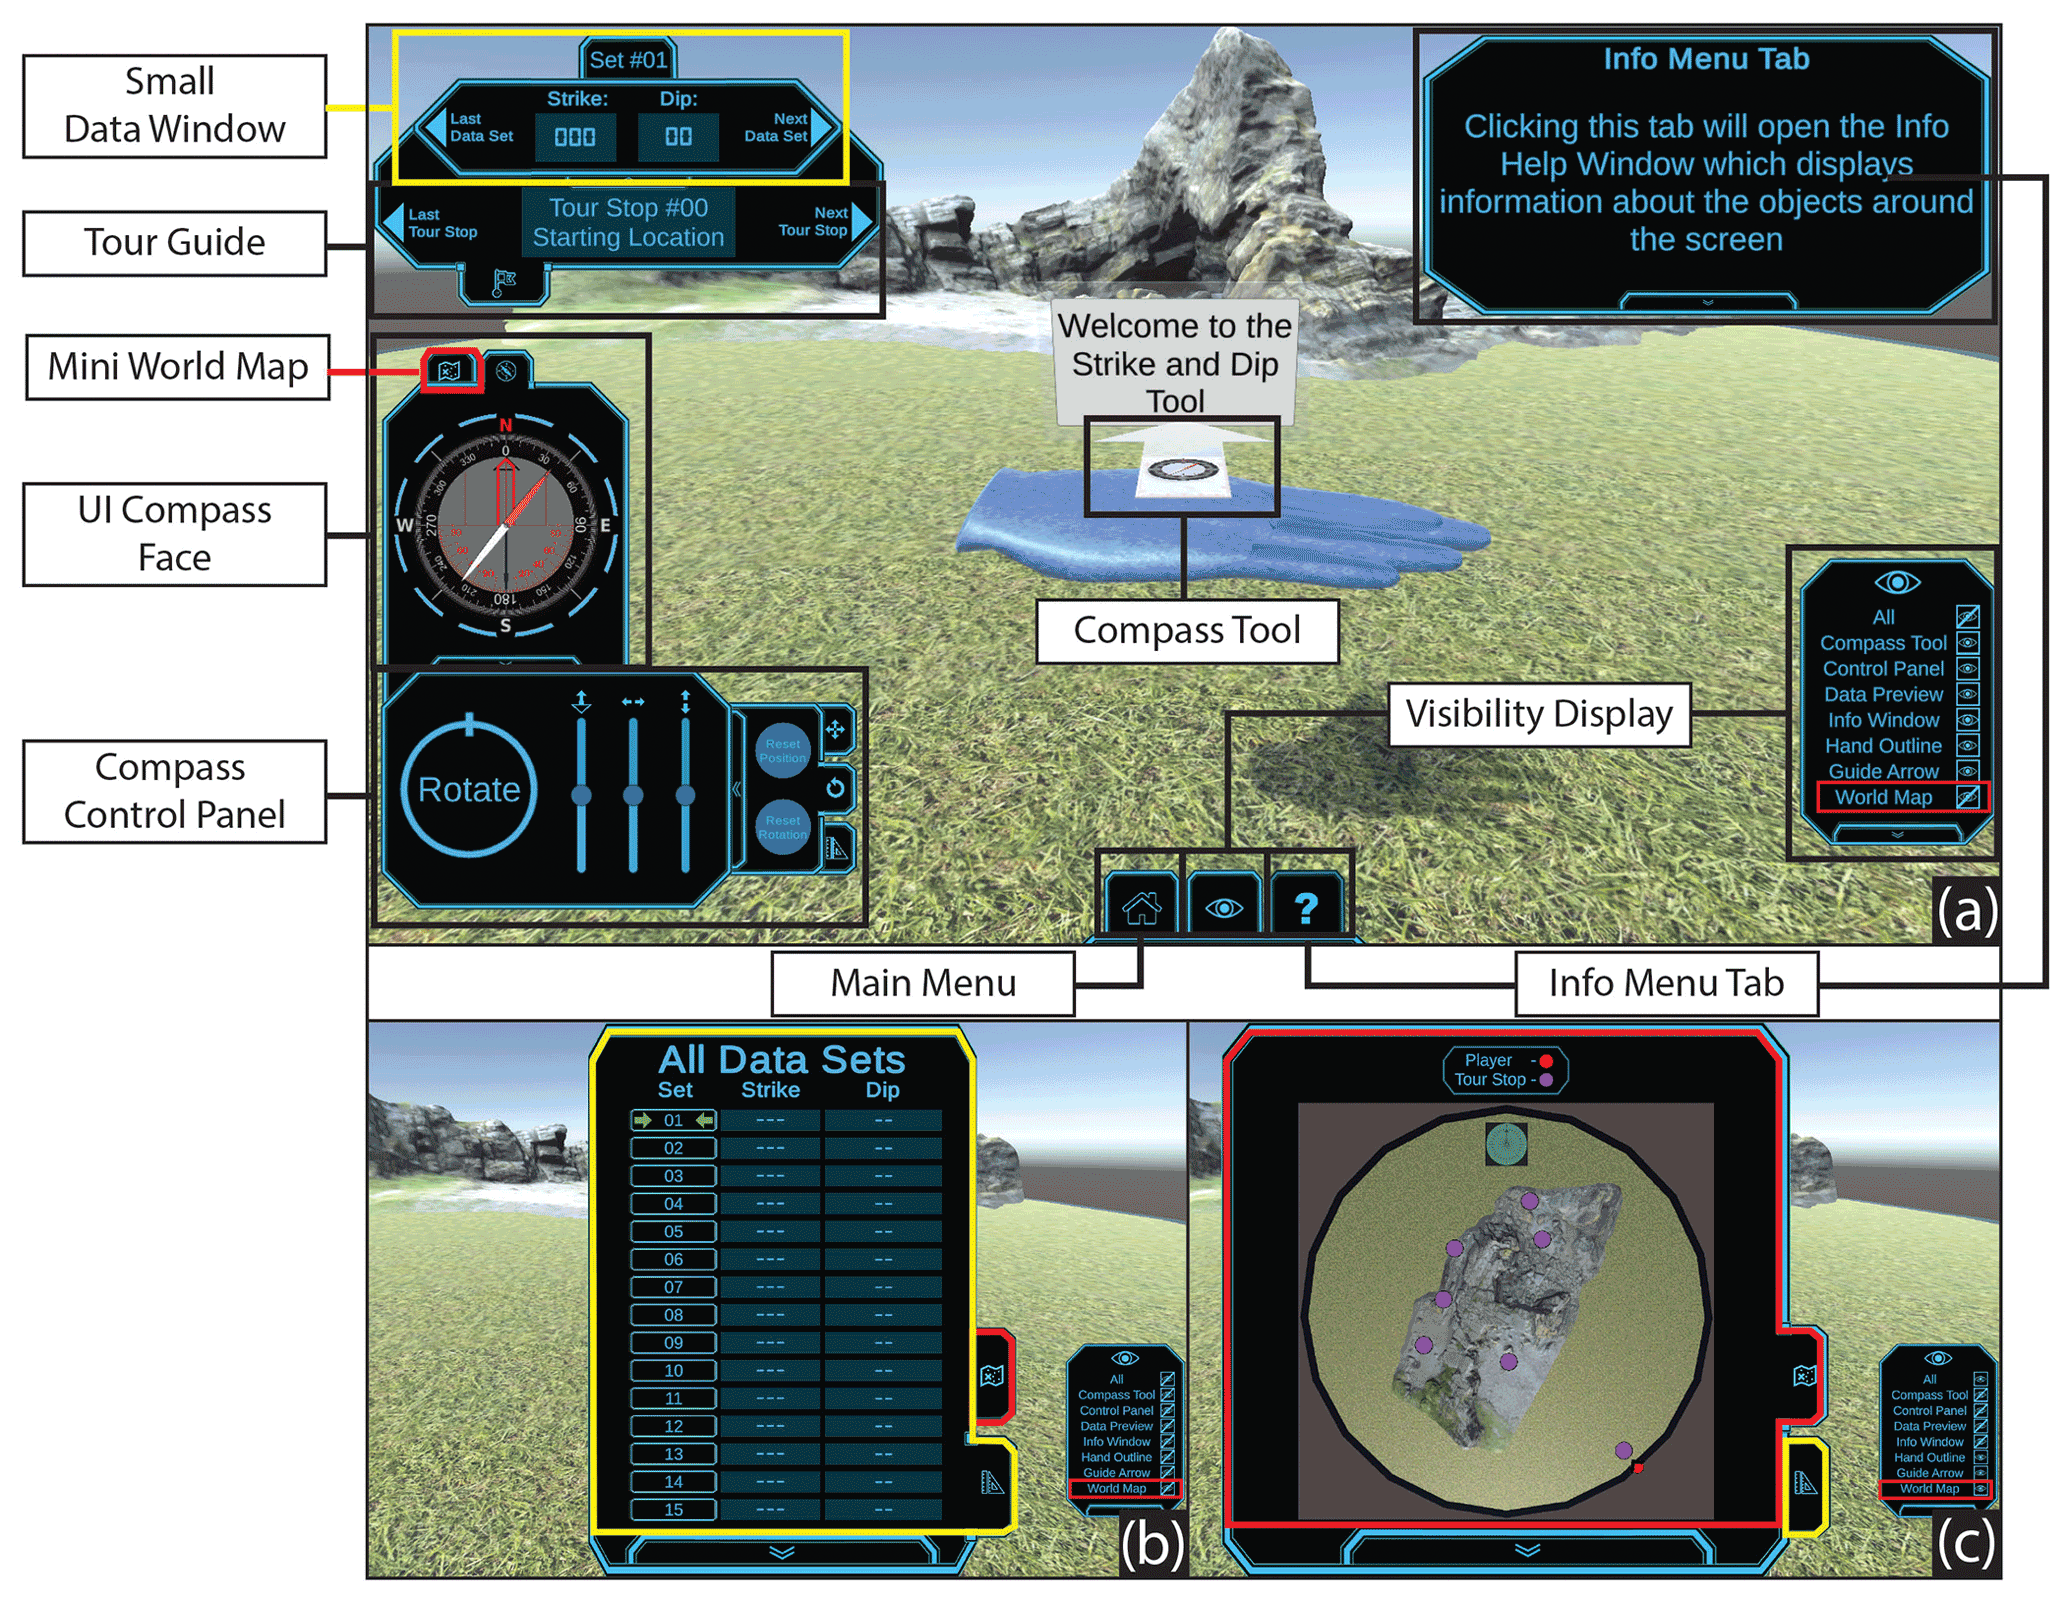
Figure 2The SaD HUD (heads-up display). The HUD is composed of all the tools visible on screen throughout the program. Each tool can be toggled on/off depending on user preference. (a) The main HUD shows the Small Data Window, where the user's most recent strike and dip measurements are displayed. The Tour Guide allows the user to view the stop at which they are presently located. The Mini World Map (red outline) shows the user their location in a miniature view. The user may view the compass with more ease using the UI Compass Face while they are measuring the orientation of the rock with the Compass Tool. The Compass Control Panel is used to position the compass on the outcrop/board to measure orientation. The Main Menu display allows the user to adjust the speed at which they/the compass move, the level they are on, and more personalization features. The Info Menu Tab gives brief information about each tool when the user hovers over them. Finally, the Visibility Display allows the user to toggle on/off each tool. (b) If the user wishes to view their entire strike and dip log, they can click on the triangle protractor icon (yellow outline). (b) The user can also click on the World Map (red outline) to obtain a full-screen view of their location in the environment.
There are four different setting levels within the SaD tool; from least to most challenging, they are bumper cubes, bumper rocks, cubes, and rocks. The two cubes levels have field stations set up within the virtual environment as rectangular planes with a virtual hand sample rock floating above (Fig. 3a). The cubes levels have very obvious planar surfaces for taking strike and dip measurements. The two rocks levels have their field stations set up with rectangular planes draped with rock “skins” that give an appearance closer to an outcrop (Fig. 3b). Depending on the complexity of the rock texture of the skin, the planar surfaces within the rocks level environments are more challenging to precisely identify. The two bumper levels have an algorithm that flags the strike and dip measurements in red if they are greater than 10 and 5∘ off, respectively. These flags enable self-correction by the students and facilitate only recording correct measurements in the data display panel.
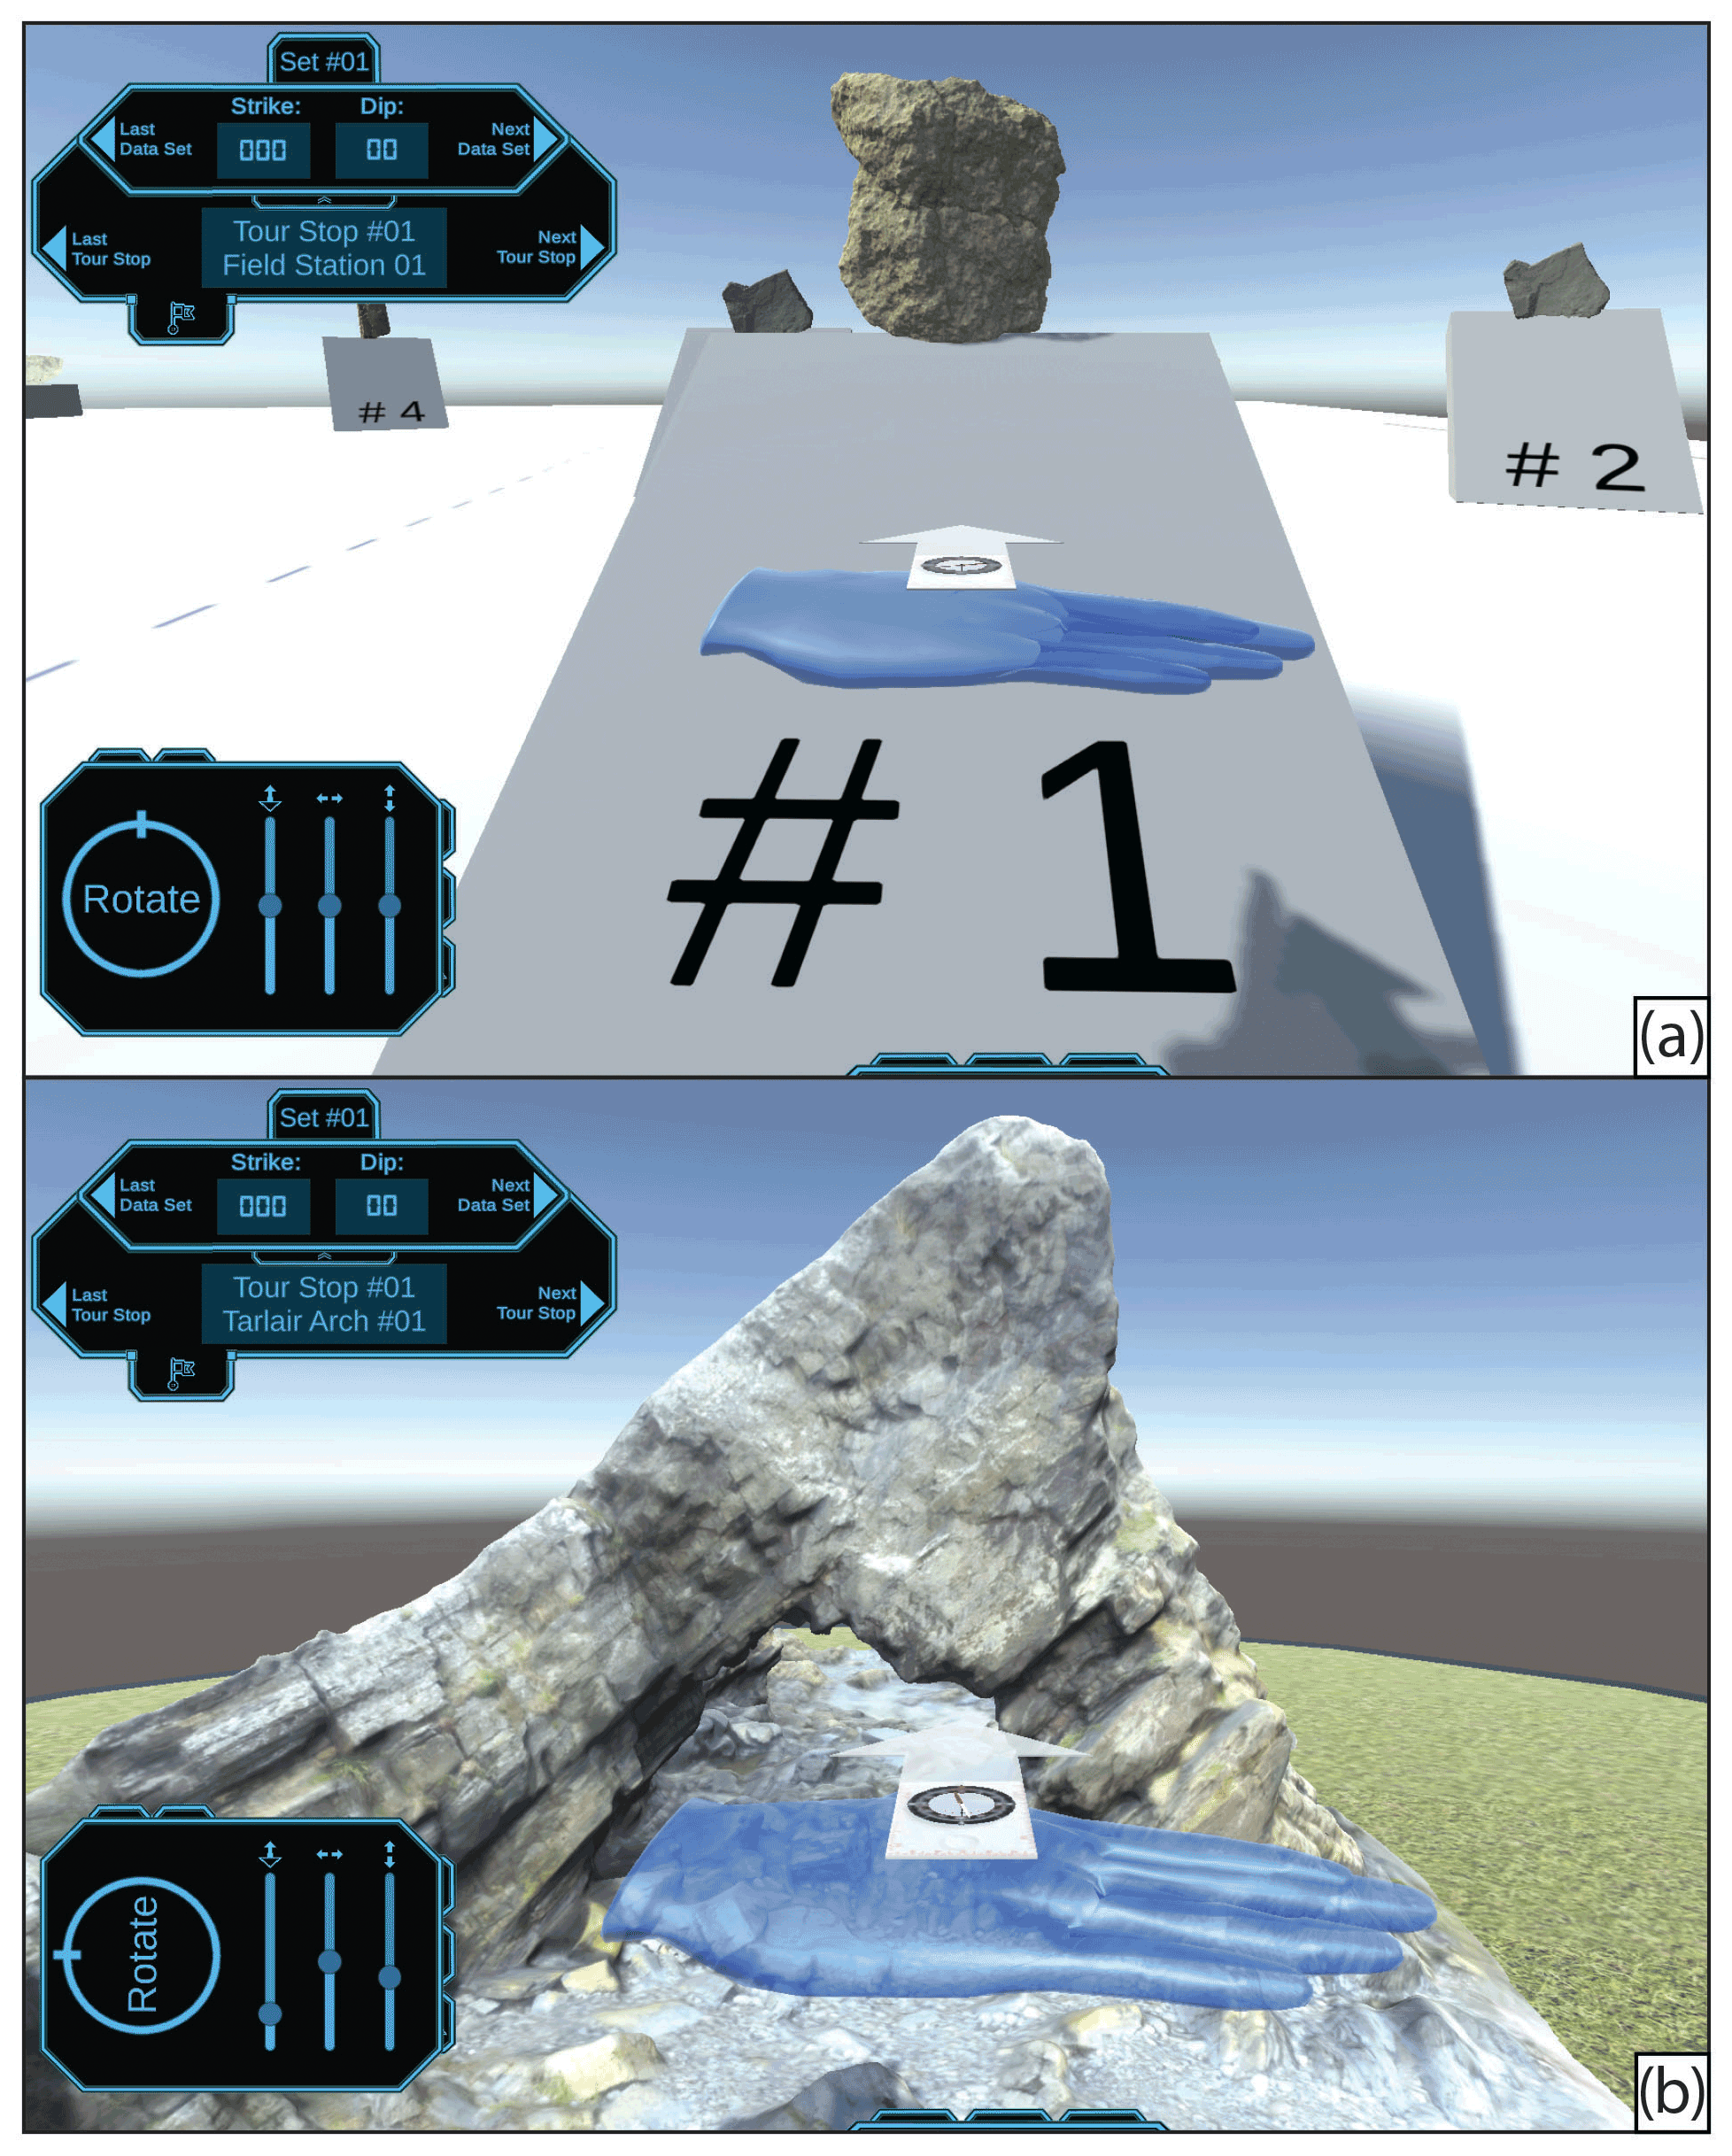
Figure 3The two main settings: cubes and rocks. Each may be used with the bumper prefix to allow the user an error-flagging buffer when measuring platform/outcrop orientation (±10∘ for strike and 5∘ for dip). Panel (a) shows the level cubes, which replicates the classroom beginner technique of using a platform to practice taking strike and dip measurements. Panel (b) provides an example of the rocks level, which features 3D outcrops.
2.1.1 Participants
A total of 147 undergraduate students (with an average age of 19.73) participated in this study. Of this population, 98 students self-identified as male, 44 as female, 3 as other, and 2 preferred not to answer. All students were recruited from an introductory geoscience class (Geosc 001 – Physical Geology) at The Pennsylvania State University in the fall 2020 semester. This class was chosen for the introductory nature of material taught, including the strike and dip content already in the course curriculum. The SaD experience was embedded in this course as a laboratory assignment, and students were awarded course credit for their participation. In essence, the laboratory was conducted in a context equivalent to the traditional face-to-face environment.
2.1.2 Procedure
The lab exercise was administered with the help of teaching assistants (TAs). Following the same procedure as the traditional in-person lab that the SaD dVR experience replaced, students were assigned pre-lab homework readings. During the lecture, they were presented the standard introductory material on geologic maps and mapping, such as how to interpret the geologic rule of v's, measuring and plotting strike and dip on a map, drawing contacts, and constructing basic cross sections. Earlier in the semester, students had completed a geologic mapping exercise from their lab workbooks for which they were provided strike and dip measurements. This lab exercise was graded and returned to the students prior to their introduction to the SaD tool for their virtual field-mapping activity. At the beginning of the SaD lab, students were shown an introductory video tutorial demonstrating how to access and utilize the SaD tool through an online dVR environment. Navigation between “field stations” within the environment using arrow keys and/or the mouse, proper hand placement for the right-hand rule, measurement of strike and dip, and using the Mini World Map feature are all demonstrated within this tutorial video. TAs provided additional office hours after the lab session and online video resources (which included a longer comprehensive tutorial video and written instructions for the SaD tool as well as a video tutorial on the basics of geologic mapping and drawing a cross section). Participants in this study used the SaD tool at the beginner (least challenging) bumper cubes level.
As for the traditional in-person lab exercise, the SaD mapping activity was completed in a single 3 h lab session and consisted of two parts, both tasking the students with gathering information (e.g., strike and dip, rock descriptions) with which to compile a geologic map, legend, cross section, and interpretation of geologic events that formed the area. Students were given blank base maps and fill-in-the-blank field notes to complete as they worked in the virtual environment. This aspect of the assignment tasked the students with transcribing the data as they would in the real world and practice active mapping. Students were also provided with the rock identifications for the map areas to reduce the number of tasks that they had to complete in their single lab session. The first mapping activity (Map 1) of the assignment was an optional “practice” map with five rock types, six field stations, and relatively simple geologic relationships to interpret (Fig. 4). The second mapping activity of the assignment (Map 2) was classified as the “real” map with 15 field stations and slightly more complex geologic relationships; this is the map that was evaluated for their grade in this lab assignment. Grading of the lab exercise included evaluation of (1) the map itself, (2) the field notes, (3) the cross section, (4) the explanation, and (5) the interpretation of geologic events that formed the area (Fig. 4).
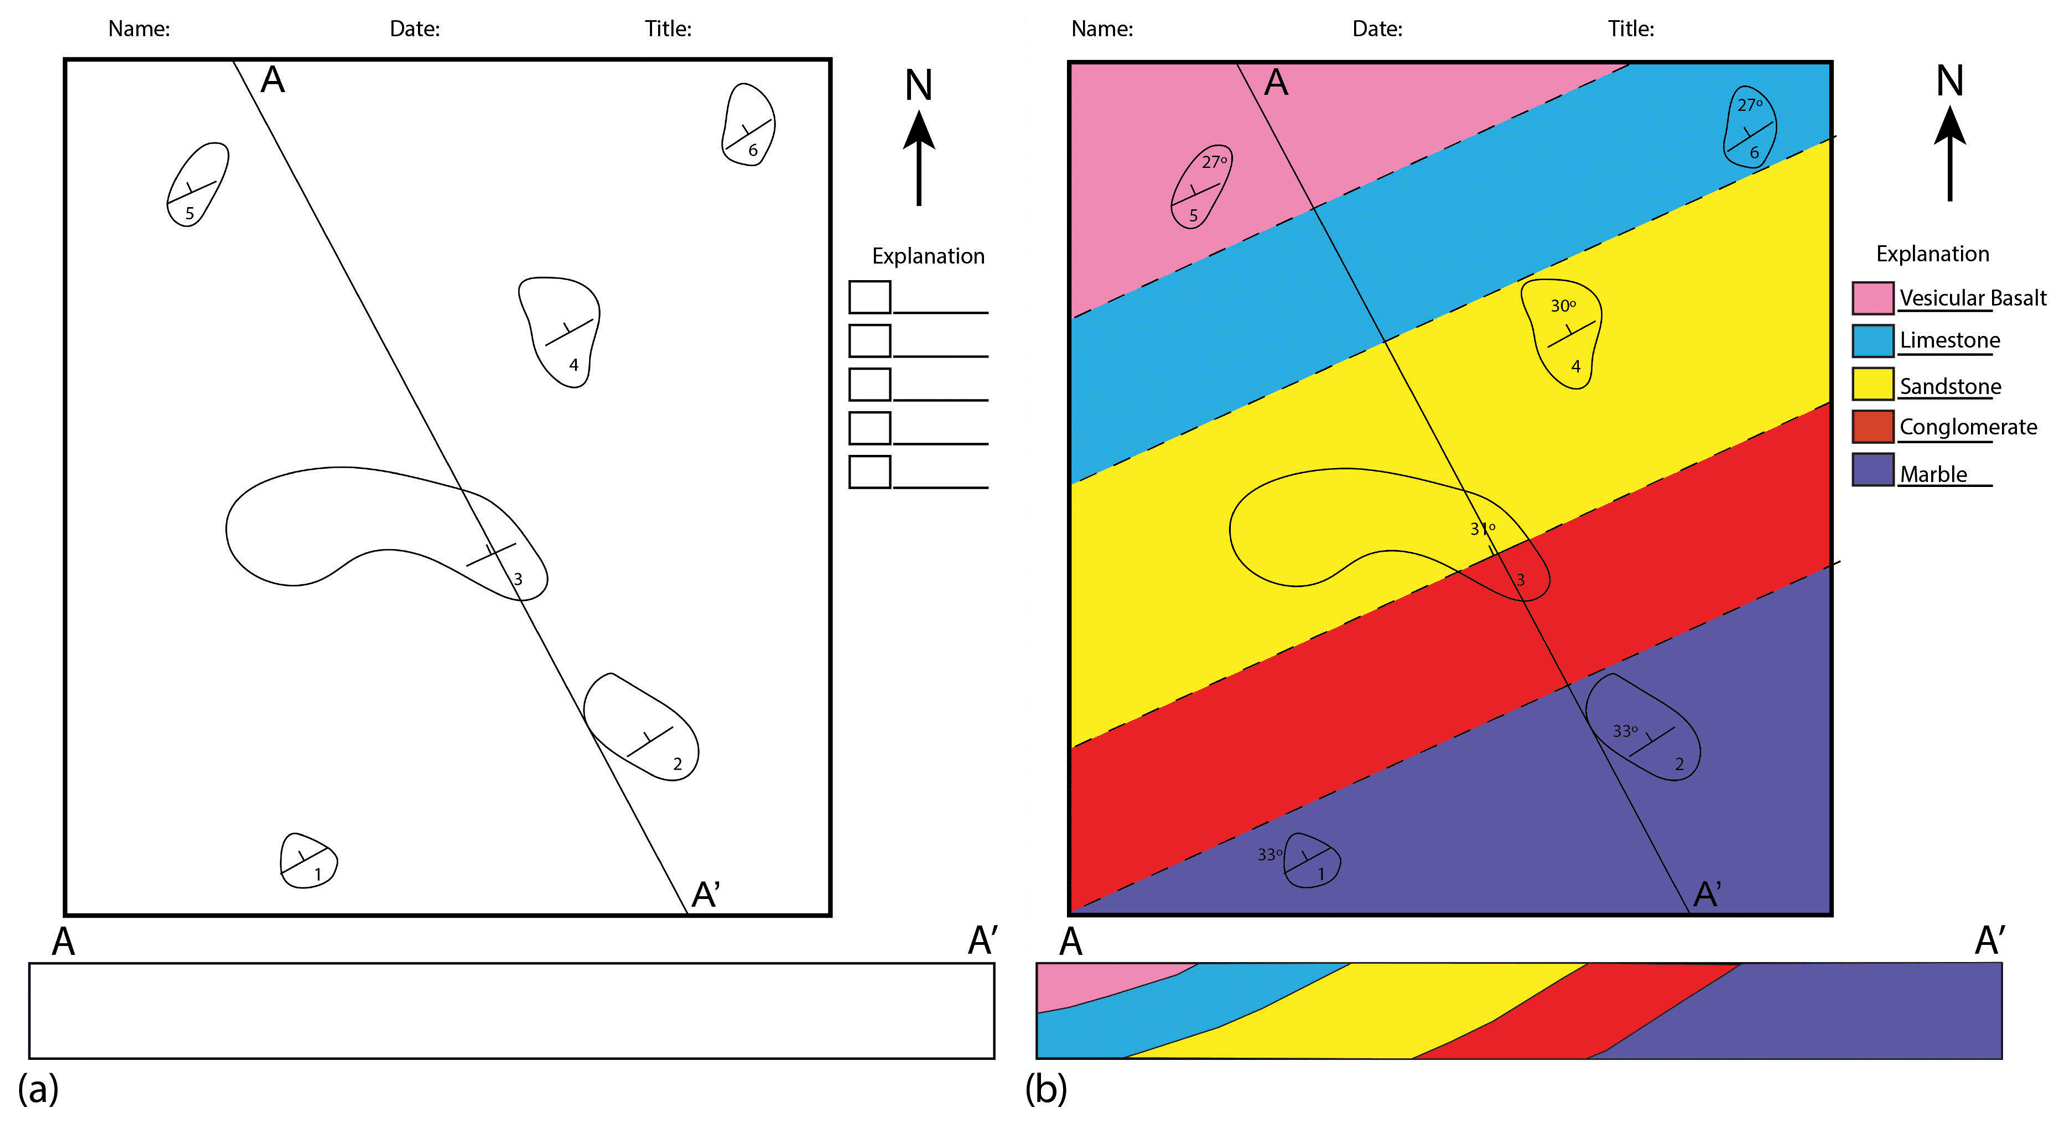
Figure 4The before and after examples of Map 1. (a) Students were initially given a blank map with space to fill in the explanation and cross section. Students were expected to fill in field notes and interpretation of geologic events on a separate piece of paper. Panel (b) shows a completed map and the accompanying cross section.
2.2 Assessment measures and analyses
The participants' experiences and learning with the SaD tool were assessed using self-reported questionnaires (Appendix A). All of the questionnaire items are from established and validated instruments (summarized and adapted by Lee et al., 2010; Klingenberg, 2020). As part of the demographic information, participants were asked to report on their age, gender, major and minor fields of study, and year of study. Furthermore, participants were asked to report on their familiarity with navigating geographical software (such as ArcGIS) as well as their familiarity with playing computer games. Direct student learning of geologic mapping constructs (i.e., via lab grades) was not assessed for this study, as the focus was on the experience of the participants using the SaD tool for the purpose of learning the basics of geologic mapping.
2.2.1 Quantitative assessment and analyses
After interacting with the SaD tool, the experiences (learning and general) of the participants were measured in light of representational fidelity, immediacy of control, perceived usefulness, perceived ease of use, motivation, control and active learning, reflective thinking, perceived learning effectiveness, satisfaction, and self-efficacy (Table 1, see also Appendix A for the full question list). All constructs were measured on a scale of 1 to 5, and individual items were averaged and collapsed into the final construct score.
Table 1Metrics from the participant questionnaire and their respective explanations.
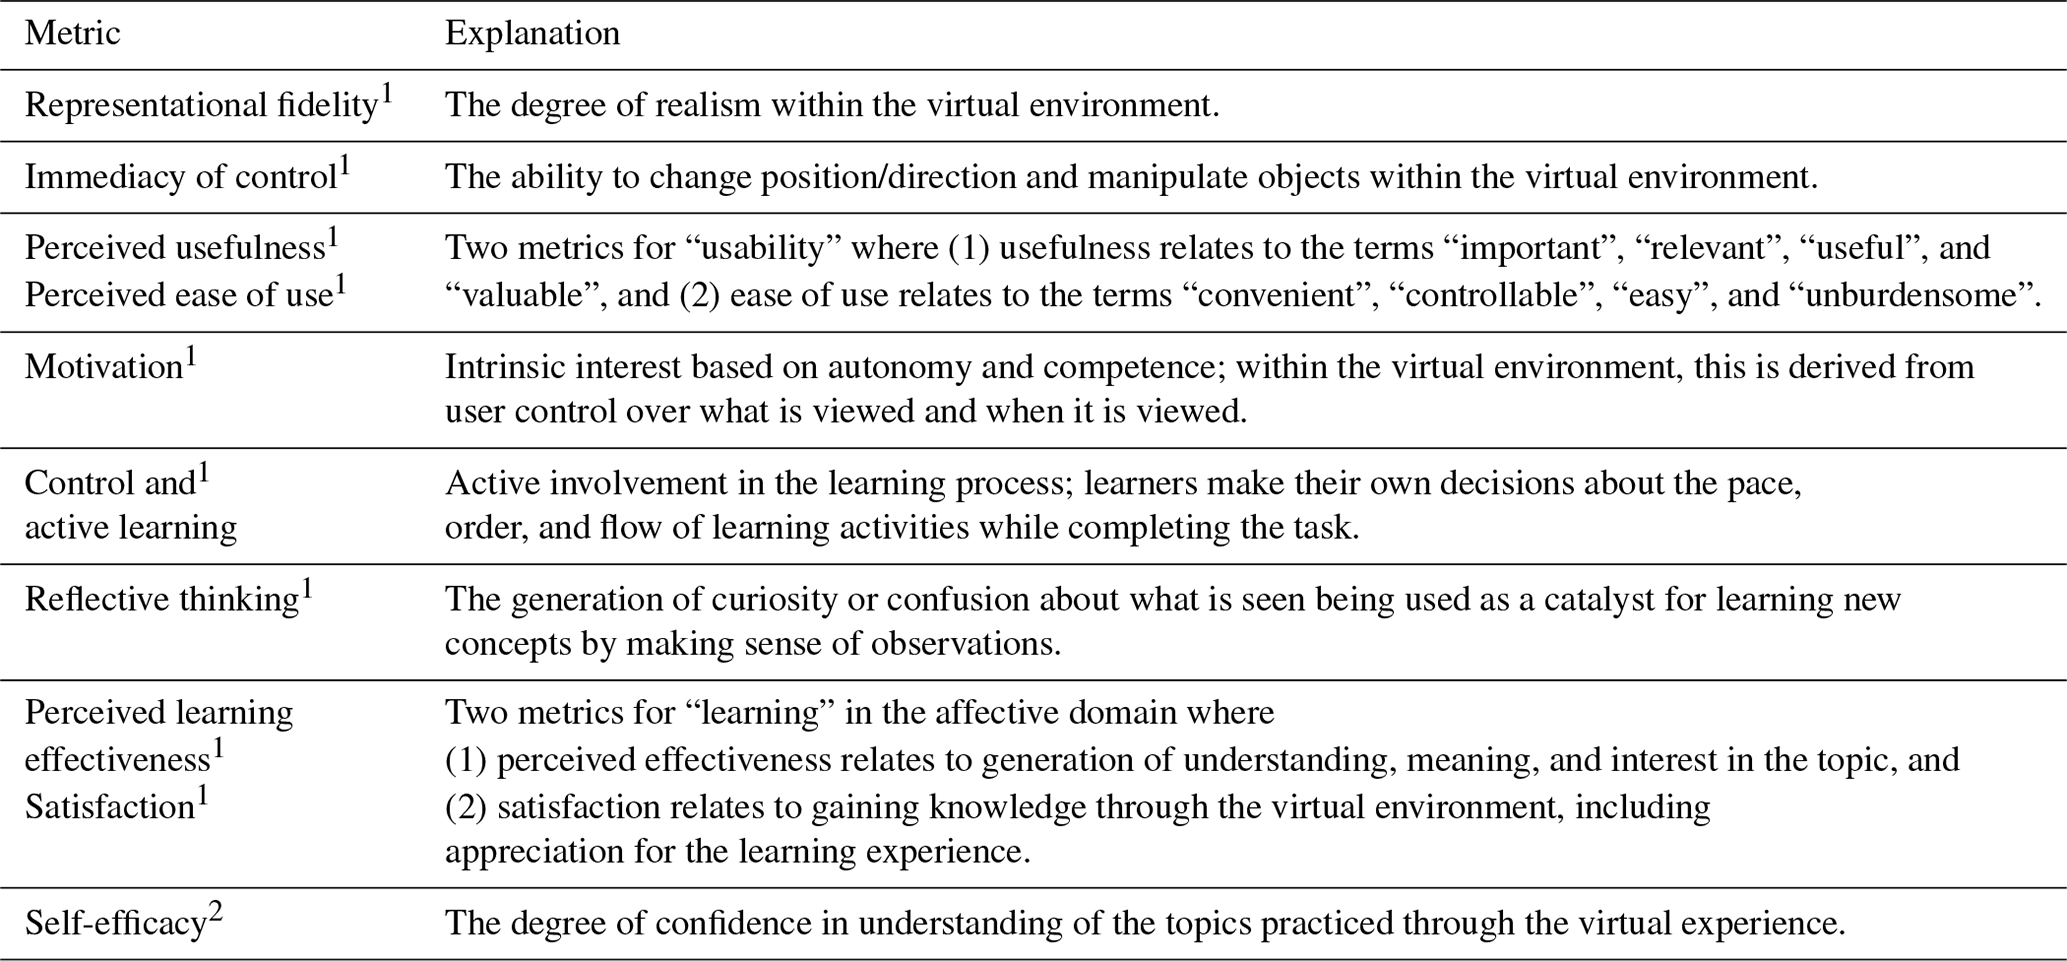
1,2 The metrics were derived from 1 Lee et al. (2010) and 2 Klingenberg (2020).
In order to maintain an unbiased distribution into the low/high categories, cases where a participant scored exactly the same as the median (3 for geographical software familiarity, and 4 for gaming familiarity) were excluded. Using this approach 53 participants were identified belonging to the low-software-familiarity category, 41 to the high-software-familiarity category, 47 to the low-gaming-familiarity category, and 66 to the high-gaming-familiarity category. The experience and learning metrics of participants were compared based on these categories using an independent samples t test or, alternatively, a Mann–Whitney U test in case of a non-normal distribution.
In addition to geographical software and gaming familiarity, we also explored the effect of gender on the experiences and learning of participants. As such, the experiences and learning metrics of 98 male participants were compared with 44 female participants. Two-way analyses of variance (ANOVA) tests were conducted to explore the interaction effect between geographical software/gaming familiarity and gender on the measured experience and learning metrics reported in Table 1. All analyses were performed using IBM SPSS Statistics 22.
2.2.2 Qualitative assessment and analyses
Within the survey, the participants were asked two open-ended questions about their experiences with the SaD tool:
-
“How was your learning experience using this tool? Describe how you felt about practicing geologic mapping in a virtual environment.”
-
“How did your experience using the strike and dip tool change between the first and second mapping activities? Explain within the context of the technology (ease of use, functionality, etc.)”
Combined with the quantitative analyses, qualitative analyses provide deeper insights into how the SaD tool was perceived by the participants. Based on the structured content analysis approach proposed by Schreier (2012), two independent coders examined the responses of participants and inductively generated codes that would capture their content. The coders reached agreement by grouping and rearranging the codes into the final schemas (one for each question) based on the most frequent codes. Inter-rater reliability tests based on Cohen's kappa were also conducted for the finalized results. To further understand these results, we examined the associations between geographical software familiarity and gaming familiarity groupings (high/low) and each of the codes using a chi-square test of independence and a post hoc test with Bonferroni correction (resulting in an adjusted alpha of 0.0125).
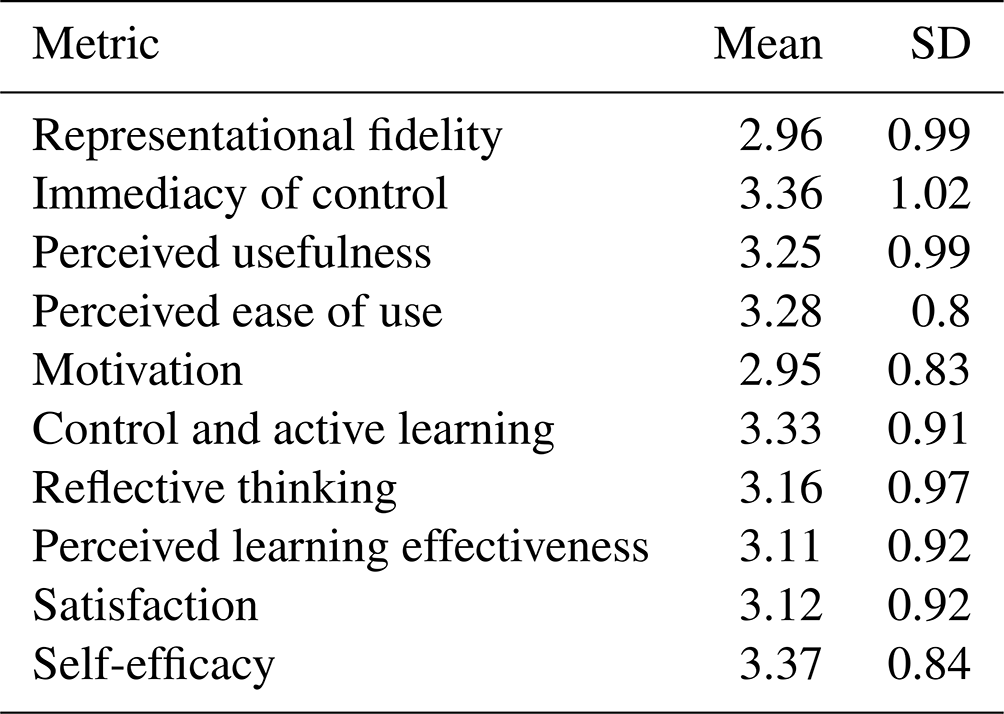
3.1 Quantitative analysis
We first looked at the scores for the different measured metrics (Table 1) averaged over all participants to analyze the overall assessment of the SaD tool. The results summarized in Table 2 show slightly above-average scores for the representational fidelity and motivation metrics as well as well-above-average scores for immediacy of control, perceived usefulness, perceived ease of use, control and active learning, reflective thinking, perceived learning effectiveness, satisfaction, and self-efficacy. These scores indicate a positive overall evaluation of the SaD tool, implying that it succeeded in eliciting a good experience for users and, therefore, can be considered an effective learning instrument.
As a second step, we were interested in how the experience with the SaD tool was impacted by individual differences between the participants related to past exposure to geographical software and video games. The sampled population reported a slightly above-average score for familiarity with navigating geographical software (mean =2.86, SD = 1.25) and a well-above-average score for familiarity with gaming (mean =3.91, SD = 1.23). The results from the analyses comparing the survey scores of participants based on their software and gaming familiarity groupings are reported in Tables 3 and 4 in the following.
Our results indicate statistically significant differences (using a combination of independent samples t tests and a Mann–Whitney test in the case of non-normal distribution) for almost all of the metrics in the general and learning experiences of students grouped by low and high software familiarity. For representational fidelity, scores of the high-software-familiarity group were higher than those in the low-software-familiarity group (mean =3.46, SD = 0.95 and mean =2.59, SD = 0.92, respectively; t(92)=4.461, p<0.001). For immediacy of control, scores in the high-familiarity group were higher than in the low-familiarity group (mean =3.7, SD = 0.89 and mean =3.21, SD = 1.17, respectively; t(92)=2.188, p=0.026). For perceived usefulness, scores in the high-familiarity group were higher than in the low-familiarity group (mean =3.56, SD = 1 and mean =3.01, SD = 1.07, respectively; t(92)=2.536, p=0.013). For perceived ease of use, scores in the high-familiarity group were higher than in the low-familiarity group (median = 3.75 and median = 2.75, respectively; U(Nlow=53, Nhigh=41) =554.500, , p<0.001). For perceived learning effectiveness, scores in the high-familiarity group were higher than in the low-familiarity group (mean =3.45, SD = 0.82 and mean =2.95, SD = 0.95, respectively; t(92)=2.728, p=0.008). For satisfaction, scores in the high-familiarity group were higher than in the low-familiarity group (mean =3.4, SD = 0.92 and mean =2.9, SD = 0.97, respectively; t(92)=2.570, p=0.012). Lastly, scores for self-efficacy were greater in the high-familiarity group than in the low-familiarity group (mean =3.64, SD = 0.83 and mean =3.16, SD = 0.89, respectively; t(91)=2.651, p=0.01). For a complete reporting of these results, refer to Table 3.
Table 3Results of an independent samples t test comparing students grouped by software familiarity.
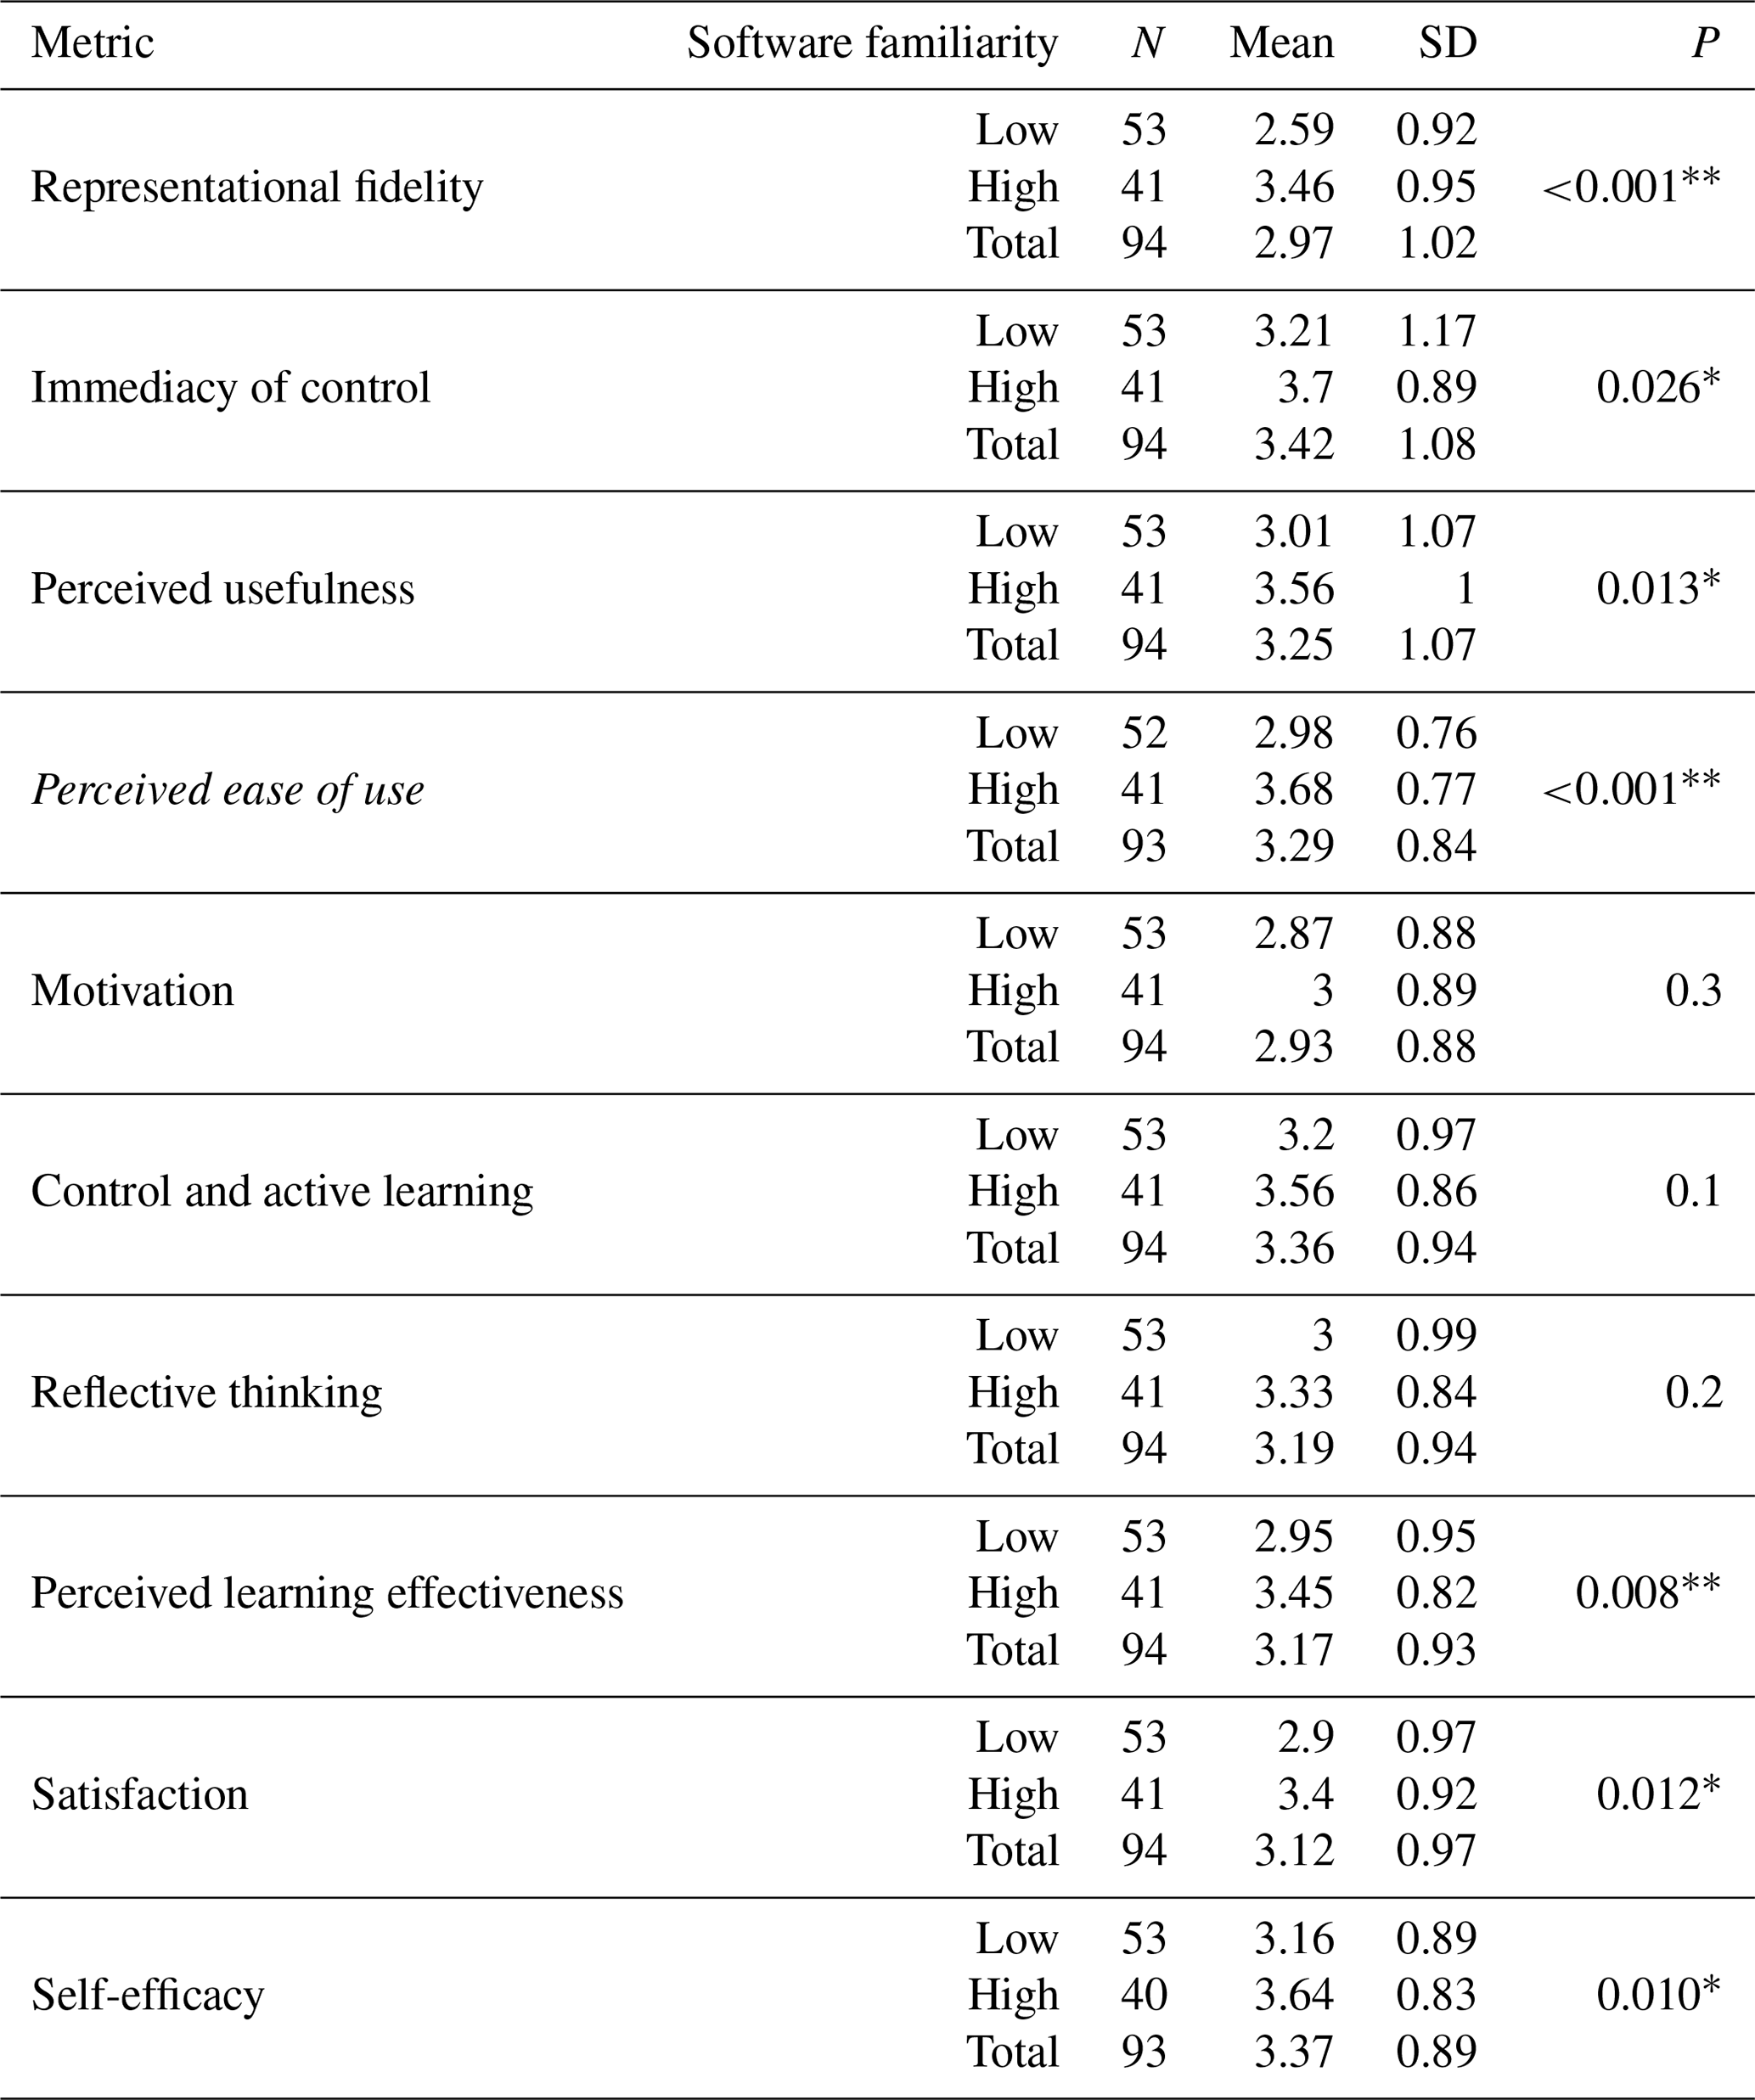
*P<0.05. . Italic text denotes metrics with a non-normal distribution for which a Mann–Whitney test was also used.
A similar trend in the results was observed for students grouped by gaming familiarity. Our results indicate statistically significant differences (using a combination of independent samples t tests and a Mann–Whitney test in the case of non-normal distribution) for almost all of the metrics in the general and learning experiences of students grouped by low and high gaming familiarity. For representational fidelity, scores of students belonging to the high-gaming-familiarity group were higher than those in the low-gaming-familiarity group (median = 3.25 and median = 3, respectively; U(Nlow=47, Nhigh=66) =1167.500, , p=0.023). For immediacy of control, scores of students belonging to the high-gaming-familiarity group were higher than in the low-gaming-familiarity group (median = 3.75 and median = 3, respectively; U(Nlow=47, Nhigh=66) =959.000, , p=0.001). For perceived usefulness, scores of students belonging to the high-gaming-familiarity group were higher than in the low-gaming-familiarity group (mean =3.42, SD = 0.74 and mean =2.96, SD = 0.8, respectively; t(111)=2.483, p<0.05). For perceived ease of use, scores of students belonging to the high-gaming-familiarity group were higher than the low-gaming-familiarity group (mean =3.42, SD = 0.74 and mean =2.95, SD = 0.8, respectively; t(110)=3.459, p<0.01). For control and active learning, scores of students belonging to the high-gaming-familiarity group were higher than the low-gaming-familiarity group (mean =3.5, SD = 0.85 and mean =3.12, SD = 0.9, respectively; t(111)=2.253, p<0.05). For perceived learning effectiveness, scores of students belonging to the high-gaming-familiarity group were higher than the low-gaming-familiarity group (median = 3.43 and median = 3, respectively; U(Nlow=47, Nhigh=66) =1147.000, , p=0.018). For satisfaction, scores of students belonging to the high-gaming-familiarity group were higher than the low-gaming-familiarity group (median =3.42 and median =3, respectively; U(Nlow=47, Nhigh=66) =1122.000, , p=0.012). Lastly, for self-efficacy, scores of students belonging to the high-gaming-familiarity group were higher than the low-gaming-familiarity group (mean =3.55, SD = 0.78 and mean =2.86, SD = 0.92, respectively; t(110)=3.296, p<0.01). For a complete reporting of these results, refer to Table 4.
Table 4Results of an independent samples t test comparing students grouped by gaming familiarity.
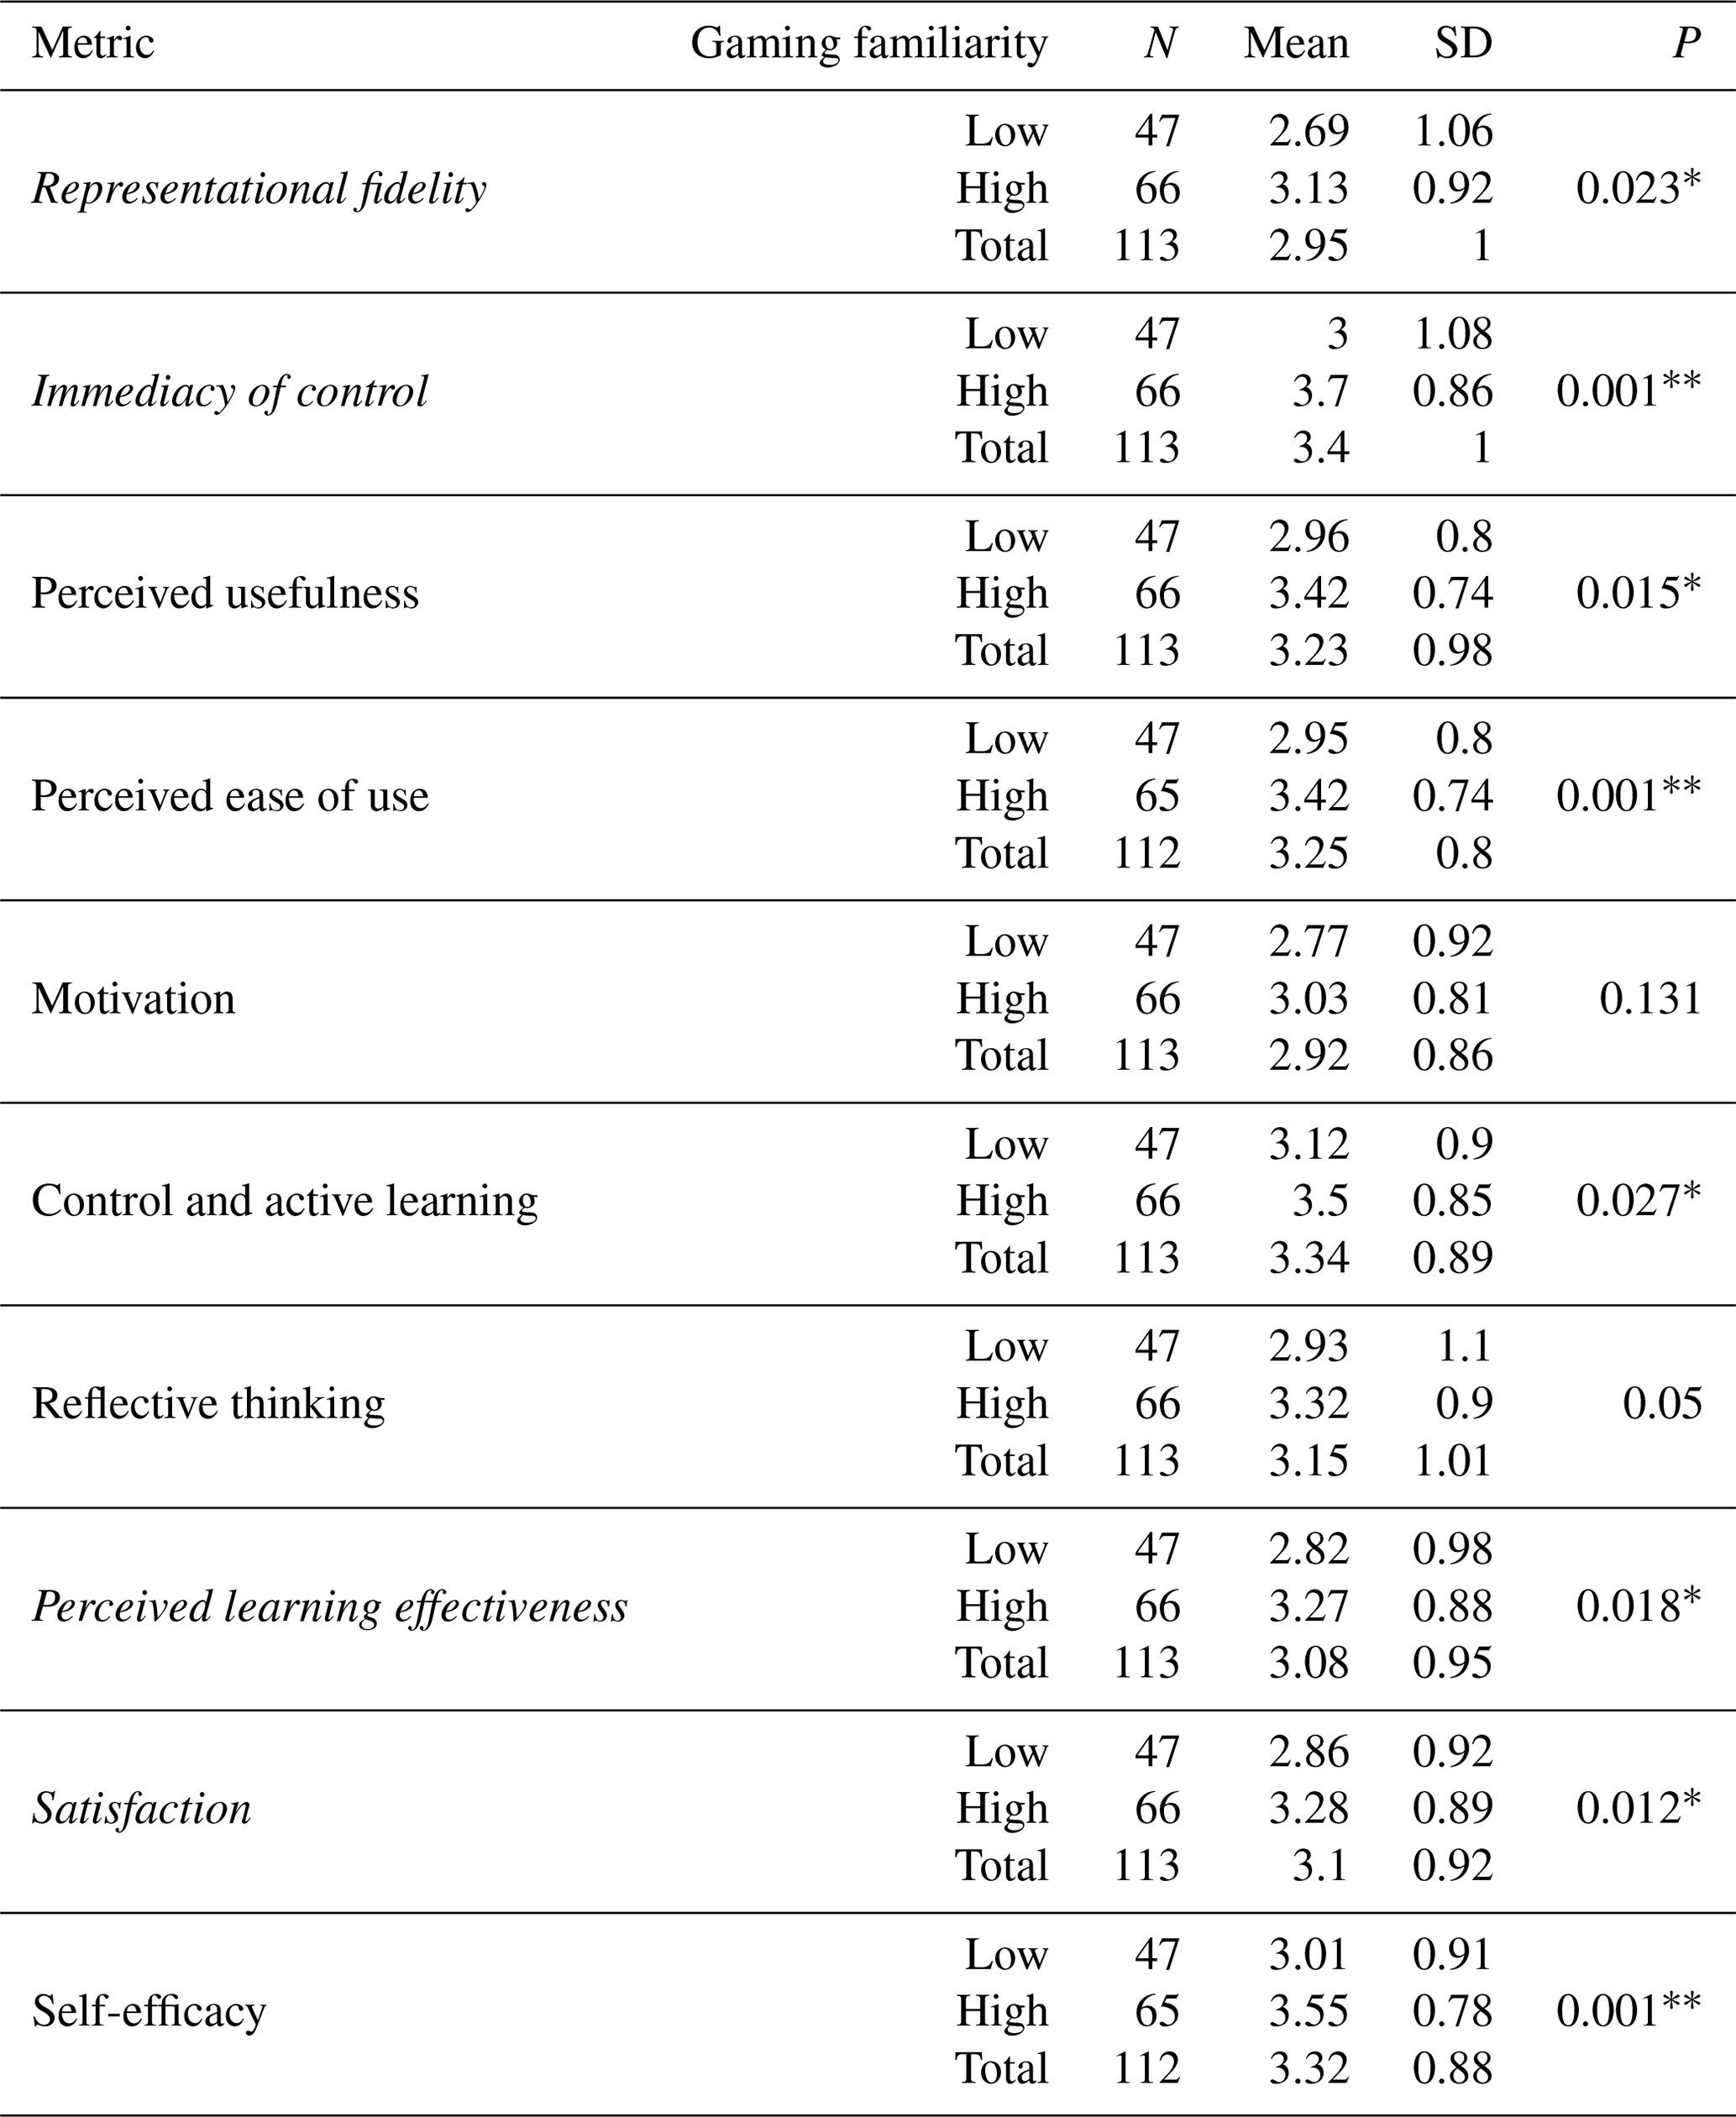
*P<0.05. . Italic text denotes metrics with a non-normal distribution for which a Mann–Whitney test was also used.
With respect to gender, our results indicate that male students (mean =3.48, SD = 0.83) reported significantly higher scores for self-efficacy than female students (mean =3.12, SD = 0.85), t(139)=2.329, p<0.05). No other significant differences for gender were shown to exist.
Finally, we were interested in investigating the possible interactions between geographical software/gaming familiarity and gender on the experience and learning metrics of participants. Two-way ANOVAs were conducted for this inquiry (see Table 5 for complete results) and revealed no statistically significant results.
Table 5Results of an ANOVA examining the interaction effects of geographical software familiarity and gender and the interaction effects of gaming familiarity and gender.

Total n for high and low software and gaming familiarity includes unspecified gender.
Our results indicate that the individual differences among students in light of their prior familiarity with navigating geographical software as well as their familiarity with gaming has a pronounced effect on their experiences. The unveiled trend indicates that higher familiarity with either geographical software or gaming leads to a significantly better experience with the SaD tool. Importantly, no effects of gender or significant interactions between software/game familiarity and gender on the experience and learning metrics of participants were observed.
3.2 Qualitative analysis
The results from our qualitative analysis of the two open-ended survey questions are reported in Tables 6 and 7 in the following. With respect to the first open-ended question, “How was your learning experience using this tool?”, almost 18 % of participants reported that the tool was easy to use whereas nearly 17 % reported that the tool was difficult to use (Table 6); for example, two contrasting participant comments are as follows: “it was easy to navigate” and “I felt confused and overwhelmed on the program almost the entire time I was using it”. Related to useability, almost 11 % of participants indicated that the controls for using the tool are not intuitive; for example, a participant stated that “it was very frustrating to try and rotate the compass to the right spot…”. Another 8 % indicated that the tool had a high and steep learning curve, with statements such as “firstly, I thought it is hard but then I got used to it”. Furthermore, about 12.5 % of participants had performance issues such as lagging and crashing, with comments including “it was a little slow, as it did not respond immediately to my inputs…”.
Table 6Qualitative analysis results for the open-ended learning experience question.

H-SF: high software familiarity; L-SF: low software familiarity; H-GF: high gaming familiarity; L-GF: low gaming familiarity.
Table 7Qualitative analysis results for the open-ended experience change across activities question.

Importantly, a little over 15 % of participants reported that the tool has increased their interest in learning the topic and 22 % reported that they perceived the tool as effective for learning, whereas only 6 % reported that they did not perceive the tool to be effective for learning. For example, two contrasting participant comments about the experience are as follows: “…I felt like I was doing actual work…” and “…I think that an in-person experience would be more effective to understand strike and dip…”. Related to the latter example, 11 % of participants indicated that they would prefer the real environment to the virtual for learning about this topic.
Finally, our results show that 49 % of the sampled population had an overall positive impression of the tool, whereas only 17 % and 13 % of participants reported an overall negative or overall mixed impression, respectively. Others did not express clear inclination.
A chi-square test of independence revealed that participants with low geographical software familiarity had a much higher overall negative impression (29.5 %) compared with those with a high geographical software familiarity (2.85 %), χ2(1, N=79) =9.52, p<0.01. The post hoc test with Bonferroni correction supported the fact that negative impressions are significantly more common for participants in the low-geographical-software-familiarity category (p<0.01). No other significant differences between the geographical software familiarity categories or game familiarity categories were observed.
With respect to the second question, “How did your experience…change between…mapping activities?”, 62.5 % of participants reported that their experience improved from the first to the second mapping activity (Table 7). More than half of those who reported an improvement to their experience explicitly mentioned that their experience was easier in the second mapping activity because of practicing in the first mapping activity. About 20 % of participants reported that their experience remained the same, and 18 % reported that their experience worsened from the first to the second mapping activity. From those who reported that their experience worsened, 12.4 % stated that the second mapping activity was more difficult and almost 8 % stated that they experienced more lag in the second mapping activity. A chi-square test of independence revealed no significant differences between geographical software familiarity categories or gaming familiarity categories and the codes. In summary, the qualitative analysis of the second question indicates that more exposure to the SaD tool improves the overall experience for users, but the fact that second activity is more demanding in terms of required graphic power resulted in more performance issues.
Using the SaD tool, an entirely remote introductory field-mapping exercise was successfully completed by students during the COVID-19 pandemic. This field-mapping exercise replicated exactly, in the digital world, the tasks the students would have normally completed in an in-person lab: measuring strike and dip of staged “outcrops”, using those data to assemble a map, and interpreting the geologic history of that “region”. Using traditional aspects in a new way, this environment not only taught students how to visualize the orientation of strike and dip on a rock plane but also how to correctly line up a compass using the RHR convention. It also challenged students to conceptualize and infer overall geologic relationships using the measurements that they took at each individual 3D outcrop model. From a teaching perspective, the SaD tool also provides three distinct advantages: (1) the time required to set up a staged beginner mapping area is conserved; due to the lower time requirements of the method, (2) multiple mapping environments can be explored by the students (e.g., “practice” Map 1 followed by “real” Map 2) with different levels of challenge (e.g., bumper cubes vs. bumper rocks) available to facilitate individualized learning; and (3) the bumper setting flagging incorrect measurements provides the opportunity for self-correction. In a regular face-to-face introductory mapping lab, there is realistically only time to set up one staged mapping environment; during the exercise, the instructor is also trying to assist individual students with a wide range of issues from using their left hand, to holding the compass upside down, to having made and mapped several incorrect measurements without realizing their error. Therefore, SaD dramatically increased efficient instruction through error flagging alone.
Both quantitative and qualitative results suggest that the students generally reacted positively to the SaD tool. Further, qualitative results suggest that SaD was an effective learning instrument for the mapping exercise, as participants reported an increase in understanding of strike and dip from Map 1 to Map 2. These findings are in agreement with those from the earlier pilot study (n=11) using the same software (Bursztyn et al., 2021) and suggest that SaD can be considered an effective learning instrument. The quantitative results indicate that students familiar with other geographical software or gaming software had a much better experience in light of representational fidelity, immediacy of control, perceived usefulness, perceived ease of use, control and active learning, perceived learning effectiveness, satisfaction, and self-efficacy compared with those who were unfamiliar. This is important, as it suggests that introducing students to virtual learning environments more frequently will have positive effects on their learning experience.
Although the results of the qualitative analysis are valuable on their own, when considering the prior individual experiences of users in relation to their open-ended feedback, interesting themes emerge. When comparing participants in the high-geographical-software-familiarity group to those in the low-geographical-software-familiarity group, we see that those in the high-familiarity group perceived the tool to be much easier to use and the controls to be more intuitive. Similarly, participants in the high-familiarity group experienced less performance issues and had a less steep learning curve. It was also the case that participants in this group had a lower tendency to claim preference for the real environment over the virtual one, and these participants determined the tool to be effective for learning at much higher rates than those in the low-familiarity group. The high-geographical-software-familiarity group reported a much higher overall positive impression and a much lower overall negative impression of the tool. Finally, a very similar trend is seen when comparing participants of high and low gaming familiarity. Apart from performance issues and the learning curve, in almost all the other metrics, participants in the high-gaming-familiarity group reported a much better experience than those in the low-gaming-familiarity group. The qualitative results align with the quantitative results, which further strengthens the conclusion that students with higher geographical software familiarity and, to some degree, gaming familiarity gained more both cognitively and psychologically from their SaD experience. Our results corroborate observations made in other experiments evaluating the importance and impact of prior familiarity with similar software on the experiences and performance of learners in virtual environments (Bagher et al., 2021). Importantly, the absence of effects of gender on the participants' experience and learning metrics suggests an equitable learning experience across gender demographics.
To further explore some of the feedback received through the open-ended questions, we address comments geared towards issues with usability, fidelity to real-world environments, and limitations with software.
4.1 Usability and fidelity to learning mapping in the real world
Notably, most of the negative comments with the SaD tool are with regard to lag and frustration of becoming familiar with the settings and controls (Tables 5, 6) and not the sometimes confusing aspect of taking and interpreting strike and dip measurements. Within this lab, the 3D virtual outcrops presented had easy-to-determine strike planes. Because the RHR convention was represented with a digital right hand that could be manipulated, users could easily determine dip direction and, therefore, the angle. Furthermore, because participants were using the tool with the beginner bumper setting, they were alerted to any incorrect measurements instantaneously.
In the field, without a perfectly staged 3D outcrop, it is sometimes difficult to determine the true strike of a lithologic unit; therefore, it is easy to accidentally measure an apparent plane instead of a true one. Although no “lag time” is associated with field mapping (except perhaps prolonged snack breaks), good, easily determinable strike and dip outcrops are not always abundant. This forces introductory students to learn and practice strike and dip on outcrops that are overly complicated for new learners. For example, Appalachian State University students must travel 1–2 h each way to the Valley and Ridge Province where they learn how to map in “sedimentary” units that are, in reality, slightly metamorphosed metasedimentary rocks which sometimes have slight foliation or crystallization. Furthermore, the region is heavily deformed with outcrop–regional sized folds and faults. Finding appropriate outcrops for introductory students is difficult, and those that are found are on steep terrain and, therefore, not wholly accessible.
Interestingly enough, most of the comments made about the reactiveness of the controls are variations of comments heard as an instructor from students in the field. For example, “Initially I didn't know how to use it, so it was frustrating….” and “…At first it was a bit overwhelming, but with some instruction it became much easier and quicker to use…”. This is a common comment from students at the end of the semester in a field methods course. Another comment, “It was very frustrating to try and rotate the compass to the right spot…” or “…I struggled with getting everything in place each time…”, is a staple in regards to placing the compass when students first get into the field. The comment regarding only seeing one strike and dip measurement at a time (“…was not effective in learning because I was only able to see one strike dip at a time and could not figure out how they related to each other spacially [sic]…”) is also not an uncommon struggle in the field. Most places do not have kilometer-long outcrops in which to visualize the structures of the whole area. One must actively map each individual strike and dip measurement one at a time, only interpreting the structures once there are enough points across the map to put together the geologic story. Similarly, SaD users may also view their “map” with the World Map feature (Fig. 2c) and visualize the region in its entirety. Lastly, the comment “I felt confused and overwhelmed on the program almost the entire time I was using it” is so common in the field that many instructors address this as a known occurrence, and the statement is frequently countered with some version of “You may be lost the majority of the time, the key is to recognize when you are “found” and to fill in the gaps.”
Despite the participants in this study having never actually mapped geology before, let alone in a real-world environment, there were several confident comments that in person experience would be more effective for learning and alleviating confusion than the SaD tool. These comments are difficult to address with their “the grass is always greener” perspective. This type of perspective was seen in a study by Stumpf et al. (2008), who found that students exposed to an in-person only field trip claimed preference for the virtual version whereas students in the virtual field trip group decreed the opposite.
The thought that nothing can compare with a real-world field trip is predominant among some geologists, but it is one that is exclusive and unimaginative. With the development of realistic virtual desktop environments, iVR experiences, and platforms like Sketchfab and Open Topography, along with public access to texture and material designers like Substance by Adobe, it is becoming more possible and pertinent to develop virtual environments that mimic real-world structures and, therefore, to advance their value for replicating place- or discovery-based learning (e.g., O'Connor and Domingo, 2017; Atit et al., 2020; Nesbit et al., 2020; Parong and Mayer, 2020; Riquelme et al., 2020; Wu et al., 2020). With iVR, users can even navigate through and interact with virtual environments in a very realistic way, which we suggest is also valuable in discovery-based learning (e.g., Liu et al., 2020; Parong and Mayer, 2020; Wu et al., 2020; Métois et al., 2021).
The results of this study point to a mix of positive evaluation and room for improvements of the SaD tool. Considering that SaD is still evolving, it is expected to receive comments related to usability issues from the participants. Such comments can help us better identify the shortcomings of this tool and plan for future improvements. It is important to emphasize that our results also indicate that a high number of participants perceived the tool as useful for their learning, and the overall impression of the tool is positive.
4.2 Limitations and future work
4.2.1 Procedural limitations
For this study, SaD was used in a single lab session following an earlier workbook-style mapping exercise. Although all students were assigned the earlier mapping exercise, only those who completed it had it returned and available for their reference during the subsequent SaD lab activity. Furthermore, it is unclear how many students, if any, referred back to this exercise for reminders or guidance during the SaD exercise. Because the SaD lab was administered during a single lab session, Map 1 (the practice map) was made optional to alleviate the pressure of potential time constraints. Consequently, not all students completed the practice map prior to the main assignment (Map 2). The small-scale pilot study (Bursztyn et al., 2021) built in two work and submission sessions to the exercise with instructor feedback following the first “practice” mapping activity. We were unable to follow this procedure due to curriculum scheduling complications for the present study, and this limitation resulted in students either opting to not complete the first mapping exercise or completing both with the pressure of time constraints.
Within the dVR experience itself, participants were limited to using the SaD tool restricted to the beginner bumper cubes setting. With bumper cubes, incorrect measurements are flagged; however, students do not know why they are wrong or how to correct themselves. It will be important to develop the SaD tool to include adaptive interventions such as individualized embedded hints and mapping guidance that would facilitate the learning experience of beginner mappers using the bumper settings. In VR environments, it is feasible to implement adaptive learning strategies, such as adaptive interventions, hints, and feedback (Peirce and Wade, 2010; Zaharias et al., 2012), in addition to more dynamic strategies in the form of difficulty and learning content adjustments within the learning experience (Hocine et al., 2014; Streicher and Smeddinck, 2016). Such strategies can support personalized experiences for learners exhibiting different levels of abilities and competencies in relation to the learning experience. In the case of our bumper settings, adaptive interventions might provide feedback on the nature of the error the user has made. It will also be important to study the effect of including such adaptive interventions into the learning environment, both on student learning and on user experience.
Finally, from an individual differences perspective, the exclusion of ethnicity from the participant questionnaire survey was an oversight not realized until too late in the procedure to be corrected. Critically examining individual differences in the context of the learning experience will continue to be of utmost importance moving forward. Furthermore, in this study, we did not collect the scores from the student work. Individual differences are not only important to consider for the useability of the instrument, but they are also critical to examine the effect that the tool has on student learning.
4.2.2 Technical limitations
Several students experienced technical difficulties including their computers crashing, the SaD tool lagging, and difficulty maneuvering within the virtual environment. Between the pilot study (Bursztyn et al., 2021) and this study, we tried to address the lagging concern, knowing that many students would not have access to gaming computers with high-powered video cards. Visual lag can be reduced by minimizing the complexity of the 3D rock models through reducing the number of polygons for each 3D model. However, the trade-off in this regard is that the 3D models with reduced polygons will at some point become no longer recognizable as particular rock types. We have since been exploring other avenues such as applying detailed texture maps over simplified geometries. Through the use of programs such as Adobe Substance, highly detailed textures can be created that give the appearance of complex 3D geometry, many of which are digital twins for diagnostic rock textures. These textures can then be applied to 3D models with simple geometry (such as cubes) while retaining the visual appearance and detail of highly complex 3D models but without creating lag.
Beyond the students' technical difficulties, we also recognize that the interaction fidelity of maneuvering in a 2D dVR environment representing a complex 3D natural environment is limited. Navigation within such an environment is complex and requires training (key combinations, mouse and/or trackpad to maneuver and position the compass vs. walking up to a surface and using one's hands). On the other hand, it has been shown that virtual environments, especially developed for web-based distribution and mobile devices, can remove barriers to accessibility and create a culture of inclusion in geoscience classrooms (O'Sullivan and Kearney, 2018; Chenrai and Jitmahantakul, 2019). In recent years, field experiences have been critically looked at from different perspectives. To name some of the prominent challenges: field trips pose troubling accessibility issues excluding students with disabilities but also students who cannot afford to participate due to time or financial constraints. Field work is further challenged by an increasing awareness of harassment that is happening in the field, which is often targeting women and minority students and faculty who do not conform to the stereotypical mainstream conceptions of fieldwork, that is, it is a white, male-dominated domain. Marín-Spiotta et al. (2020) call out this issue, comparing it to the “Vegas Rule”, criticizing the understanding that “what happens in the field, stays in the field”. For the diversity of students who self-select out of geoscience programs to avoid the physical and/or emotional burden of required field-mapping experiences, the promise of virtual mapping with digital twin environments such as provided by SaD may provide a solution that facilitates their access, safety, and also retention.
In light of the new openness to virtual experiences, it is essential to critically look at the opportunities (i.e., breaking down long-standing barriers of accessibility and inclusion) and challenges that remote learning offers to Earth educators. To establish remote learning opportunities as alternative pathways in geoscience education, we need tools as well as empirical studies that critically examine the opportunities, the challenges, and the feasibility of virtual learning experiences. Many studies remain anecdotal (e.g., Marshall et al., 2021), but it is time to establish research frameworks and to connect place-based education with established assessments and practices in virtual and immersive learning (Klippel et al., 2020b; Petersen et al., 2020). Immersive virtual reality (iVR) is inherently a 3D, spatial medium (Maceachren and Brewer, 2004) and, therefore, offers a natural interface to all representations of data that, too, are 3D in nature.
The COVID-19 pandemic has imposed an increased need for remote and online education. The infrastructure, however, to equip every student with a headset to experience iVR was not in place, nor would it have been feasible with rapid implementation of massive remote learning and abiding by physical distancing restrictions. Although our research goals are ultimately to address the advancement of the science of immersive experiences, there are still technological constraints which we addressed by seizing the opportunity to conduct an exploratory study with a web-based desktop virtual environment. We believe that with immersive VR technology becoming widely accessible, we can achieve both accessibility and natural interactivity. Immersive VR offers 3D-in-3D interfaces which are ideal for representing the 3D data of geological structures as well as realizing the 3D interactions of measuring them (e.g., positioning a compass on a planar surface). The iVR interface of SaD has been developed this spring, and we intend to leverage this version of the tool to evaluate place-based learning and 3D interactions within that environment in the coming fall semester.
Research on virtual learning environments has shown that the immersive, interactive, and 3D nature of iVR can potentially reduce the performance gap between students with high and low spatial abilities (Simpson et al., 2017; Lages and Bowman, 2018), which have been shown critical for STEM education (Newcombe, 2010). Immersive 3D visualizations can demonstrate the extent of landscapes and geological features in a form that is beneficial for students to develop spatial thinking, as they closely mirror everyday perceptual experience (Simpson, 2020). This mirroring capability is important in the context of the current study where students expressed preference for a more real-world experience. In addition, current iVR technology allows for the integration of high-fidelity perceptual information (e.g., position, orientation, shape, size, or motion) and additional abstract information (e.g., video, graphs, and text) into a single virtual environment, which would enable the teaching of complex geological concepts through understandable visual demonstrations (Bowman et al., 2003). Such explicit graphical presentations might act as a “cognitive prosthetic” for students with lower spatial ability (Mayer and Sims, 1994; Höffler and Leutner, 2011; Jamieson et al., 2014; Zhao et al., 2020); that is, low-ability learners could gain a particular benefit from accessing an information-rich iVR environment, as they have difficulty mentally constructing their own representation when learning about geological features and processes from the textbook or a traditional field trip alone. This is also important for the present study, as it has been shown that low-spatial-ability learners can benefit more from a desktop VR application in comparison with high-spatial-ability learners (Lee et al., 2009). Future empirical evaluations of SaD comparing immersive vs. non-immersive instances will include a stronger focus on spatial abilities.
The SaD tool continues to be developed and evolve with each iteration into becoming a more realistic digital twin for teaching field geology technique. The next steps for this tool are mapped out and are focused on creating 3D models that mirror real-world lithologic features (including, but not limited to, individual sand grains, identifiable fossils, foliation, and crystalline textures). As a community, we are ever closer to creating complete, realistic virtual environments for an inclusive and accessible geology field class with world-class “outcrops” that mimic those one sees in the classic geology field camps and trips hosted in the western United States.
Table A1Questionnaire used to evaluate participant demographics and experiences with the Strike and Dip tool.
The SaD tool is available from https://sites.psu.edu/virtualfieldtrips/strike-and-dip/ (last access: 29 January 2022) (Masters et al., 2020). Additionally, a developer log is available from https://sites.psu.edu/bartonmasters/sad-strike-and-dip-links/ (last access: 29 January 2022) (Masters et al., 2020) and is maintained by Bart Masters. The data are available via FigShare at https://doi.org/10.6084/m9.figshare.19233372 (Bursztyn et al., 2022).
NB, HR, and AK conceived the experiment in collaboration with PS and BM, who developed and programmed the SaD software. NB created the lab exercise. Analyses were conducted by PS, JH, JZ, and JOW in collaboration with AK. The manuscript was written by NB, PS, HR, AK, and JH. HR created the figures. All authors discussed the results and manuscript narrative as well as contributing substantially to the editing process.
The contact author has declared that neither they nor their co-authors have any competing interests.
Publisher’s note: Copernicus Publications remains neutral with regard to jurisdictional claims in published maps and institutional affiliations.
This article is part of the special issue “Virtual geoscience education resources”. It is not associated with a conference.
The authors would like to thank Peter La Femina of The Pennsylvania State University and his teaching assistants for performing this lab in his Geosc 001 – Physical Geology laboratory. We would also like to thank Mahda Bagher for creating the survey used to gather the data used in this paper.
This paper was edited by Simon Buckley and reviewed by two anonymous referees.
Alles, M. and Riggs, E. M.: Developing a process model for visual penetrative ability, in: Qualitative Inquiry in Geoscience Education Research, edited by: Feig, A. D. and Stokes, A., 756 Geological Society of America Special Paper 474, p. 63–80, https://doi.org/10.1130/2011.2474(06), 2011.
Almquist, H., Stanley, G., Blank, L., Hendrix, M., Rosenblatt, M., Hanfling, S., and Crews, J.: An Integrated Field-Based Approach to Building Teachers' Geoscience Skills, Journal of Geoscience Education, 59, 31–40, 2018.
Andrews, G. D., Labishak, G., Brown, S., Isom, S. L., Pettus, H. D., and Byers, T.: Teaching with Digital 3D Models of Minerals and Rocks, GSA Today, 30, 42–43, 2020.
Atit, K., Uttal, D. H., and Stieff, M.: Situating space: using a discipline-focused lens to examine spatial thinking skills, Cognitive research: principles and implications, 5, 19, https://doi.org/10.1186/s41235-020-00210-z, 2020.
Bagher, M. M., Sajjadi, P., Wallgrün, J. O., La Femina, P. C., and Klippel, A.: Move The Object or Move The User: The Role of Interaction Techniques on Embodied Learning in VR, Front. Virtual Real., 2, 695312, https://doi.org/10.3389/frvir.2021.695312, 2021.
Bangera, G. and Brownell, S. E.: Course-based undergraduate research experiences can make scientific research more inclusive, CBE-Life Sci. Edu., 13, 602–606, 2014.
Barab, S. and Dede, C.: Games and Immersive Participatory Simulations for Science Education: An Emerging Type of Curricula, J. Sci. Educ. Technol., 16, 1–3, 2007.
Bethune, K.: Changing Trends and Rethinking Geoscience Education in the Context of a Global Crisis, Geosci. Ca., 47, 167–169, https://doi.org/10.12789/geocanj.2020.47.164, 2020.
Bowman, D. A. and McMahan, R. P.: Virtual reality: How much immersion is enough?, Computer, 40, 36–43, 2007.
Bowman, D. A., North, C., Chen, J., Polys, N. F., Pyla, P. S., and Yilmaz, U.: Information-rich virtual environments, Proceedings of the ACM Symposium on Virtual Reality Software and Technology, ACM, New York, NY, 1–3 October 2003, 81 p., https://doi.org/10.1145/1008653.1008669, 2003.
Bursztyn, N., Shelton, B., Walker, A., and Pederson, J.: Increasing Undergraduate Interest to Learn Geoscience with GPS-based Augmented Reality Field Trips on Students' Own Smartphones, GSA Today, 27, 4–10, 2017.
Bursztyn, N., Goode, R., and McDonough, C.: “I Felt Like a Scientist!”: Accessing America's National Parks on Every Campus, in: America's Largest Classroom: What We Learn from Our National Parks, edited by: Thompson, J. and Houseal, A., Berkeley, University of California Press, 151–166, https://doi.org/10.1525/9780520974555-019, 2020.
Bursztyn, N., Riegel, H., Sajjadi, P., Masters, B., Zhao, J., Huang, J., Bagher, M., Wallgrun, J., and Klippel, A.: Fostering Geological Thinking Through Virtual Strike and Dip Measurements, in: 2021 IEEE Conference on Virtual Reality and 3D User Interfaces Abstracts and Workshops (VRW), virtual conference (online) 27 March – 2 April 2021, 303–308, https://doi.org/10.1109/VRW52623.2021.00061, 2021.
Bursztyn, N., Sajjadi, P., Riegel, H., Huang, J., Wallgrün, J. O., Zhao, J., Masters, B., and Klippel, A.: SaD Data.csv. figshare, [data set], https://doi.org/10.6084/m9.figshare.19233372.v1, 2022.
Cawood, A. J. and Bond, C. E.: eRock: An Open-Access Repository of Virtual Outcrops for Geoscience Education, GSA Today, 29, 36–37, https://doi.org/10.1130/GSATG373GW.1, 2018.
Chenrai, P. and Jitmahantakul, S.: Applying Virtual Reality Technology to Geoscience Classrooms, Review of International Geographical Education Online, 9, 577–590, 2019.
Cunningham, T. D. and Lansiquot, R. D.: Modeling Interdisciplinary Place-Based Learning in Virtual Worlds: Lessons Learned and Suggestions for the Future, in: Interdisciplinary Perspectives on Virtual Place-Based Learning, edited by: Lansiquot, R. D. and MacDonald, S. P., Springer International Publishing, Cham, 133–145, https://doi.org/10.1007/978-3-319-66014-1_7, 2019.
Dalgarno, B.: The potential of 3D virtual learning environments: A constructivist analysis, Electronic Journal of Instructional Science and Technology, 5, 3–6, 2002.
Dede, C.: Immersive interfaces for engagement and learning, Science, 323, 66–69, 2009.
Dolphin, G., Dutchak, A., Karchewski, B., and Cooper, J.: Virtual field experiences in introductory geology: Addressing a capacity problem, but finding a pedagogical one, Journal of Geoscience Education, 67, 114–130, 2019.
Elkins, J. and Elkins, N. M. L.: Teaching geology in the field: Significant geoscience concept gains in entirely field-based introductory geology courses, Journal of Geoscience Education, 55, 126–132, https://doi.org/10.5408/1089-9995-55.2.126, 2017.
Gagnier, K. M., Atit, K., Ormand, C. J., and Shipley, T. F.: Comprehending 3D Diagrams: Sketching to Support Spatial Reasoning, Top. Cogn. Sci., 9, 883–901, 2017.
Giles, S., Jackson, C., and Stephen, N.: Barriers to fieldwork in undergraduate geoscience degrees, Nature Reviews Earth & Environment, 1, 77–78, 2020.
Hall, T., Healey, M., and Harrison, M.: Fieldwork and disabled students: Discourses of exclusion and inclusion, J. Geogr. Higher Educ., 28, 255–280, 2004.
Hocine, N., Gouaich, A., and Cerri, S. A.: Dynamic Difficulty Adaptation in Serious Games for Motor Rehabilitation, in: International Conference on Serious Games, GameDays 2014, Darmstadt, Germany, 1–5 April 2014, https://doi.org/10.1007/978-3-319-05972-3_13, 115–128, 2014.
Höffler, T. N. and Leutner, D.: The role of spatial ability in learning from instructional animations – Evidence for an ability-as-compensator hypothesis, Comput. Hum. Behavior, 27, 209–216, 2011.
IJsselsteijn, W. A. and Riva, G.: Being there: The experience of presence in mediated environments, in: Being there: Concepts, effects and measurements of user presence in synthetic environments, edited by: IJsselsteijn, W. A., Riva, G., and Davide, F., IOS, Amsterdam, Oxford, 3–16, ISBN 1586033018, 2003.
Jamieson, M., Cullen, B., McGee-Lennon, M., Brewster, S., and Evans, J. J.: The efficacy of cognitive prosthetic technology for people with memory impairments: a systematic review and meta-analysis, Neuropsychol. Rehabil., 24, 419–444, 2014.
Johnson-Glenberg, M. C.: Immersive VR and Education: Embodied design principles that include gesture and hand controls, Front. Robot. AI, 5, 27, https://doi.org/10.3389/frobt.2018.00081, 2018.
Klingenberg, S., Jørgensen, M. L., Dandanell, G., Skriver, K., Mottelson, A., and Makransky, G.: Investigating the effect of teaching as a generative learning strategy when learning through desktop and immersive VR: A media and methods experiment, Brit. J. Educ. Technol., 51, 2115–2138, 2020.
Klippel, A., Zhao, J., Jackson, K. L., La Femina, P., Stubbs, C., and Oprean, D.: Transforming earth science education through immersive experiences – delivering on a long held promise, J. Educ. Comput. Res., 57, 1745–1771, https://doi.org/10.1177/0735633119854025, 2019.
Klippel, A., Zhao, J., Oprean, D., Wallgrün, J. O., Stubbs, C., La Femina, P., and Jackson, K. L.: The value of being there: toward a science of immersive virtual field trips, Virtual Reality, 24, 753–770, https://doi.org/10.1007/s10055-019-00418-5, 2020a.
Klippel, A., Zhao, J., Sajjadi, P., Wallgrün, J. O., Bagher, M. M., and Oprean, D.: Immersive place-based learning – An extended research framework, in: 2020 IEEE Conference on Virtual Reality and 3D User Interfaces Abstracts and Workshops (VRW), Piscataway, NJ, Atlanta GA, 22–26 March 2020, 449–454, https://doi.org/10.1109/VRW50115.2020.00095, 2020b.
Kolb, D. A.: Experiential learning. Experience as the source of learning and development, Second edition, Pearson Education Inc., Upper Saddle River, New Jersey, ISBN 13 9780133892406, 2015.
Lages, W. S. and Bowman, D. A.: Move the Object or Move Myself?: Walking vs. Manipulation for the Examination of 3D Scientific Data, Frontiers in ICT, 5, 236 pp., 2018.
Lansiquot, R. D. and MacDonald S. P. (Eds.): Interdisciplinary Perspectives on Virtual Place-Based Learning, Springer International Publishing, Cham, https://doi.org/10.1007/978-3-319-66014-1, 2019.
Lee, E. A.-L., Kok, W. W., and Chun, C. F.: How does desktop virtual reality enhance learning outcomes? A structural equation modeling approach, Computers and Education, 55, 1424–1442, https://doi.org/10.1016/j.compedu.2010.06.006, 2010.
Liu, R., Wang, L., Lei, J., Wang, Q., and Ren, Y.: Effects of an immersive virtual reality-based classroom on students' learning performance in science lessons, Brit. J. Educ. Technol., 51, 2034–2049, https://doi.org/10.1111/bjet.13028, 2020.
Lopes, R. and Bidarra, R.: Adaptivity challenges in games and simulations: A survey, IEEE T. Comp. Intel. AI, 3, 85–99, 2011.
Maceachren, A. M. and Brewer, I.: Developing a conceptual framework for visually-enabled geocollaboration, Int. J. Geogr. Inf. Sci., 18, 1–34, https://doi.org/10.1080/13658810310001596094, 2004.
Madon, M.: Geoscience activities amid the Covid-19 pandemic-opportunities for cross-discipline learning and knowledge-sharing, Warta Geologi, 46, 113–120, https://doi.org/10.7186/wg462202012, 2020.
Marín-Spiotta, E., Barnes, R. T., Berhe, A. A., Hastings, M. G., Mattheis, A., Schneider, B., and Williams, B. M.: Hostile climates are barriers to diversifying the geosciences, Adv. Geosci., 53, 117–127, https://doi.org/10.5194/adgeo-53-117-2020, 2020.
Marshall, M. S. and Higley, M. C.: Multi-scale virtual field experience: sedimentology and stratigraphy of Grand Ledge, Michigan, USA, Geosci. Commun., 4, 461–474, https://doi.org/10.5194/gc-4-461-2021, 2021.
Masters, B., Riegel, H., Bursztyn, N., and Alexander, K.: Strike and Dip – GEOSCIENCE VIRTUAL FIELD TRIPS [code], https://sites.psu.edu/virtualfieldtrips/strike-and-dip/ (last access: 29 January 2022), 2020.
Mayer, R. E. and Sims, V. K.: For whom is a picture worth a thousand words? Extensions of a dual-coding theory of multimedia learning, J. Educ. Psychol., 86, 389–401, 1994.
McComas W. F. (Ed.): The Language of Science Education: An Expanded Glossary of Key Terms and Concepts in Science Teaching and Learning, Sense Publishers and Imprint: Sense Publishers, Rotterdam, The Netherlands, ISBN 978-94-6209-495-6, 2014.
Mead, C., Buxner, S., Bruce, G., Taylor, W., Semken, S., and Anbar, A. D.: Immersive, interactive virtual field trips promote science learning, Journal of Geoscience Education, 67, 131–142, https://doi.org/10.1080/10899995.2019.1565285, 2019.
Métois, M., Martelat, J.-E., Billant, J., Andreani, M., Escartín, J., Leclerc, F., and the ICAP team: Deep oceanic submarine fieldwork with undergraduate students: an immersive experience with the Minerve software, Solid Earth, 12, 2789–2802, https://doi.org/10.5194/se-12-2789-2021, 2021.
Morales, N., O'Connell, K. B., McNulty, S., Berkowitz, A., Bowser, G., Giamellaro, M., and Miriti, M. N.: Promoting inclusion in ecological field experiences: Examining and overcoming barriers to a professional rite of passage, The Bulletin of the Ecological Society of America, 101, e01742, https://doi.org/10.1002/bes2.1742, 2020.
Moysey, S. M. J. and Lazar, K. B.: Using virtual reality as a tool for field-based learning in the earth sciences, in: Interdisciplinary Perspectives on Virtual Place-Based Learning, edited by: Lansiquot, R. D. and MacDonald, S. P., Springer International Publishing, Cham, 99–122, ISBN 978-3030324704, 2019.
Nesbit, P. R., Boulding, A. D., Hugenholtz, C. H., Durkin, P. R., and Hubbard, S. M.: Visualization and sharing of 3D digital outcrop models to promote open science, GSA Today, 30, 4–10, 2020.
Newcombe, N. S.: Picture This: Increasing math and science learning by improving spatial thinking, J. Educ. Psychol., 34, 29–35, https://doi.org/10.1037/A0016127, 2010
O'Connor, E. A. and Domingo, J.: A Practical Guide, With Theoretical Underpinnings, for Creating Effective Virtual Reality Learning Environments, Journal of Educational Technology Systems, 45, 343–364, 2017.
Olson, S. and Riordan, D. G.: Engage to Excel: Producing One Million Additional College Graduates with Degrees in Science, Technology, Engineering, and Mathematics, Report to the President, Executive Office of the President, ERIC Number: ED541511, 1–130, 2012.
Orion, N. and Hofstein, A.: Factors that influence learning during a scientific field trip in a natural environment, J. Res. Sci. Teach., 31, 1097–1119, 1994.
Ormand, C. J., Shipley, T. F., Tikoff, B., Harwood, C. L., Atit, K., and Boone, A. P.: Evaluating Geoscience Students' Spatial Thinking Skills in a Multi-Institutional Classroom Study, Journal of Geoscience Education, 62, 146–154, 2014.
O'Sullivan, M. and Kearney, G.: Virtual Reality (VR) Technology: Empowering Managers to Reduce and Eliminate Accessibility Barriers for People with Autism Spectrum Disorders, St. Health T., 256, 253–261, 2018.
Parong, J. and Mayer, R. E.: Cognitive and affective processes for learning science in immersive virtual reality, J. Comput. Assist. Learn., 37, 226–241, 2020.
Peirce, N. and Wade, V.: Personalised Learning for Casual Games: The “Language Trap” Online Language Learning Game, in: 4th European Conference on Game Based Learning (ECGBL), Copenhagen, Denmark, 21–22 October 2010, Bente Meyer, Academic Publishing, 306–315, http://hdl.handle.net/2262/41244 (last access: 25 January 2022), 2010.
Petersen, G. B., Klingenberg, S., Mayer, R. E., and Makransky, G.: The virtual field trip: Investigating how to optimize immersive virtual learning in climate change education, Br. J. Educ. Technol., 51, 2099–2115, https://doi.org/10.1111/bjet.12991, 2020.
Powers, A. L.: An evaluation of four place-based education programs, J. Environ. Educ., 35, 17–32, 2004.
Pyle, E. J.: The evaluation of field course experiences: A framework for development, improvement, and reporting, in: Field Geology Education: Historical perspectives and modern approaches: GSA Special Paper 461, edited by: Whitmeyer, S. J., Mogk, D. W., and Pyle, E. J., Geological Society of America, Boulder, CO, 341–356, https://doi.org/10.1130/2009.2461(26), 2009.
Riquelme, A., Pastor, J. L., Cano, M., Tomás, R., Benavente, D., and Jordá, L.: Digitalisation of rock specimens and outcrops for training., in: ISRM International Symposium-EUROCK June, virtual conference (online), 14–19 June, ISRM-EUROCK-2020-055, ISBN 978-82-8208-072-9, 2020.
Rotzien, J. R., Sincavage, R., Pellowski, C., Gavillot, Y., Cooper, S., Shannon, J., Sawyer, J. F., Yildiz, U., Filkorn, H., and Uzunlar, N.: Field-based geoscience education during the COVID-19 pandemic: Planning and execution, Part II: Geological Society of America, GSA 2020 Connects Online, online conference, 25–28 October 2020, abstract no. 359659, https://doi.org/10.1130/abs/2020AM-359659, 2020.
Rotzein, J. R., Sincavage, R., Pellowski, C., Gavillot, Y., Filkorn, Cooper, S., Shannon, J., Yildiz, U., Sawyer, F., and Uzunlar, N.: Field-Based Geoscience Education during the COVID-19 Pandemic: Planning, Execution, Outcomes, and Forecasts, GSA Today, 31, 4–10, https://doi.org/10.1130/GSATG483A.1, CC-BY-NC, 2021.
Sajjadi, P., van Broeckhoven, F., and de Troyer, O.: Dynamically adaptive educational games: A new perspective, in: International Conference on Serious Games, GameDays 2014, Darmstadt, Germany, 1–5 April 2014, https://doi.org/10.1007/978-3-319-05972-3_8, 71–76, 2014
Sajjadi, P., Zhao, J., Wallgrün, J. O., Fatemi, A., Zidik, Z., La Femina, P., Fuhrman, T., and Klippel, A.: The effect of virtual agent gender and embodiment on the experiences and performance of students in Virtual Field Trips, in: 2020 IEEE International Conference on Engineering, Technology and Education, Piscataway, New Jersey: IEEE, 8–11 December 2020, https://doi.org/10.1109/TALE48869.2020.9368457, 1–8, 2020.
Schreier, M.: Qualitative content analysis in practice, Sage Publications, London, ISBN 9781849205931, 2012.
Semken, S., Ward, E. G., Moosavi, S., and Chinn, P. W. U.: Place-based education in geoscience: Theory, research, practice, and assessment: Theory, Research, Practice, and Assessment, Journal of Geoscience Education, 65, 542–562, 2018.
Shipley, T. F., Tikoff, B., Ormand, C., and Manduca, C.: Structural geology practice and learning, from the perspective of cognitive science, J. Struct. Geol., 54, 72–84, 2013.
Shute, V. J., Wang, L., Greiff, S., Zhao, W., and Moore, G.: Measuring problem solving skills via stealth assessment in an engaging video game, Comput. Hum. Behav., 63, 106–117, 2016.
Simpson, M., Zhao, J., and Klippel, A.: Take a walk: Evaluating movement types for data visualization in immersive virtual reality, Workshop on Immersive Analytics (IA), at IEEE VIS, Phoenix, Arizona, USA, 1 October 2017.
Simpson, M.: Scale and Space: Representations in Immersive Virtual Reality, PhD, University Park, PA USA, https://etda.libraries.psu.edu/catalog/17663mbs278 (last access: 25 January 2022), 2020.
Slater, M.: Measuring Presence: A Response to the Witmer and Singer Presence Questionnaire, Presence: Teleoperators and Virtual Environments, 8, 560–565, 1999.
Streicher A. and Smeddinck J. D.: Personalized and Adaptive Serious Games, in: Entertainment Computing and Serious Games, Lecture Notes in Computer Science, edited by: Dörner, R., Göbel S., Kickmeier-Rust, M., Masuch, M., and Zweig, K., Springer, Cham, 9970, 332–377, https://doi.org/10.1007/978-3-319-46152-6_14, 2016.
Stumpf II, R. J., Douglass, J., and Dorn, R. I.: Learning Desert Geomorphology Virtually versus in the Field, J. Geogr. Higher Educ., 32, 387–399, https://doi.org/10.1080/03098260802221140, 2008.
Tibaldi, A., Bonali, F. L., Vitello, F., Delage, E., Nomikou, P., Antoniou, V. E., Becciani, U., Van Wyk de Vreis, B., Krokos, M., and Whitworth, M.: Real world–based immersive Virtual Reality for research, teaching and communication in volcanology, B. Volcanol., 82, 38, https://doi.org/10.1007/s00445-020-01376-6, 2020.
Titus, S. and Horsman, E.: Characterizing and Improving Spatial Visualization Skills, Journal of Geoscience Education, 57, 242–254, 2009.
Vandewaetere, M., Cornillie, F., Clarebout, G., and Desmet, P.: Adaptivity in Educational Games: Including Player and Gameplay Characteristics, International Journal of Higher Education, 2, 2, https://doi.org/10.5430/ijhe.v2n2p106, 2013.
Whitmeyer, S. J. and Dordevic, M.: Creating virtual geologic mapping exercises in a changing world, Geosphere, 17, 226–243, https://doi.org/10.1130/GES02308.1, 2021.
Winn, W.: A conceptual basis for educational applications of virtual reality. Technical Publication R-93-9, Human Interface Technology Laboratory of the Washington Technology Center, Seattle: University of Washington, http://www.hitl.washington.edu/projects/education/winn/winn-paper.html (last access: 25 January 2022), 1993.
Witmer, B. G. and Singer, M. J.: Measuring presence in virtual environments: A presence questionnaire, Presence, 7, 225–240, 1998.
Wu, B., Yu, X., and Gu, X.: Effectiveness of immersive virtual reality using head-mounted displays on learning performance: A meta-analysis, Brit. J. Educ. Technol., 51, 1991–2005, https://doi.org/10.1111/bjet.13023, 2020.
Zaharias, P., Mehlenbacher, B., Law, E. L.-C., and Sun, X.: Evaluating user experience of adaptive digital educational games with Activity Theory, Int. J. Hum.-Comput. St., 70, 478–497, 2012.
Zhao, J. and Klippel, A.: Scale-unexplored opportunities for immersive technologies in place-based learning, 2019 IEEE Conference on Virtual Reality and 3D User Interfaces (VR), 23–27 March 2019, https://doi.org/10.1109/VR.2019.8797867, 155–162, 2019.
Zhao, J., Simpson, M., Wallgrün, J. O., Sajjadi, P., and Klippel, A.: Exploring the Effects of Geographic Scale on Spatial Learning, Cognitive research: principles and implications, 5, 14 pp., 2020.