the Creative Commons Attribution 4.0 License.
the Creative Commons Attribution 4.0 License.
 | 08 Apr 2021
Schools of all backgrounds can do physics research – on the accessibility and equity of the Physics Research in School Environments (PRiSE) approach to independent research projects
Martin O. Archer
Societal biases are a major issue in school students' access to and interaction with science. School engagement programmes in science from universities, like independent research projects, which could try and tackle these problems are, however, often inequitable. We evaluate these concerns applied to one such programme, Physics Research in School Environments (PRiSE), which features projects in space science, astronomy, and particle physics. Comparing the schools involved with PRiSE to those of other similar schemes and UK national statistics, we find that PRiSE has engaged a much more diverse set of schools with significantly more disadvantaged groups than is typical. While drop-off occurs within the protracted programme, we find no evidence of systematic biases present. The majority of schools that complete projects return for multiple years with the programme, with this repeated buy-in from schools again being unpatterned by typical societal inequalities. Therefore, a school's ability to succeed in independent research projects appears independent of background within the PRiSE framework. Qualitative feedback from teachers shows that the diversity and equity of the programme, which they attribute to the level of support offered through PRiSE's framework, is valued, and they have highlighted further ways of making the projects potentially even more accessible. Researcher involvement, uncommon in many other programmes, along with teacher engagement and communication are found to be key elements to success in independent research projects overall.


It has long been the case that the science, technology, engineering, and mathematics (STEM) sectors have shown, both within higher education and in the workforce, systemic biases against women, other non-male genders, those from ethnic minorities, and socially disadvantaged groups (e.g. Campaign for Science and Engineering, 2014). Inequalities are present even at the secondary or high school level, where students from under-represented or disadvantaged backgrounds, despite being interested in science, have fewer opportunities to engage with science both inside and outside of school (Hamlyn et al., 2020). These societal issues constitute major inequities on young people that influence their opportunities, self-perception, and, ultimately, subject and/or career choices. It is, therefore, important that STEM engagement programmes aim to equitably include students from these groups, taking into account all of the factors that might support or prevent their engagement.
Independent research projects are opportunities enabling school students to conduct open-ended investigations in science. While some independent research project initiatives specifically target traditionally under-represented groups (with many of these being in the USA), a recent global review (Bennett et al., 2016, 2018) found that, in general, there are equity issues relating to participation in such projects – they are relevant to all young people, but only a small minority are able to access them. The authors note that, despite emerging evidence that independent research projects can result in improved engagement and attitudes towards science amongst students from under-represented groups, further work is required to more fully explore the potential benefits of independent research projects on them.
Physics Research in School Environments (PRiSE) is a framework for independent research projects for 14–18-year-old school students that are based around cutting-edge physics research and mentored by active researchers (Archer, 2017; Archer et al., 2021). Unlike some citizen science initiatives with schools, which, due to their focus on answering specific science questions, can sometimes result in an inauthentic research experience focused around crowdsourcing (Bonney et al., 2009, 2016; Shah and Martinez, 2016), PRiSE, as a research-in-schools programme, was devised in an audience-focused way, with the benefits to participants being of primary importance (discussed in more detail in Archer et al., 2021). Thus far, the four PRiSE projects summarised in Table 1 have been developed at the Queen Mary University of London (QMUL) since 2014, and the framework is now being adopted by other institutions that are developing their own projects applied to their specific areas of physics research. The programme aims to equitably include significant numbers of students from demographic groups which are under-represented in higher education and STEM. Projects run from the start of the UK academic year, in September, to just before the spring or Easter break in March, a duration of approximately 6 months. The role of the teacher in these projects is chiefly one of encouraging their students to persist, providing what advice they can, and then communicating with the university. Teachers are not expected to fully manage the projects, which is why numerous modes of support are provided from active researchers who have the expertise and skills in the areas of each project. This support offered to students and teachers comes in the form of a suite of bespoke resources, along with the following intervention stages each year:
-
Assignment (June–July). Teachers sign their school up for a PRiSE project and are informed of the outcome before the summer break.
-
Kick-off (September–October). An introductory talk and hands-on workshop are given, either in school or as an evening event on university campus.
-
Visit (December–February). Researchers visit the schools to mentor students on their project work.
-
Comments (March). Researchers provide comments on students' draft presentations near the end of the project.
-
Conference (March). Students present their project work as either posters or talks at a student conference held on campus and attended by teachers, family, and researchers.
Any further ad hoc communication were given as needed and on an individual school basis. Evaluation has shown that all of these elements of support are almost equally important and necessary in the eyes of students and teachers (Archer et al., 2021). This paper assesses whether the approach taken and level of support provided by PRiSE enables schools from all backgrounds to participate and succeed in independent research projects. Section 2 investigates the diversity of schools that have participated in PRiSE, benchmarking them against UK national statistics and schools involved in other, similar programmes. We then investigate the retention of the schools in PRiSE, both within each academic year and across multiple years, in Sect. 3. Finally, feedback from teachers relating to diversity, accessibility, and equity are presented in Sect. 4. Impacts of the programme upon students, teachers, and schools, and whether these are potentially affected by background, are discussed in a companion paper (Archer and DeWitt, 2021).
As of March 2020, 67 schools have been involved in PRiSE. A full list of (anonymised) schools is given in Appendix A. Figure 1 demonstrates that these schools (blue) have been fairly broadly spread across greater London rather than being focused solely around Queen Mary (red). Schools targeting has been limited to London to enable researchers to build relationships with the schools via their in-person interactions throughout the 6 month projects. Most schools have participated directly with Queen Mary, though we note that some have been involved as a partnership of local schools (there have been 8 partnerships across 22 schools, as listed in Appendix A). Such partnerships could provide an additional support network to students and teachers and make interventions more efficient for researchers. However, we have found these partnerships to have been somewhat hit or miss so far within PRiSE – while kick-off events with all partner schools present have typically worked, following this, the schools have not always worked with their partners on the projects. Further investigation is required to understand what makes these partnerships work.
Figure 1Map of all schools involved with PRiSE (blue), with the Queen Mary University of London location shown in red. Source: ©Google Maps, 2020.
Here we evaluate the diversity of schools engaged in PRiSE. We limit this analysis to publicly available data concerning the schools and their local areas, and we did not collect any protected characteristics (such as gender or race) or sensitive information (such as socio-economic background) from the students involved. This was done for both ethical and practical reasons, bearing in mind that this is a schools engagement programme that is delivered and evaluated by physics researchers and not an educational research project in and of itself. For example, it was deemed that requiring students or their teachers to provide protected or sensitive information upfront would have risked some students, or indeed entire schools, leading them to decline to participate. This limits the conclusions that can be made to only the school level. However, it has been recognised that the clustering of students within schools results in students within the same school having more in common with each other than with students in different schools, which is an important consideration in the uptake of post-compulsory physics education, (Gill and Bell, 2011). While multilevel models could account for this hierarchy, this is beyond the scope of what is practical for PRiSE. We note that schools typically involve entire (or significant fractions of) cohorts of A-level physics students in PRiSE, and so, while we have no indication that PRiSE students differ in any substantive way from their schools' wider student-base, we cannot rule out that they may not necessarily be representative. Finally, since one of the aims of PRiSE is to impact on the teachers' practice and schools' STEM environments, school-level considerations are valuable in this context, regardless of the specific characteristics of the students engaged in PRiSE.
We benchmark school-level data against UK national statistics and schools listed on the websites of two other, similar UK-based programmes of research-based physics projects for schools, namely IRIS (2018, n=178) and HiSPARC (2018, n=22). While we also looked at schools involved with ORBYTS (2019) that specifically mention targeting disadvantaged groups, finding very similar results to PRiSE, with only 17 schools listed, there is a limited scope for detailed statistical comparison, and so we have omitted this programme here. We make no comment on the reasons behind the make-up of schools involved with different programmes, since this would require specific qualitative research into how each programme's provision model and targeting affects participation. Information about schools was first obtained from the “Get information about schools” database, formerly known (and henceforth referred to in this paper) as Edubase (Department for Education, 2018). For more information on the UK schools system, please see Appendix B. While all PRiSE and HiSPARC (High-School Project on Astrophysics Research with Cosmics) schools could be found in Edubase, only 154 of the listed IRIS (Institute for Research in Schools) institutions could be identified (based on UK postcodes).
Figure 2 shows the make-up of school categories (explained in Appendix B) from this database across the three programmes – showing little overall difference between them – in a chi-squared test of independence χ2(8)=8.45 corresponding to p=0.391. While none of the differences between the programmes are strictly statistically significant (using a difference in binomial proportions test) due to the relatively small numbers of schools compared to the population, it should be noted that IRIS features proportionally more independent schools than PRiSE (+0.10 absolute and 1.46× relative; p=0.107), HiSPARC involves more academies than PRiSE (+0.16 and 1.40×; p=0.260), and PRiSE works with more local-authority-maintained schools than both HiSPARC (+0.08 and 1.52×; p=0.418) and IRIS (+0.09 and 1.60×; p=0.147). However, it is clear that none of the programmes are truly representative of all schools nationally by category. This is also the case when looking at schools' admissions policies (again see Appendix B for further background). The 10±4 % of selective schools in PRiSE is more than the 1 % nationally listed in Edubase, though we note that both HiSPARC and IRIS feature even higher proportions of selective schools than PRiSE at 14±9 % (p=0.342) and 24±4 % (p=0.007) respectively, where the uncertainties refer to the standard Clopper and Pearson (1934) confidence interval in a binomial proportion (i.e. 68 %). To address the imbalances in school categories and admissions policies of PRiSE schools, as of 2019 we have implemented a policy that all independent and selective schools must partner with local state or girls' schools and include them in their project work. While this was something which some independent schools had voluntarily been doing previously, we encountered some resistance to this policy by a number of independent schools. Schools which refused the policy were not allowed to participate, even if they had worked with us previously. While several other schools agreed to the principle and tried to implement partnerships, some failed to do so due to them not being able to draw from existing local school partnerships, limited time from the application to the summer holidays, and poor communication between teachers at different schools. These schools were allowed to participate, with the expectation that they put further effort in to establish these partnerships for the next academic year, which they seemed willing to do.
Figure 2Distribution of school categories involved in IRIS (red), HiSPARC (yellow) and PRiSE (blue) projects compared to UK national statistics (grey). Error bars denote standard Clopper and Pearson (1934) intervals.
Beyond school type and admissions policy, we look at several other metrics for the backgrounds of the schools' students. We detail in Appendix C how we have combined various data sets in order to assess these. For PRiSE schools, these methods result in two different metric values for each school – one covering the school's full catchment area (the entire area from which they draw students) and another purely pertaining to the school's local census area (the immediate area surrounding the school's location). We consider the full catchment area data to be more reflective of a school's student base compared to the local data. For schools outside of London, however, we only have access to the local data. Note that the two types of data can result in rather different values for a school despite the underlying distributions across all London schools being similar (see Appendix C for further discussion). In Fig. 3, distributions of the gathered metrics are shown in two formats. The top panels display box plots depicting quantiles of the metric. Bottom panels depict kernel density estimates of the continuous probability distributions, where Gaussian kernels of optimal bandwidth from the Silverman (1986) rule have been applied to each data set. Standard confidence intervals are estimated by bootstrapping 1000 random realisations of the data (Efron and Tibshirani, 1993), taking quantiles of their resulting kernel density estimates (with the bandwidth fixed from before).

Figure 3Distributions of (a) students on free school meals, (b) higher education participation rate, (c) index of multiple deprivation score, and (d) ethnic minorities. Box plots in (a) and (b) have whiskers covering 10 %–90 %, boxes spanning 25 %–75 %, and bands depicting the standard confidence interval in the median. Panels (c) and (d) show kernel density estimates along with bootstrapped standard confidence intervals. Dashed lines indicate that only local data is used, which does not cover the schools' full catchment areas.
The first metric we consider is the percentage of students eligible for free school meals, an often-used, widening-participation criterion in the UK which can be found in Edubase. Free school meals are a statutory benefit available to school-aged children from families who receive other income-assessed government benefits and can be used as a proxy of the economic status of a school's students. Figure 3a shows that both HiSPARC and IRIS schools feature considerably lower free school meals percentages than the national statistics in terms of the location (e.g. median), scale (e.g. interquartile range), and shape (e.g. tail heaviness) of their distributions. In contrast, the kernel density estimate for PRiSE schools appear to tend towards higher percentages and be somewhat broader. We perform Wilcoxon rank sum tests, which test whether one sample is stochastically greater than the other (often interpreted as a difference in medians) since it is more conservative and suffers from fewer assumptions (e.g. normality and interval scaling) than two-sample t tests (Hollander and Wolfe, 1999; Gibbons and Chakraborti, 2011). These tests, however, reveal that, in terms of quantiles, PRiSE schools are merely consistent with the national distribution (an absolute +3 % and relative 1.26× difference in medians; p=0.708), as is also evident from the box plots. This means that PRiSE is serving schools with considerably more disadvantaged students than both HiSPARC (+7 % and 2.09×; p=0.033) and IRIS (+8 % and 2.18×; ) in this regard.
The second metric considered is the higher education participation rate (Fig. 3b), which measures how likely young people are to go on to higher education (e.g. university) based on where they live (Office for Students, 2018). All the programmes considered involve schools with students from areas with greater participation in higher education than is representative of the entire country, but they are largely similar to one another. This is not surprising for PRiSE, given that it is limited to London, since it has been noted that young people across London are generally more likely to access higher education than those elsewhere in the UK (Office for Students, 2018). However, the fact that PRiSE's results are similar to the two national programmes is perhaps surprising as HiSPARC lists no London schools and only 17±3 % of IRIS schools are in the greater London area. Therefore, one might expect these two programmes to have markedly lower participation rates in higher education than PRiSE purely due to this fact, which is not the case. Given that in-person interactions between researchers and schools are a critical part of the PRiSE model, the geographical reach of the Queen Mary programme will always be limited to London, and thus, it is difficult to effect much change on the higher education participation rate. The expansion of PRiSE to universities in other areas, however, may help address this in future.
The third metric used is the index of multiple deprivation (Ministry of Housing, Communities & Local Government, 2015), a UK government qualitative study of deprived areas in England's local councils by income, employment, health deprivation and disability, education, skills, and training, barriers to housing and services, crime, and living environment. Here we use the index of multiple deprivation scores (Fig. 3c), where higher scores indicate more deprivation. Averaged over each PRiSE school's catchment area, these scores are considerably higher than the national statistics (the median is +9.40 and 1.54× larger; ). This difference, however, disappears when using the local proxy, yielding, simply, a representative distribution (+1.50 and 1.09×; p=0.371). In contrast, IRIS schools again clearly favour fewer disadvantaged students than PRiSE (−6.56 and 0.65×; ) and, thus, also the national statistics (−5.07 and 0.71×, ), whereas these differences are perhaps only marginal for HiSPARC due to small numbers (−6.84 and 0.64×; p=0.142 compared to PRiSE; −5.35 and 0.69×; p=0.288 compared to national statistics).
The final metric used is the percentage of ethnic minorities (Fig. 3d) taken from census area data. The PRiSE programme features a very broad distribution, with much greater percentages of ethnic minorities than both the 13 % of all people from ethnic minorities across the UK (Office of National Statistics, 2011) and those from the areas covered by the other programmes. This is simply due to the fact that London is the most ethnically diverse region in the country. The distributions for IRIS and HiSPARC are very similar to one another, and while their distributions' location parameters are just less than the overall national statistic, they both feature greater ethnic diversity compared to the full distribution across all census areas (in the case of HiSPARC, this is not strictly statistically significant at +4 % absolute and 1.79× relative; p=0.056, which is likely due to small number statistics).
In terms of gender balance, a similar school- and/or area-level approach would not capture the known bias present in physics, where only 22 % of A-level physics students are female (Institute of Physics, 2018). Therefore, at kick-off meetings, the percentage of young women or girls involved in PRiSE at each school was observed (accurate to the nearest 10 %). The median of these is 40 %, though there has been considerable variation in the gender balance amongst schools. We have worked with 11 girls' schools (compared to just 8 boys' schools) to help address the gender balance across the programme. How this variation, on a school-by-school basis, compares to each schools' A-level cohorts or across all schools nationally is unknown as these data are not publicly available. IRIS, HiSPARC, and Original Research By Young Twinkle Students (ORBYTS) have not yet reported on the gender variations in their programmes.
To summarise, PRiSE has, to date, engaged with a much more diverse set of schools, with significantly more under-represented groups than other similar schemes, and reflects national statistics in most measures, sometimes even featuring higher proportions of under-served groups. Some work, however, needs to be done for PRiSE to be more representative in terms of schools' categories and admissions policies, which is currently being addressed. Future work could expand the evaluation of participation to go beyond school- and/or area-level metrics and investigate individual students' characteristics; however, this would require funding to commission such research by social scientists along with the necessary ethical approval.
It is natural to expect some drop-off in the participation of schools for a long-term and primarily extracurricular programme. We employ the branch of statistics known as survival analysis (Miller, 1997) to quantify the retention of schools throughout the PRiSE programme. In particular, we calculate both survival (the probability that a school is still involved with the programme at a certain stage) and hazard (the probability that a school still involved at a certain stage will drop out at the next stage) functions.
3.1 Across interventions
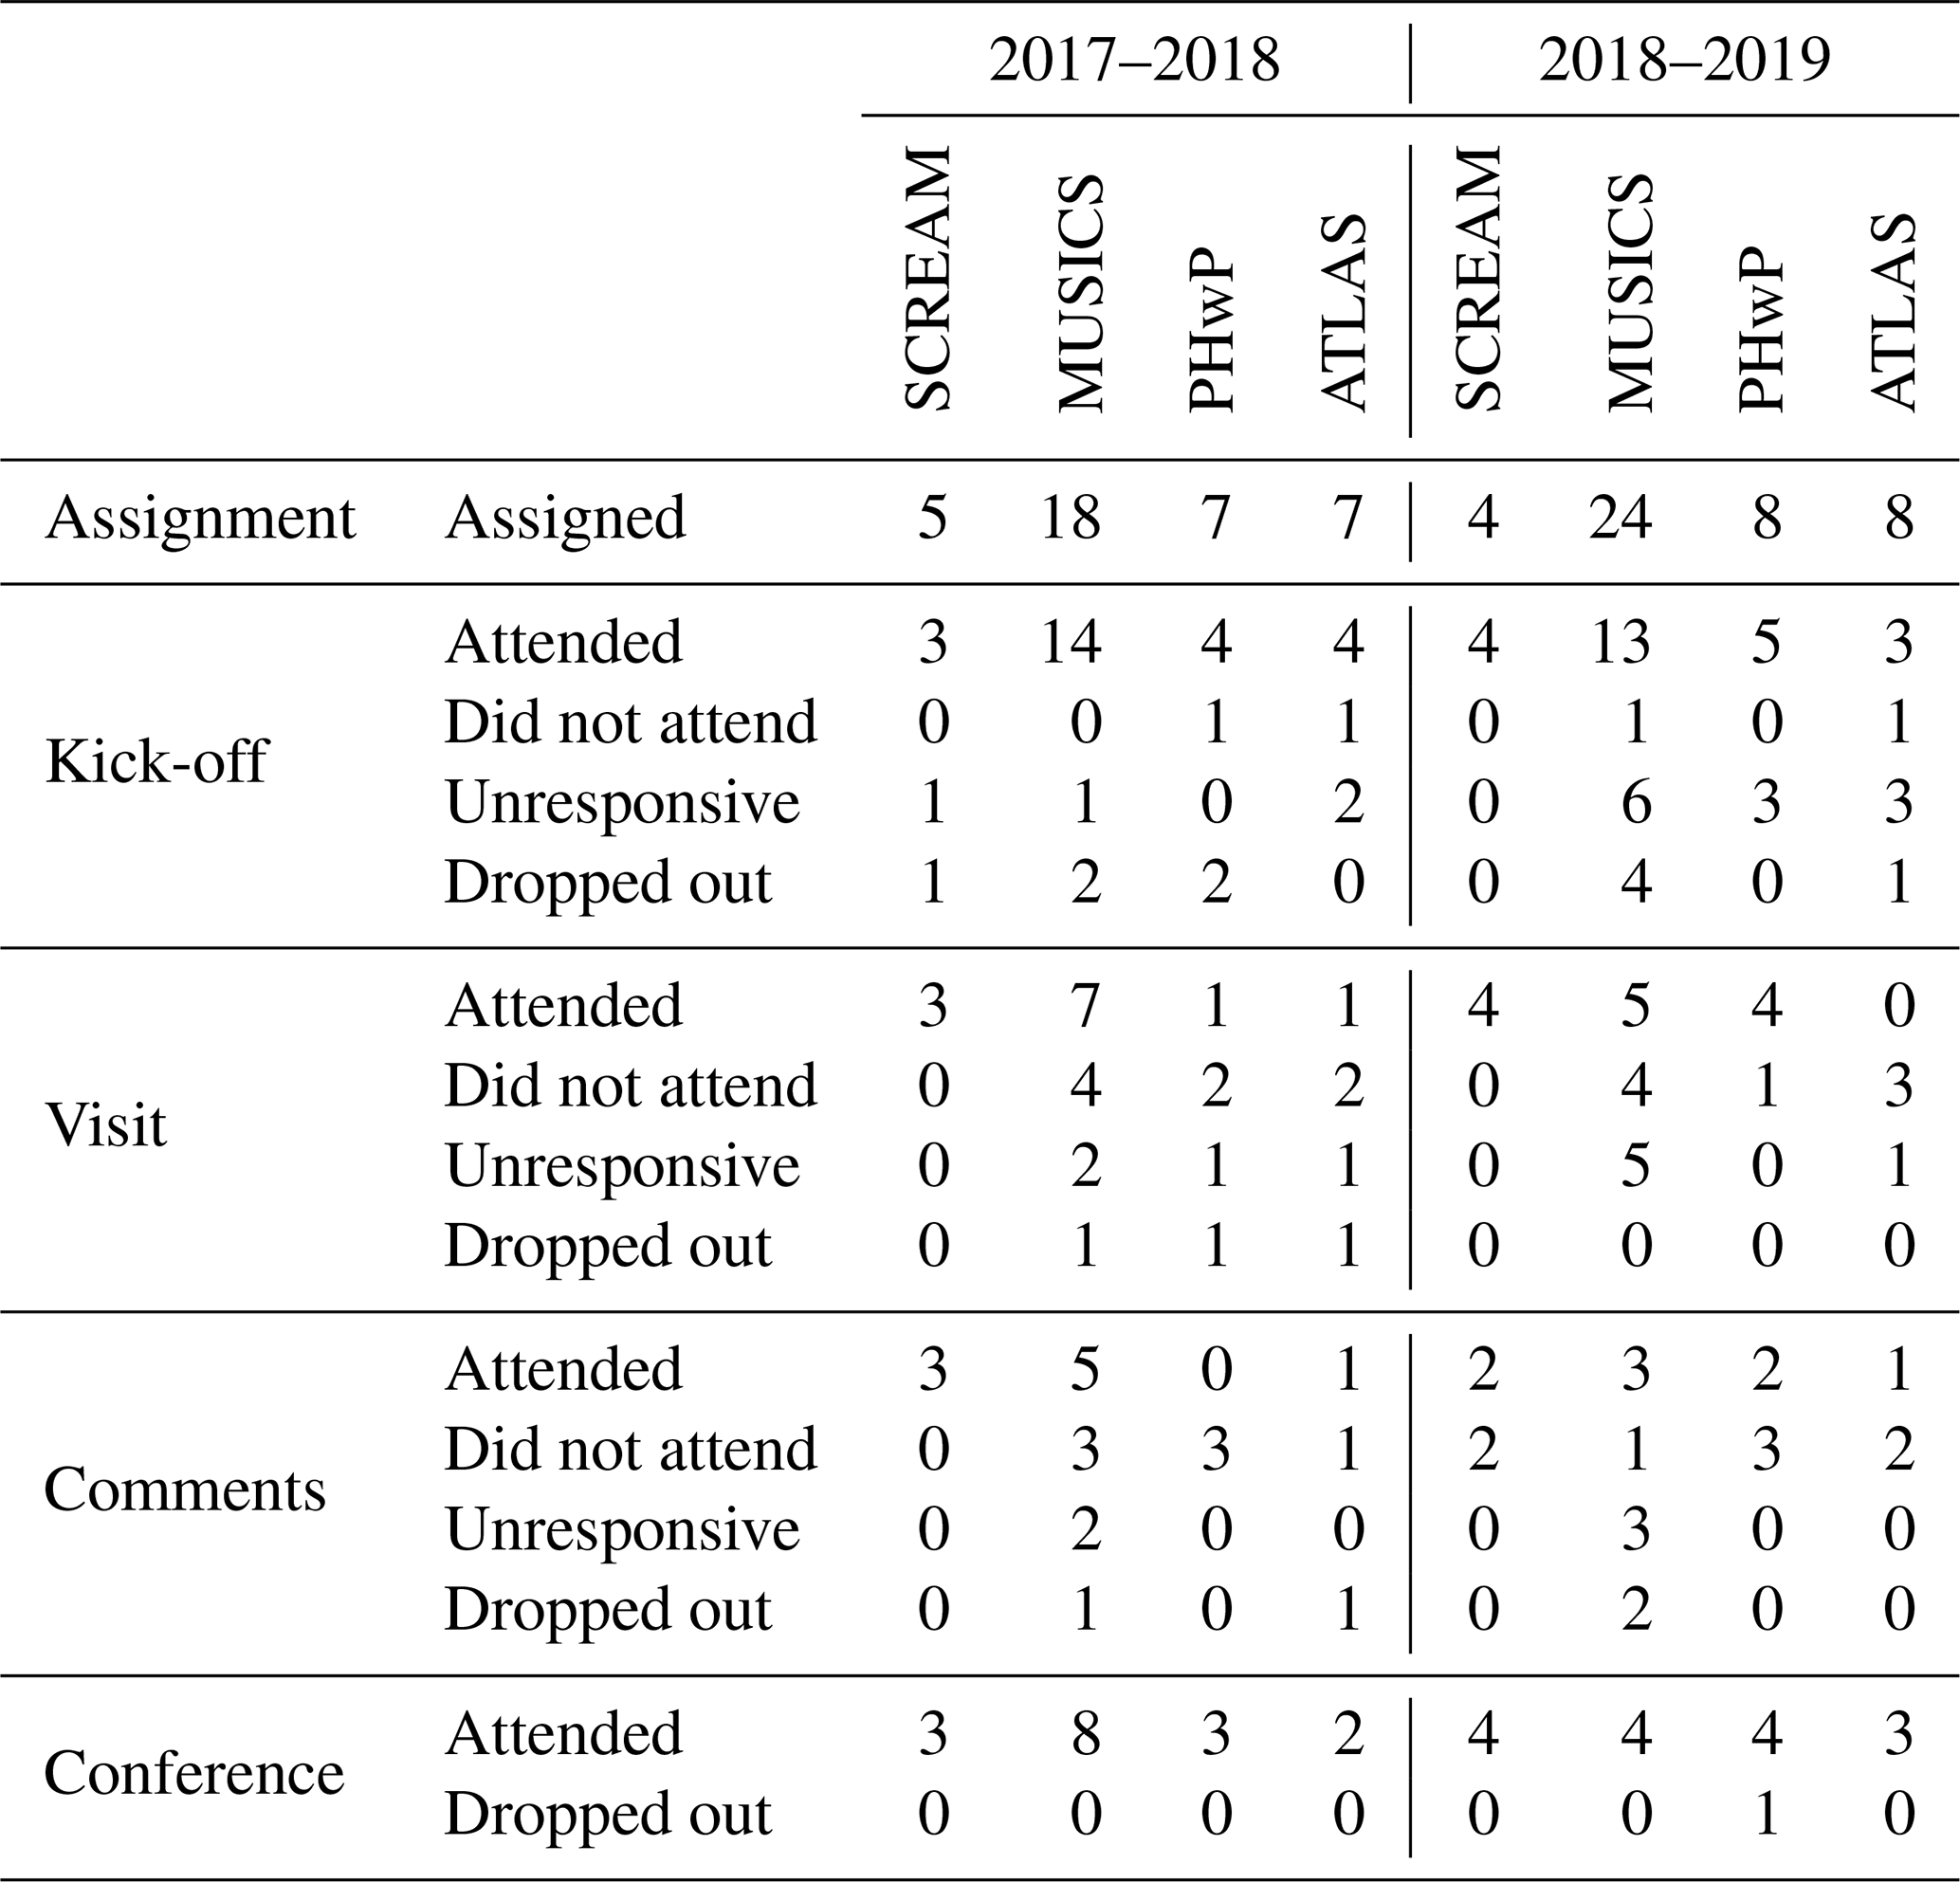
First, we assess the retention of schools across the intervention stages of the programme. This is done for academic years 2017–2018 and 2018–2019 only, since, before this, our data collecting was insufficient to track schools' retention throughout the different stages of the programme, and in 2019–2020 the programme was disrupted by the COVID-19 pandemic just before the comments stage, with the conference having to be postponed. In many cases in our results, an assumption has been made about when schools may have dropped out because, in 68±12 % of schools which drop out after the kick-off stage, the teachers do not inform us and simply no longer reply to our continuing emails (with little difference in this percentage across the different project stages). In these cases, we assume that schools dropped out at the earliest point that the teacher became unresponsive.
Figure 4 shows schools' retention, both by project (Fig. 4a) and year (Fig. 4b), across the different intervention stages. Overall, there is a fairly uniform drop-off rate between the kick-off, visit, and comments stages at 23±7 %, with a slightly higher drop-off from assignment to kick-off (33±5 %). Schools still involved by the comments stage almost certainly attend the conference. None of the other research-in-schools programmes have yet reported on retention within their programmes, and in general, little research into retention within (particularly free) programmes of multiple STEM interventions with schools exists. However, we note that the figures from PRiSE are at least consistent with another programme – those of the South East Physics Network (SEPnet) Connect Physics pilot (Hope-Stone Research, 2018). No overall differences across survival distributions in a log rank test (Machin et al., 2006) appear present by year (χ2(1)=0.60; p=0.441) or project (χ2(3)=4.28; p=0.232). When comparing different projects in the same year and the same projects in different years, there are differences in the survival and/or hazard functions to those shown in Fig. 4 (see data in Appendix D). One interpretation of the results shown might be that projects where schools are loaned equipment (i.e. SCREAM – Scintillator Cosmic Ray Experiments into Atmospheric Muons) are more likely to succeed. Past experience across SEPnet with the CERN@school (Conseil Européen pour la Recherche Nucléaire or European Organization for Nuclear Research) IRIS project does not support this hypothesis, however, since almost all SEPnet target schools that were loaned detectors ended up not using them (Dominic Galliano, personal communication, 2018). To prevent equipment going unused, the SCREAM project has been made open only to schools that have successfully undertaken a different project with us previously, which likely plays a factor in the results presented. In general, projects based around expensive equipment are not scalable, given funding limitations, so they would necessarily always have a limited reach.
Figure 4Schools' survival (top) and hazard (bottom) functions across interventions. Overall results in black; colours subdivide by (a) project and (b) year. Error bars denote standard Clopper and Pearson (1934) intervals.
While all intervention stages are offered to all schools, it should be noted that not all schools actively engaged in project work take advantage of them. A total of 7±4 % do not attend a kick-off, 39±9 % do not schedule a researcher visit, and 47±10 % do not solicit comments on their work. Schools which do not solicit a researcher visit are much more likely to subsequently drop out (41±14 %) compared to those that do (12±8 %). This highlights the importance of researcher involvement in the success of programmes, despite independent research projects in schools often not being supported by external mentors in general (Bennett et al., 2016, 2018). The other two intervention stages do not appear to be critical for schools' retention. First, in the case of the kick-off, this suggests that the resources provided are sufficient to still undertake project work. Second, while comments on draft presentations are valued by students and teachers, students are still able to produce work that can be presented at a conference without them.
In addition to equality in access, it is also important that programmes be equitable so that everyone has a fair chance of succeeding. We find no biases in the schools' ability to successfully complete a year by school category (χ2(4)=3.21; p=0.524), free school meals' percentage (+4 % absolute and 1.33× relative differences in medians of schools which do or do not complete a year; p=0.865), higher education participation rate (+2 % and 1.04×; p=0.677), indices of multiple deprivation (−4.30 and 0.86×; p=0.219), or ethnic diversity (−3 % and 0.93×; p=0.844). We do not perform this test for gender variation since the data are less reliable, as previously mentioned. Therefore, the typical societal barriers to STEM do not appear to affect schools' ability to succeed within the PRiSE framework.
We note that, as well as schools dropping out, even within those schools which complete a year, there is typically some reduction in the number of students that persist with project work. As our reporting only recorded total numbers of students by Key Stage (see Table B1 for more information) at events rather than on a school-by-school basis, we cannot calculate student retention rates for schools which received on campus kick-off events, since these involved multiple schools, some of which subsequently dropped out. Neglecting those schools, we find that, between 2015 and 2019, the overall retention rate from kick-off to conference was 56±3 % (n=321), though we note individual schools' rates varied widely with an interquartile range of 39 %–88 %, and seven schools (out of the 27 considered) retained all students throughout the programme. Similar to with participation, future work (subject to funding and ethics approval) could investigate the retention within PRiSE at the student level and whether this is also equitable.
3.2 Across years
We have seen considerable repeated buy-in from many schools over multiple years with PRiSE (see Appendix A for the data); thus, we also investigate retention across years. Figure 5 shows the overall results in black, where only schools which began work on projects are included. We note that, because the programme has been carefully grown since its inception, not all schools started at the same time, and this is why the survival function is not strictly decreasing; e.g. only six schools could have been involved for 5 years and just one for the full 6 years. Overall the drop-off rate is consistent year-on-year at 45±10 % per year (averaged over the first 2 years for which we have better statistics). Similar to before, there is unfortunately no suitable benchmark for comparison since no similar programmes have yet reported on university–school relationships built over several years of running the same programme. Again, we find no significant differences in schools which participate in PRiSE for multiple years, compared to those which do not, in terms of school category (χ2(4)=2.22; p=0.695), free school meals' percentage (+5 % absolute and 1.43× relative; p=0.327), higher education participation rate ( −1 % and 0.97×; p=0.458), indices of multiple deprivation (+0.75 and 1.03×; p=0.371) or ethnic diversity (+12 % and 1.32×; p=0.111). However, as shown in Fig. 5, schools which have been able to successfully complete at least 1 year (green) are far more likely to participate again, at 70±10 %, compared to those which have not (purple), at 26±11 %. It is important, though, that the latter value is not negligible, showing that some schools are willing to try again. So far (not including academic year 2019–2020), there have been three out of a potential seven second attempts where this has led to subsequent success, with these largely being run with the same teacher rather than a different one.
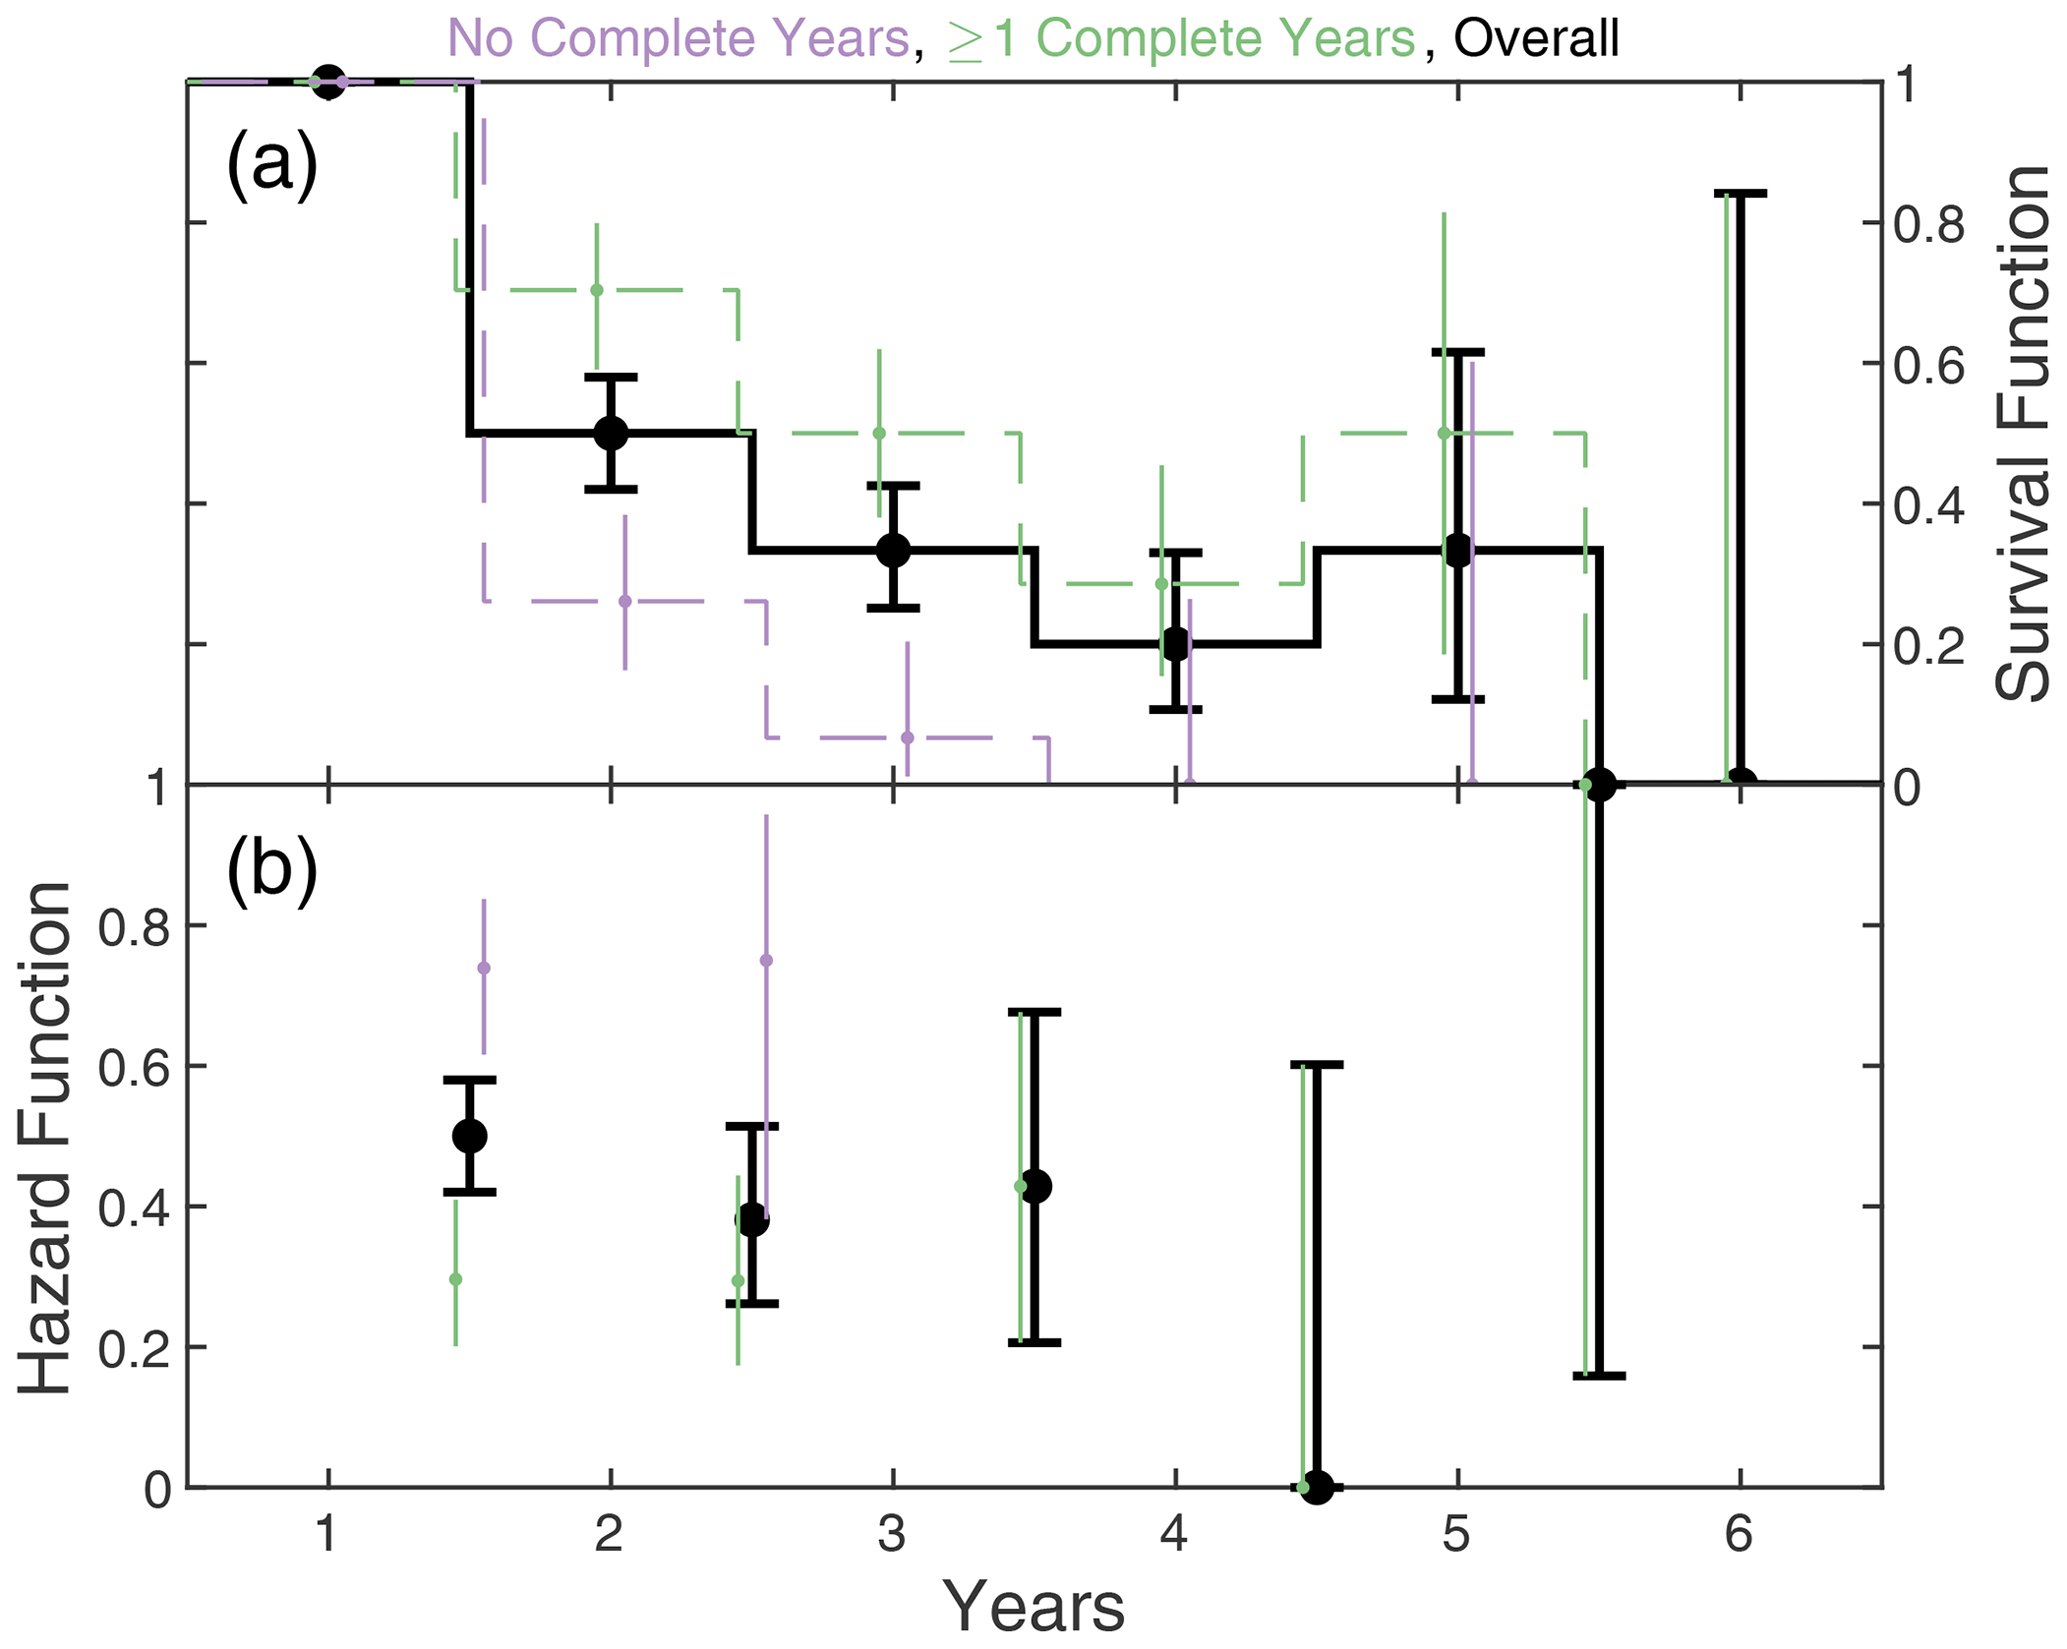
Figure 5Schools' survival (a) and hazard (b) functions across years in a similar format to Fig. 4. Overall results in black, with colours subdividing by schools which did (green) and did not (purple) complete at least 1 year.
The link between the success of schools in completing projects and the continued involvement of schools across several years is highlighted further in Fig. 6. This shows, for each school listed in Appendix A, the number of years that they completed PRiSE projects against the total number of years they started them. Note that we do not include academic year 2019–2020 in either dimension due to disruption by the COVID-19 pandemic. It appears that schools predominantly tend to lie near the two possible extremes (solid lines) of either completing projects every year they were involved or not completing the projects at all. The average rate and its uncertainty (constructed by treating each school as a single binomial experiment and combining them using Bayes' theorem) are also shown in the figure in red as a function of the number of years involved. A clear trend can be seen in that completion rates increased as schools were involved for more years. However, one must be careful in interpreting possible causation behind this correlation. While there are examples where a second attempt at a PRiSE project did lead to improved retention, in most cases it is likely that schools which succeed are simply more likely to participate again, whereas those that (for whatever reason) do not succeed are understandably less likely to continue in subsequent years.
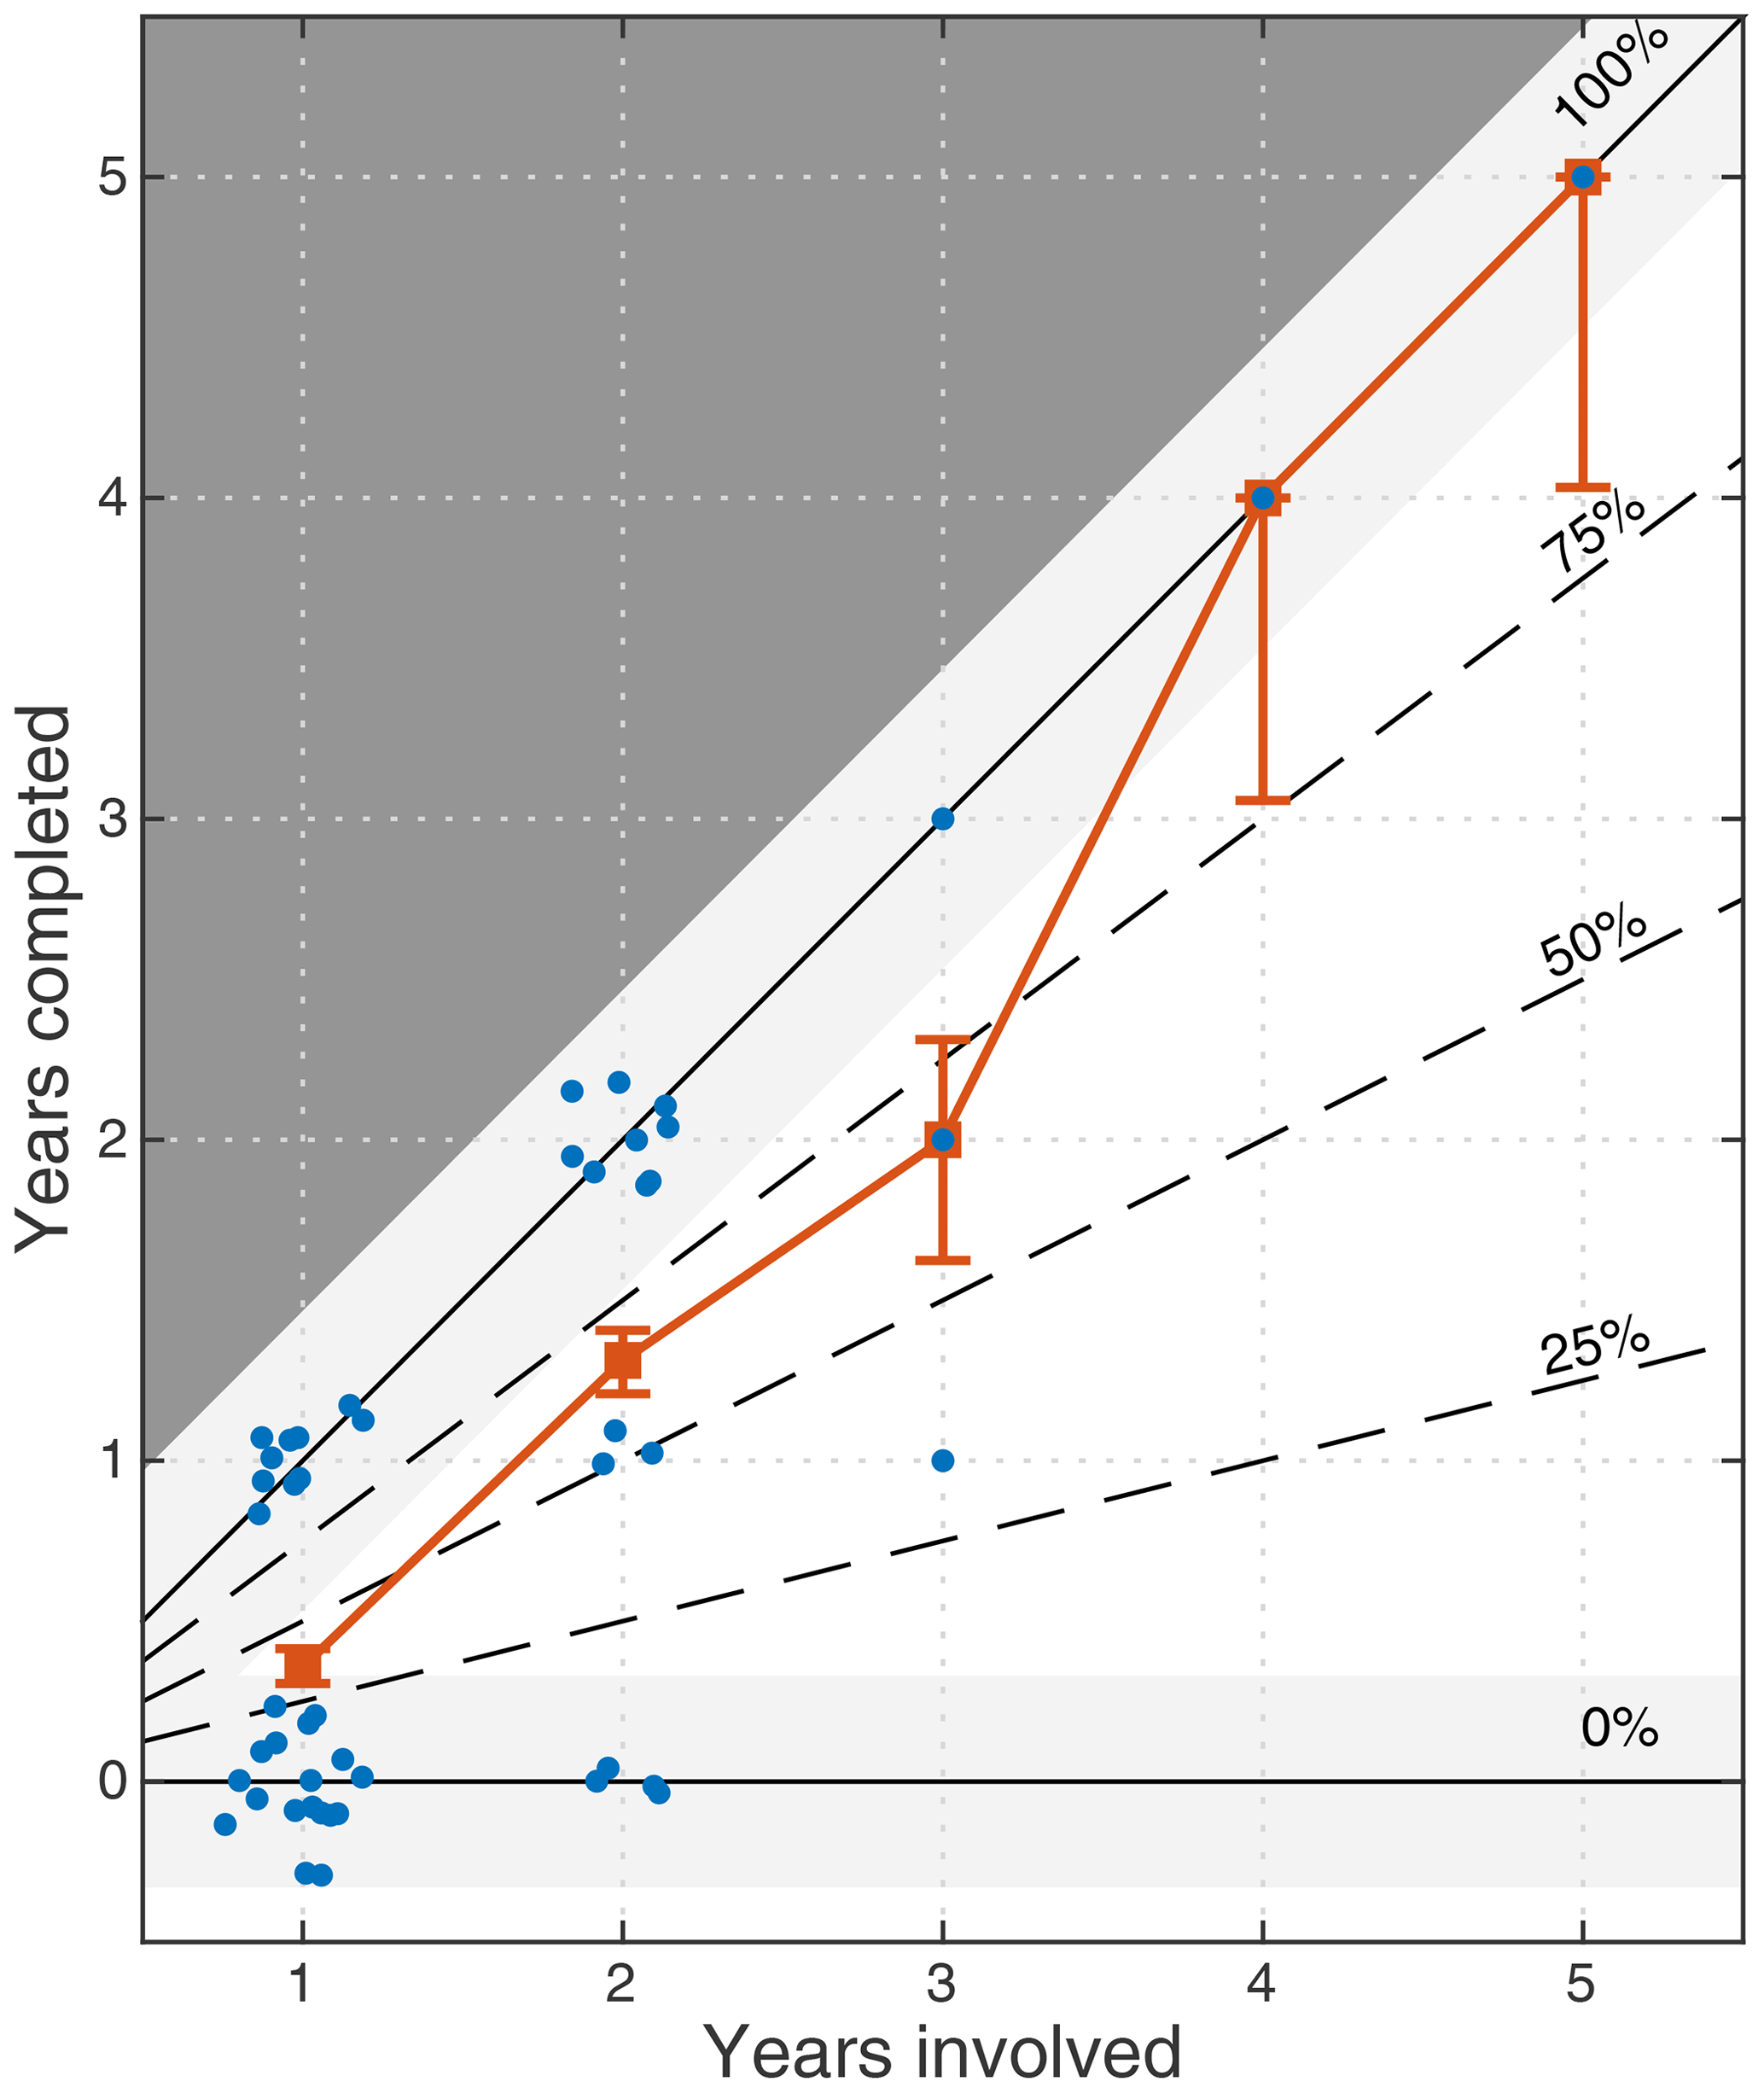
Figure 6The number of years each school completed a PRiSE project against the number of years they were involved. Data points (blue) have been jittered for visibility. The average number of years completed and standard Clopper and Pearson (1934) interval for this rate are also shown (red).
While at our conferences teachers are unanimous in their intentions to participate again when asked via paper questionnaire, the data in Fig. 5 show a fairly consistent drop-off rate of 30±12 % per year from schools which completed a year. The majority of this might be explained by teacher turnover, which, in 2015, stood at 21 % per year nationally (13 % left teaching altogether), with an increasing year-on-year trend, and with London being highlighted as having a much higher churn rate (Worth et al., 2017). We are aware (often through out-of-office messages or bounced emails) of numerous teachers having either moved schools or having left the profession, and it is rare that they communicate this with us ahead of time, handover project responsibilities to another teacher, or take projects with them to their new school. Establishing the exact number of schools which did not return due to this reason, compared to other explanations, would require considerable resources beyond the scope of this evaluation. Teacher turnover poses a real challenge to establishing lasting relationships with schools, particularly when these relationships are so dependent on individuals and are often not embedded within the schools themselves – though the same may also be said of universities, e.g. most of the public engagement professionals who led the Beacons programmes in the UK (National Coordinating Centre for Public Engagement, 2008) do not work in public engagement anymore.
Maximising the retention of schools across years is necessarily a function of the capacity of a programme. While bringing new schools into the programme is certainly beneficial, we have seen that teachers' ability and confidence in supporting project work in their school develops not only across the 6-month programme but over several years. Therefore, a practical balance could be to aim to involve schools directly for just a few years to the point that they can sustainably run projects with fewer interventions from the university; perhaps just through an on-campus kick-off and then the conference, as researcher capacity is less of an issue with these interventions. We acknowledge, though, that some schools might no longer participate without the full suite of interventions. This approach would enable wider impacts on schools that benefit from multiple years of participation, while also ultimately freeing up capacity in the long-term for new schools to be able to benefit from the programme.
Here we present qualitative data from teachers relating to the issues of accessibility, diversity, equity, and retention.
4.1 Method
We prefer to take a holistic approach in investigating teachers' thoughts about these issues, using evaluative data from a variety of methods throughout the programme. Formal feedback from teachers has been gathered from teachers via paper questionnaires handed out at our student conferences each year (in 2020, due to the COVID-19 pandemic, an online form was used instead). All data used here were in response to open questions, and further details of this questionnaire can be found in Archer et al. (2021). In addition to this formal feedback, we also use data obtained more informally. These include comments made by teachers, in person, throughout the programme, e.g. during researcher visits or our conference, and those that were passed on via email. Where possible, explicit consent has been obtained to use these comments, though, in general, by participating in PRiSE, teachers are aware that they are entering a relationship of mutual trust, and that any information passed on by them will be used with integrity (see BERA, 2018). These informal comments are recorded at the time, and then analysed along with, and in the same way as, the formal feedback. The anonymity of the teachers and their schools are protected by quoting only the school's pseudonym and the project and year the feedback related to, along with the method with which the data were obtained.
All qualitative data were analysed using thematic analysis (Braun and Clarke, 2006), with the themes being allowed to emerge from the data via the grounded theory (Robson, 2011; Silverman, 2010) as follows:
-
Familiarisation. Responses are read and initial thoughts noted.
-
Induction. Initial codes are generated based on a review of the data.
-
Thematic review. Codes are used to generate themes and identify associated data.
-
Application. Codes are reviewed through application to the full data set.
-
Analysis. Thematic overview of the data is confirmed, with examples chosen from the data to illustrate the themes.
In the following subsection, we highlight the different themes identified relating to aspects of accessibility, diversity, equity, and retention using italics, providing illustrative quotes.
4.2 Results and discussion
Several teachers from a variety of different schools have raised that they value the diversity present across PRiSE, particularly that students from different schools and backgrounds are able to interact as equals at the student conferences.
They love the competition with independent schools. (Teacher, Rushmore Academy, MUSICS 2018; in person)
Giving the students the opportunity to meet with other schools and academic staff in person is a major highlight. (Teacher, Tree Hill High School, PHwP 2020; questionnaire)
One teacher expanded on this idea, contrasting the diversity present in other schemes and positing that the support provided through PRiSE enabled this difference.
At [PRiSE student conference] Cosmic Con, pupils from a diverse range of state and independent schools have the opportunity to share their experiences and discuss their findings with each other, widening their perspective from the natural micro-habitat of the school environment to the wider community around them. Groups that have worked on the same project naturally gravitate into discussion. The key to increasing collaboration and empathy for those in different schools is to put pupils in the same place, at the same time, with some interest or experience in common to talk about. There are other schools conferences around, but QMUL has such close links with and provides such support for schools that this adds to the diversity of Cosmic Con. (Teacher, Octavian Country Day School, PHwP 2019; email testimonial, following an in-person comment)
The equality of all students at PRiSE conferences is further reflected in that the prizes awarded to students, judged by researchers, have been well distributed amongst different types of schools with no obvious biases (though, due to the small numbers, we do not perform a thorough statistical analysis). This has, however, had a prodigious effect on students from disadvantaged backgrounds.
The students were buzzing on their journey back; they kept saying “I can't believe our little comprehensive won.” (Teacher, Coal Hill School, MUSICS 2016; in person)
Teachers' comments have highlighted that, while some PRiSE projects are thought to be equitable in terms of students' ability, that, unfortunately, may not currently the case with all of them.
The initial information received on the project was quite daunting. But the presentation introduction to it was much more accessible. The scope of the project was accessible to students of all abilities. (Teacher, Spence Academy for Young Ladies, MUSICS 2018; questionnaire)
It is really appropriate in content and context for my students… Throughout the project, there have been tasks that can meet the varying abilities of my students. Really well-designed project. (Teacher, Bending State College, PHwP 2020; questionnaire)
It gives students a chance to do something very interesting, if they are enthusiastic. There isn't much to do for students who are struggling. The projects are very high demand, both in time and skill. This has always been our problem with retaining students' interest over several months. I'm not sure how it can be changed too much without making it boring for students; it's a difficult balance. I think just a variety in skill level; it's nice to have a whole class working on a project together because it pulls everyone up, so there should be stuff for the E/D-grade students to have a go at as well as the A/A* pupils. Some projects don't lend themselves very well to that, but others, like MUSICS, do because anyone can listen to some sounds, but there was still stuff for the higher skill students to get stuck into. (Teacher, Hill Valley High School, ATLAS 2020; questionnaire)
In addition to simply tweaking the projects to reduce their barrier to entry while still maintaining their broad, open-ended scope, there are other potential ways to also address this. One teacher (Xavier's Institute for Higher Learning, MUSICS 2017) highlighted in person that the students' group dynamics can play a big role in their successful participation. In the previous year, a clear enthusiastic leader had emerged who could include everyone in the project in different ways appropriate to their ability, whereas such leadership had not successfully been established amongst any of the students in the following year, leading to the group struggling to find direction and cultivate eagerness in everyone participating until the researcher visit occurred. We suggest that teachers might be able to help facilitate establishing the group dynamics where required, since they are more familiar with the students. Another possibility is peer mentoring from the school's previous year of PRiSE students.
I have had a lot of help from Year 13 students acting as mentors… This has been a useful exercise in peer learning. (Teacher, Xavier's Institute for Higher Learning, MUSICS 2017; questionnaire)
Of course, this is only a viable option for schools which complete 1 year in the first instance. Some teachers who have expressed interest in capitalising on peer mentoring have often struggled to implement it within their schools. Furthermore, some schools prefer to change project after a couple of years, and so the ability of previous PRiSE students to effectively mentor, apart from in a more pastoral capacity, may be limited. While further research is required into what makes successful group dynamics or student mentorship, we nonetheless hope to be able to include something on both of these aspects in the planned how-to guides for teachers.
Finally, we discuss the issue of retention within the programme. Unfortunately, given the often poor communication from teachers (also highlighted as an issue within the ORBYTS programme, Sousa-Silva et al., 2018), it is not always clear as to why individual schools drop out. We have little evidence around why teachers do not communicate this, though one teacher (Colonial Fleet Academy, MUSICS 2016; email) who had been unresponsive eventually expressed a feeling of embarrassment that all their students, bar one, had ceased project work. While we try and assure teachers upon initiating the projects that we anticipate some drop-off, and that there is no pressure from us to remain involved, more may be required in this area. From the minority of teachers that do inform us of their school dropping out, typically via email, reasons have included mock exams being an obstacle, students losing interest, realising the amount of work involved, having difficulty balancing the project with other activities/their normal school workload, giving up due to uncertainty in how to progress, and not feeling like they have made enough progress to continue. Similar themes have been expressed from teachers in person concerning some (but not all) of their students dropping out. We feel that many of these issues might have been mitigated through more and/or earlier communication from the school to us, as we have been able to assist with similar struggles at more communicative schools. Despite a clear support process being laid out at kick-off workshops, a number of teachers from schools that successfully completed projects realised in hindsight that they should have taken advantage of the opportunities from the university earlier in the programme than they did.
Should have taken advantage [of support from Queen Mary] at [an] earlier stage. (Teacher, St Trinians, SCREAM 2018; questionnaire)
The call with [Seth] Zenz would have been more helpful earlier on – it made a big difference, and students would have got more out of the project if they had more time after this took place. (Teacher, Imperial Academy, ATLAS 2020; questionnaire)
This is, again, something that could be stressed in teacher guidance upon engaging with the programme to better set expectations and good practice, as many new teachers to the programme may not be used to such a reactive way of working rather than the typical push model from teachers to students.
Overall, we have the impression that retention within PRiSE can often come down to the individual teacher – those that are communicative and properly engage with the programme and its expectations from the outset are far more likely to see their students succeed. This is backed up by evidence from several schools, where a change in teacher has either led to increased engagement with the programme (e.g. Rydell High School), success at previously unsuccessful schools (e.g. Hill Valley High School), or, unfortunately, previously successful schools dropping out of the programme (e.g. Prufrock Preparatory School). One teacher who changed schools (from Hogwarts to Prufrock Preparatory School) and brought the PRiSE projects with them also raised with us, in person, that the culture within the schools can play a role in students' engagement with the programme (and extracurricular activities in general). Both of these are challenging issues to address as we aim to increase the retention and equity of the programme. While it is clear that more detailed qualitative research is required in this area, perhaps by giving clearer information and expectations upon sign-up, as well as providing further guidance on ways of successfully integrating and nurturing project work within schools, as highlighted by other teachers, these issues might be somewhat mitigated.
Societal inequalities in access to and engagement with science are prevalent even in secondary/high schools (Hamlyn et al., 2020). While university engagement programmes, like independent research projects, could address these issues, at present few such schemes specifically target traditionally under-represented groups, and in general, globally students' participation in such projects are inequitable (Bennett et al., 2016, 2018). In this paper, we have evaluated the accessibility, diversity, and equity of the Physics Research in School Environments (PRiSE) programme of independent research projects (Archer et al., 2021).
The schools involved in PRiSE have been benchmarked against those participating in similar programmes of research-based physics projects for schools in the UK. Investigating measures of the socio-economic status, race, and genders of the schools' students have revealed that PRiSE has engaged much more diverse groups of schools with substantially more under-represented groups than is typical. Indeed, PRiSE schools are mostly reflective of national statistics and, in some measures, feature an over-representation of disadvantaged groups. While PRiSE has featured fewer independent and selective schools than other schemes, the proportions are not currently reflective of all schools nationally, and thus, new policies have been implemented to improve diversity in these regards.
Survival analysis has been used to explore the retention of schools within the programme. This was, firstly, done across the different intervention stages of PRiSE within each academic year. We find a fairly consistent drop-off rate throughout, with no significant differences between the different projects or the years considered. While little research into the retention of schools within protracted programmes of engagement currently exist, the rates exhibited by PRiSE are at least similar to another programme (Hope-Stone Research, 2018). The analysis has highlighted the importance of PRiSE's researcher involvement in the schools' success. This is despite independent research projects in general often not being supported by external mentors (Bennett et al., 2016, 2018). No biases in schools' retention appear present by school category, socio-economic background, or race. This suggests that the schools' ability to succeed at independent research projects is independent of background within the PRiSE framework. PRiSE has seen repeated buy-in over multiple years from numerous schools. Hence, we also looked at the retention of schools across multiple years, again finding no real differences in the backgrounds of schools which return and those which do not. Indeed, the only predictor for multiple years of participation is whether the school engaged with the programme through to completion for at least 1 year. Our interpretation is that success within PRiSE often comes down to the individual teacher, with poor communication (see Sousa-Silva et al., 2018) or not fully engaging with the programme and its expectations serving as key barriers in schools' participation.
Qualitative feedback from teachers has shown that they value the diversity within the programme and see the ability of students from different schools and backgrounds to interact as equals at PRiSE conferences as a positive aspect. They also attribute this equity to the exceptionally high level of support provided by PRiSE to the schools involved. The need for slight modifications to make some of the projects more accessible to students of all abilities has been raised. These concerns might also be addressed by prompting teachers to facilitate students' group dynamics and potentially incorporate peer mentoring from previous years' PRiSE students, both of which have been reported as successful in some cases but with mixed results at other schools. More teacher guidance, co-created with teachers themselves, on the expectations within the programme and good practice in incorporating and nurturing project work within schools could be provided to help with retention in new schools.
Our analysis has been limited to the London geographic area, so it is not yet clear that the PRiSE framework of independent research projects would necessarily be as accessible or equitable in different parts of the UK or in different countries. With the adoption of this approach to engagement at other universities, however, we hope to be able to investigate this in the future. Furthermore, only school-level metrics have been considered here, and more detailed analysis at the individual student level and their characteristics could be considered in future, which would require funding to commission such research by social scientists, along with the necessary ethical approval. Finally, in-depth qualitative research into the reasons behind schools dropping out of PRiSE, both within the 6-month programme and between different years, would be beneficial in understanding what the current barriers to prolonged participation are and how these could be best addressed in the future.
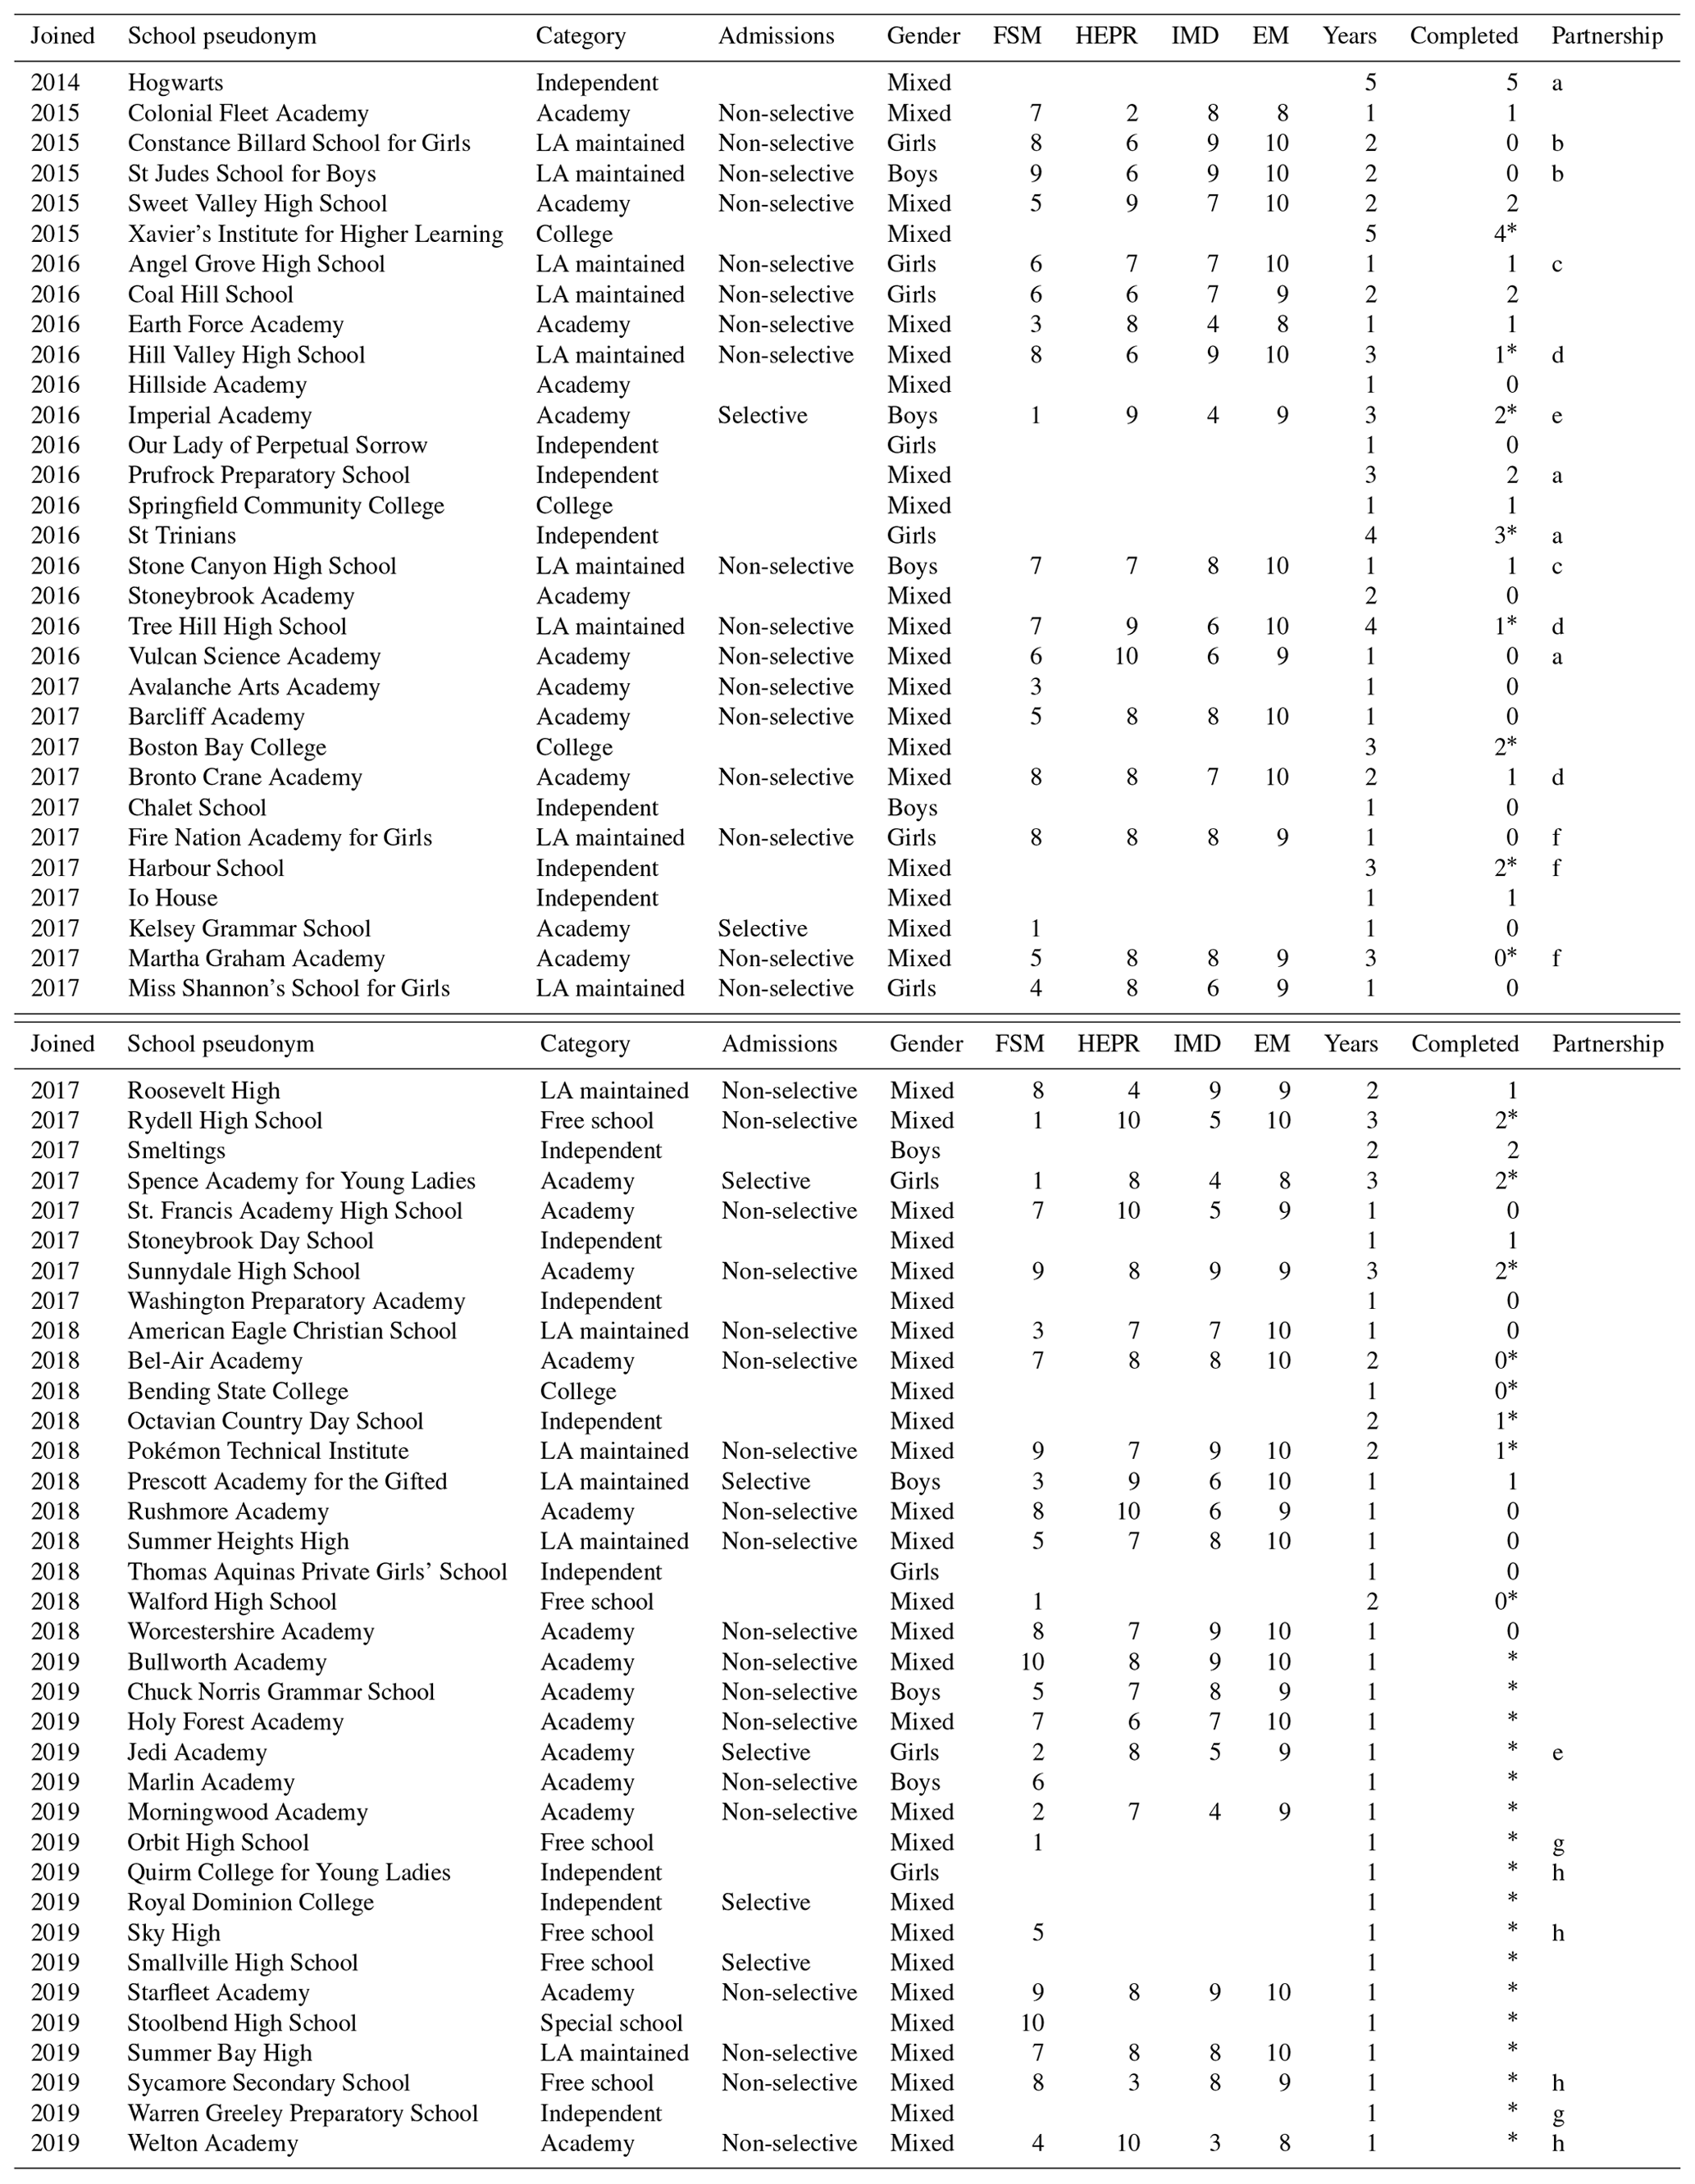
Below is a table with information about all the schools which have been involved in PRiSE. To protect the anonymity of students and teachers, pseudonyms (taken from https://annex.fandom.com/wiki/List_of_fictional_schools, last access: 20 July 2020) have been used. Table details the year the school joined, how many years they have undertaken projects, the number of these years they successfully completed (i.e. made it all the way to the student conference), along with categorical information, and deciles (used here to further protect anonymity) across their catchment areas of the schools' percentage of students on free school meals (FSM), higher education participation rate (HEPR), indices of multiple deprivation score (IMD), and percentage of ethnic minorities (EM). Further information about these are given in Appendices B and C. Missing data in the table is due to the data not being publicly available. Different school partnerships, where schools have worked together (or have at least attempted to), are indicated by letters. Schools which signed up for but never commenced project work (by hosting and/or attending a kick-off meeting) are not included here. Note that the years completed column does not include data from the 2019–2020 academic year due to disruption by the COVID-19 pandemic, and we mark all schools affected by this with an asterisk (*) in this column.
This paper uses the context of the UK/England education system to assess the diversity of schools engaged within the PRiSE (and other) programme(s). To those unfamiliar with this system, we provide some further notes here. Schools are classified by the Department for Education (2018) into the following main categories:
-
Academies. These are schools that are state funded and free to students but are not run by the local authority. They have much more independence than most other schools, including the power to direct their own curriculum. Academies are established by sponsors from business, faith or voluntary groups, in partnership with the Department for Education, working with the community.
-
Colleges. These are post-16 education establishments not part of a secondary school.
-
Free schools. These are a type of academy set up by teachers, parents, existing schools, educational charities, universities, or community groups.
-
Independent schools. These are funded by the fees paid by the parents of pupils, contributions from supporting bodies and investments. They are not funded or run by central government or a local authority. They can set their own curriculum.
-
Local authority (LA) maintained schools. These are wholly owned and maintained by local authorities and follow the national curriculum.
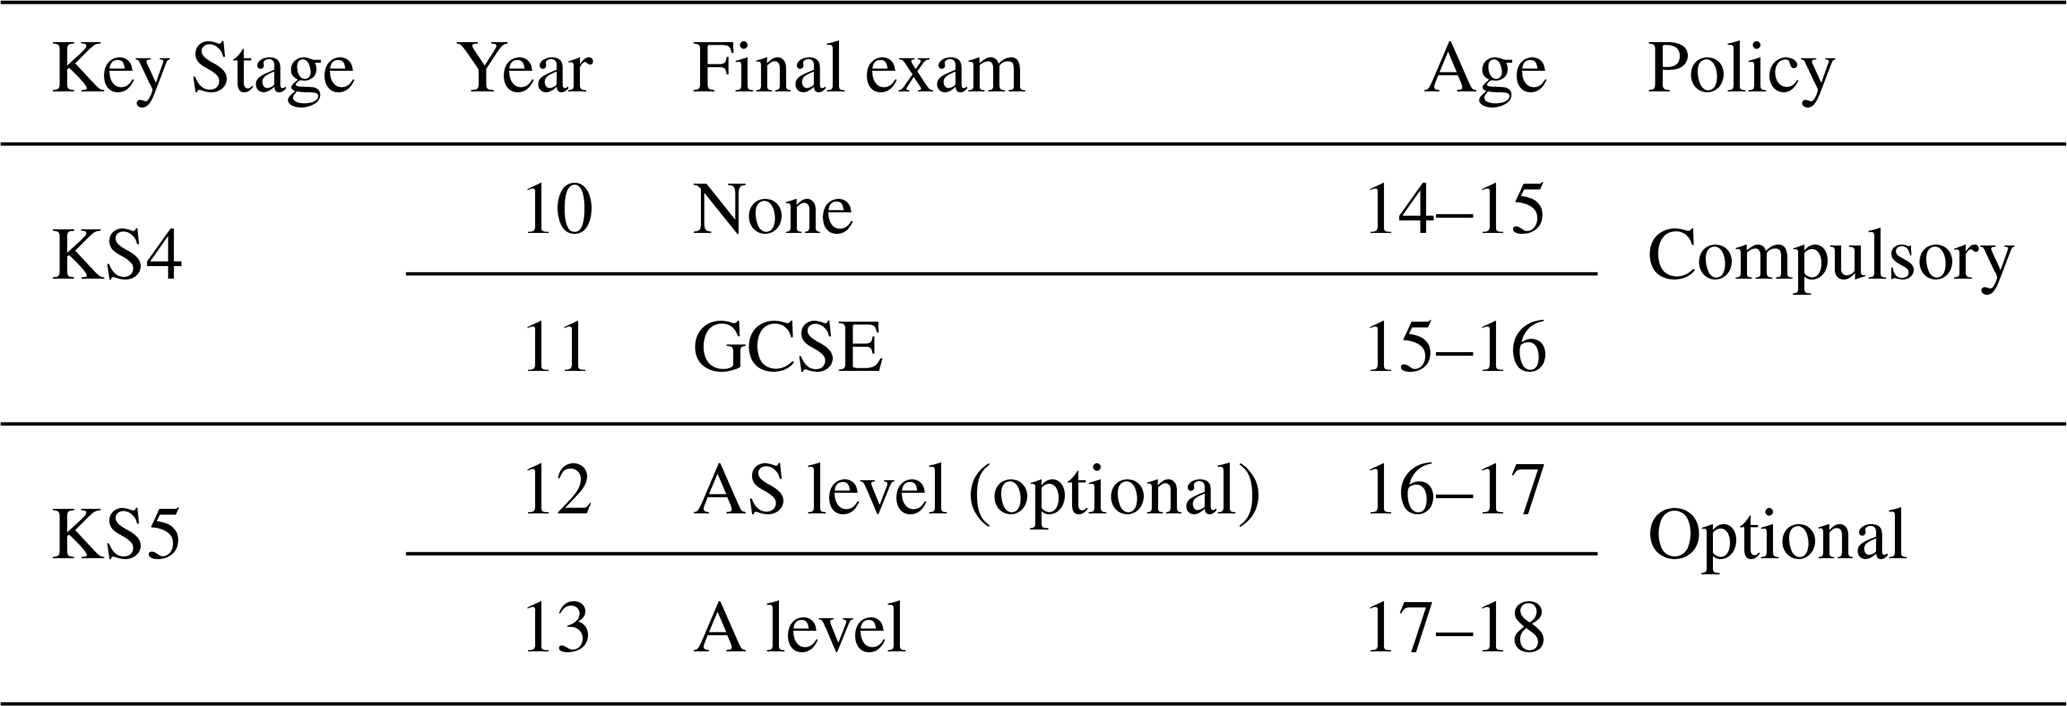
Other less common categories are not considered in this paper due to small number statistics. In addition to the school category, UK schools can also be classified by their admissions policy. Selective (or grammar) schools enrol pupils based on ability whereas non-selective (or comprehensive) schools are not able to do this. While some independent schools are selective, not all of them are. Table B1 shows how school years are denoted in the English system, with other contextual information.
Table B1Summary of the stages in the English education system applicable to PRiSE.
In this paper we look at several metrics to assess the backgrounds of the schools' pupils. School categories are listed in Edubase (Department for Education, 2018), as are the percentage of students on free school meals (though this is typically not listed for colleges, independent schools, and some academies). Other relevant metrics are not included in Edubase but are tied to census lower and middle layer super output areas (LSOAs and MSOAs respectively; Office of National Statistics, 2011). However, since schools will draw students from a wider range of locations than simply the census area within which they are located, this ideally necessitates knowledge of a school's catchment area to gain a better understanding of the backgrounds of the schools' students. While such information is available for state schools in the greater London area through the London Schools Atlas (Greater London Authority, 2014), which lists, for each school, the resident LSOAs/MSOAs of their student base, unfortunately there is no equivalent publicly accessible data covering the entire UK.
Here we detail how school metrics across their entire catchment areas are calculated. Higher education participation rates for each school are determined using the number of entrants to higher education and cohort populations across each school's MSOAs from POLAR4 data (Office for Students, 2018). Similarly, index of multiple deprivation scores (Ministry of Housing, Communities & Local Government, 2015) are averaged over each school's LSOAs. For protected characteristics, such as gender/sex and race/ethnicity, we do not collect these data from students for ethical reasons. In the latter case, while it has been observed by session leaders at interventions that a diversity of ethnicities have been involved, we opt to quantify this through the ethnic diversity of the areas from which students are drawn. Census data (Office of National Statistics, 2011) on ethnic groups is used to calculate the percentage of people from ethnic minorities (i.e. Asian, Black, Mixed, and Other groups) across each school's LSOAs.
To still enable some comparison between PRiSE and the national programmes for which we do not have access to information on schools' catchment areas, we rely on using the metrics pertaining only to the LSOA/MSOA within which the school resides. These results are indicated by dashed lines in Fig. 3 and have also been computed for PRiSE schools to ensure like-for-like comparisons. Across the greater London area, we can check the reliability of these local proxies, and comparisons are shown in Fig. C1. These reveal that the local and full catchment distributions appear similar, with location and scale parameters (e.g. means and standard deviations respectively) that differ only by a few percent or score points. Therefore, taking into account schools' full catchment area only slightly changes the underlying distributions of the societal measures, apart from in the extremes of the distributions (i.e. the tails) where greater differences occur. However, while the local census and full catchment data for London schools correlate, this correlation is not particularly strong (the correlation coefficients are R=0.64, 0.65, and 0.85 respectively), and the linear best fit lines have slopes significantly less than unity. This highlights that the metrics vary substantially across all the census areas a school draws students from, meaning that a school can have rather different values when either using local or full catchment data. Further investigation of these societal measures applied to schools in general is beyond the scope of this paper.
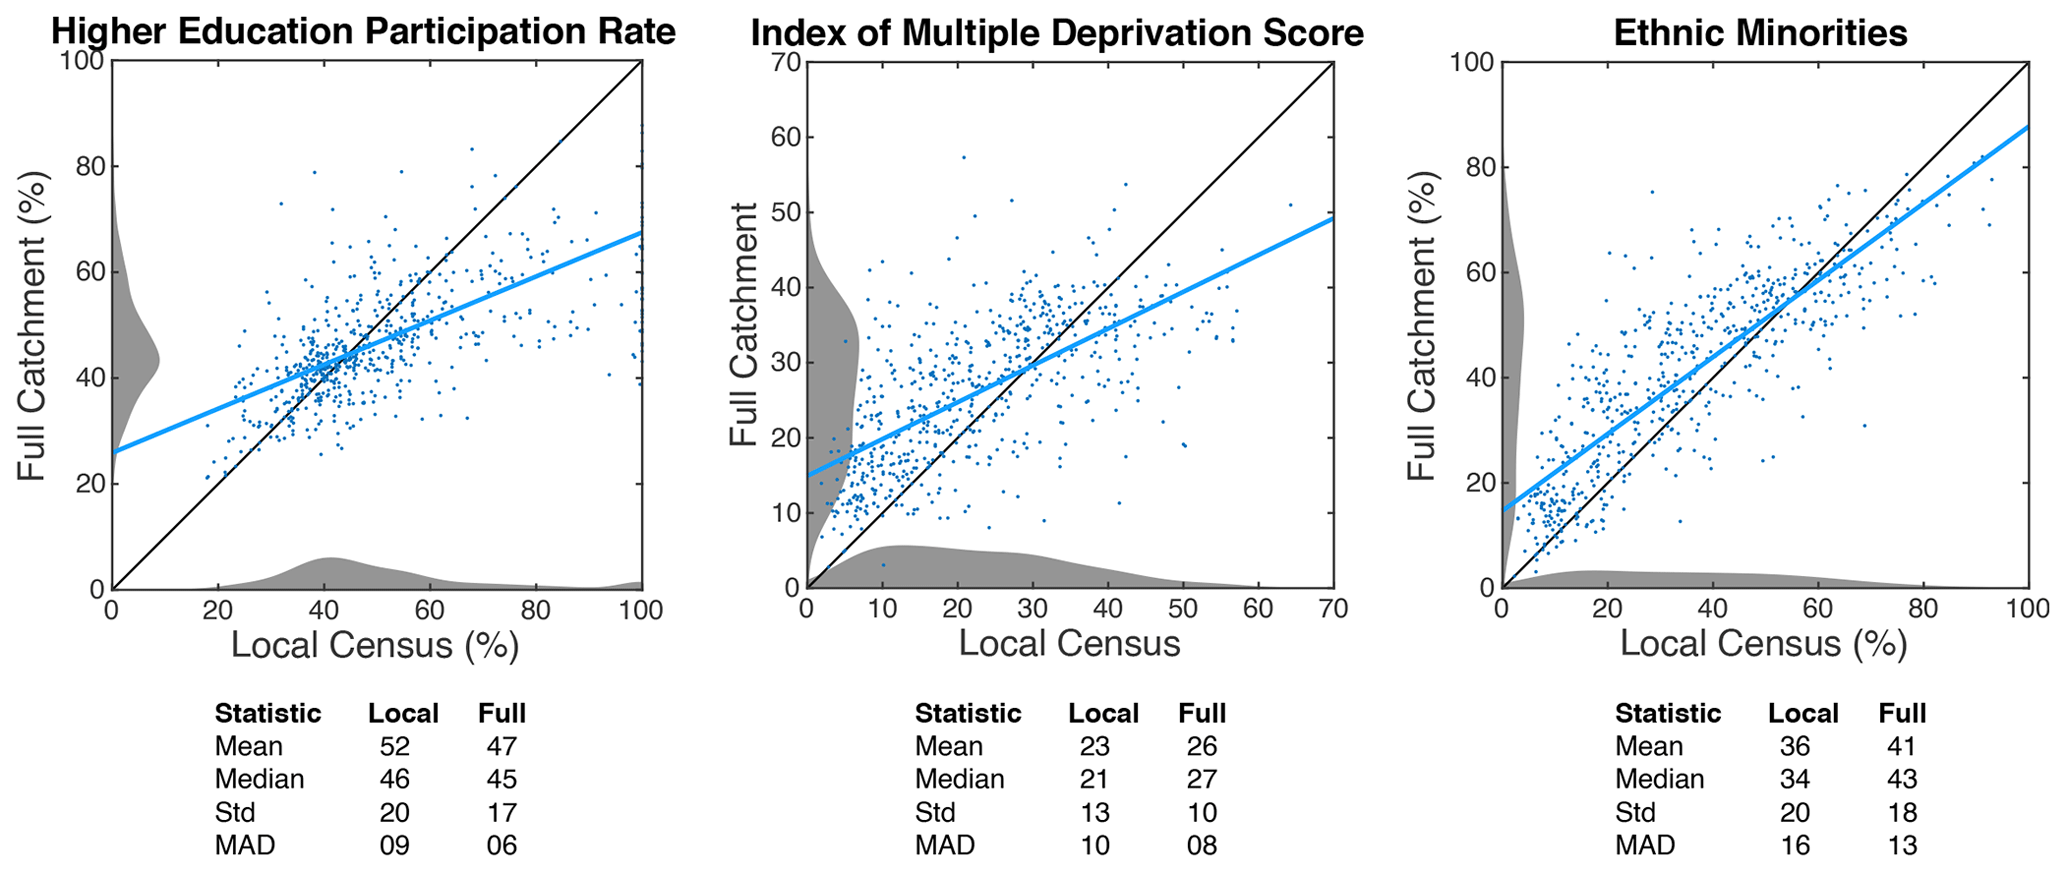
Figure C1Comparison of local census and full catchment data for all schools across greater London (n=625), with a linear regression (blue line) and marginal distributions (grey areas) shown. Location (mean and median) and scale (standard deviation and median absolute deviation) parameters for the two types of data are also displayed.
The below table contains data on the retention of schools within PRiSE across intervention stages. We use the following terminology:
-
Attended – schools which received the intervention.
-
Did not attend – schools which did not receive the intervention but were still engaged with the programme at that stage.
-
Unresponsive – schools that did not respond to our communications from that point on.
-
Dropped out – schools that communicated their dropping out of the programme at that stage.
Schools that have become unresponsive or drop out are no longer counted in the table for subsequent intervention stages.
Table D1Data on the retention of schools within PRiSE across intervention stages.
Data supporting the findings of this study that are not already contained within the article or derived from listed public domain resources are available on request from the corresponding author. These data are not publicly available due to ethical restrictions based on the nature of this work.
The author declares that there is no conflict of interest.
The author thanks Dominic Galliano, Olivia Keenan, Charlotte Thorley, and Jennifer DeWitt for the helpful discussions. Martin O. Archer holds a UKRI (STFC/EPSRC) Stephen Hawking Fellowship.
This research has been supported by the Science and Technology Facilities Council (grant no. ST/N005457/1), the Queen Mary University of London (Centre for Public Engagement Large Award), the Ogden Trust (grant no. OQMU01), and UK Research and Innovation (grant no. EP/T01735X/1).
This paper was edited by Iain Stewart and reviewed by Michael Reiss and one anonymous referee.
Archer, M. O.: So you're looking to run a research in schools project? Practical tips from the evaluation of a pilot programme, Tech. rep., SEPnet, https://doi.org/10.13140/RG.2.2.25674.06088, 2017. a
Archer, M. O. and DeWitt, J.: “Thanks for helping me find my enthusiasm for physics”: the lasting impacts “research in schools” projects can have on students, teachers, and schools, Geosci. Commun., 4, 169–188, https://doi.org/10.5194/gc-4-169-2021, 2021. a
Archer, M. O., DeWitt, J., Thorley, C., and Keenan, O.: Evaluating participants' experience of extended interaction with cutting-edge physics research through the PRiSE “research in schools” programme, Geosci. Commun., 4, 147–168, https://doi.org/10.5194/gc-4-147-2021, 2021. a, b, c, d, e
Bennett, J., Dunlop, L., Knox, K. J., Reiss, M. J., and Torrance Jenkins, R.: A Rapid Evidence Review of Practical Independent Research Projects in Science, Tech. rep., Wellcome Trust, London, 2016. a, b, c, d
Bennett, J., Dunlop, L., Know, K. J., Reiss, M. J., and Torrance Jenkins, R.: Practical independent research projects in science: a synthesis and evaluation of the evidence of impact on high school students, Int. J. Sci. Educ., 40, 1755–1773, https://doi.org/10.1080/09500693.2018.1511936, 2018. a, b, c, d
BERA: Ethical Guidelines for Educational Research, Tech. Rep., 4th Edn., British Educational Research Association, London, 2018. a
Bonney, R., Cooper, C. B., Dickinson, J., Kelling, S., Phillips, T., Rosenberg, K. V., and Shirk, J.: Citizen science: a developing tool for expanding science knowledge and scientific literacy, BioScience, 59, 977–984, https://doi.org/10.1525/bio.2009.59.11.9, 2009. a
Bonney, R., Phillips, T. B., Ballard, H., and Enck, J. W.: Can citizen science enhance public understanding of science?, Public Underst. Sci., 25, 2–16, https://doi.org/10.1177/0963662515607406, 2016. a
Braun, V. and Clarke, V.: Using thematic analysis in psychology, Qual. Res. Psychol., 3, 77–101, https://doi.org/10.1191/1478088706qp063oa, 2006. a
Campaign for Science and Engineering: Improving diversity in STEM, Tech. rep., CaSE, available at: http://www.sciencecampaign.org.uk/resource/ImprovingDiversityinSTEM2014.html (last access: April 2020), 2014. a
Clopper, C. and Pearson, E. S.: The use of confidence or fiducial limits illustrated in the case of the binomial, Biometrika, 26, 404–413, https://doi.org/10.1093/biomet/26.4.404, 1934. a, b, c, d
Department for Education: Get information about schools, available at: http://get-information-schools.service.gov.uk/, last access: June 2018. a, b, c
Efron, B. and Tibshirani, R.: An Introduction to the Bootstrap, Chapman & Hall/CRC, Boca Raton, FL, USA, 1993. a
Gibbons, J. D. and Chakraborti, S.: Nonparametric statistical inference, Chapman & Hall/CRC Press, Boca Raton, FL, USA, 2011. a
Gill, T. and Bell, J. F.: What Factors Determine the Uptake of A-level Physics?, Int. J. Sci. Educ., 35, 753–772, https://doi.org/10.1080/09500693.2011.577843, 2011. a
Greater London Authority: London Schools Atlas, available at; http://data.london.gov.uk/dataset/london-schools-atlas (last access: June 2018), 2014. a
Hamlyn, B., Hanson, T., Malam, S., Man, C., Smith, K., Williams, L., and DeWitt, J.: Young people's views on science education: Science Education Tracker 2019, Tech. rep., Wellcome Trust, available at: https://wellcome.ac.uk/reports/science-education-tracker-2019, last access: March 2020. a, b
HiSPARC: High School Project on Astrophysics Research with Cosmics, available at: http://www.hisparc.nl/en/, last access: July 2018 (in Dutch). a
Hollander, M. and Wolfe, D. A.: Nonparametric statistical methods, John Wiley & Sons, Inc., Hoboken, New Jersey, USA, 1999. a
Hope-Stone Research: Connect Physics 2017-18 evaluation report, Tech. rep., SEPnet, available at: http://www.sepnet.ac.uk/outreach/connect-physics/ (last access: August 2019), 2018. a, b
Institute of Physics: Institute of Physics policy data centre, availabler at: http://www.iop.org (last access: May 2019), 2018. a
IRIS: The Institute for Research in Schools, available at: http://www.researchinschools.org/, last access: July 2018. a
Machin, D., Cheung, Y. B., and Parmar, M.: Survival analysis: A practical approach, Wiley, Hoboken, New Jersey, USA, 2006. a
Miller, R. G.: Survival analysis, John Wiley & Sons, Hoboken, New Jersey, USA, 1997. a
Ministry of Housing, Communities & Local Government: English indices of deprivation 2015, available at: http://www.gov.uk/government/statistics/english-indices-of-deprivation-2015 (last access: September 2018), 2015. a, b
National Coordinating Centre for Public Engagement: Beacons for Public Engagement, available at: https://www.publicengagement.ac.uk/nccpe-projects-and-services/completed-projects/beacons-public-engagement (last access: March 2020), 2008. a
Office for Students: Participation of Local Areas 4, available at: http://www.officeforstudents.org.uk/data-and-analysis/polar-participation-of-local-areas/, last access: October 2018. a, b, c
Office of National Statistics: Census Data, available at: http://www.nomisweb.co.uk/census/2011 (last access: Sep 2019), 2011. a, b, c
ORBYTS: Original Research By Young Twinkle Students, available at: http://www.twinkle-spacemission.co.uk/orbyts/, last access: March 2019. a
Robson, C.: Real World Research, John Wiley and Sons Ltd., Hoboken, New Jersey, USA, 2011. a
Shah, H. R. and Martinez, L. R.: Current approaches in implementing citizen science in the classroom, J. Microbiol. Biol. Educ., 17, 17–22, https://doi.org/10.1128/jmbe.v17i1.1032, 2016. a
Silverman, B.: Density Estimation for statistics and data analysis, Chapman & Hall/CRC, London, UK, 1986. a
Silverman, D.: Doing Qualitative Research: A Practical Handbook, Sage Publications Ltd., Thousand Oaks, California, USA, 2010. a
Sousa-Silva, C., Mckemmish, L. K., Chubb, K. L., Gorman, M. N., Baker, J. S., Barton, E. J., Rivlin, T., and Tennyson, J.: Original Research By Young Twinkle Students (ORBYTS): when can students start performing original research?, Phys. Educ., 53, 015020, https://doi.org/10.1088/1361-6552/aa8f2a, 2018. a, b
Worth, J., De Lazzari, G., and Hillary, J.: Teacher retention and turnover research: Interim report, Tech. rep., National Foundation for Educational Research, available at: https://www.nfer.ac.uk/teacher-retention-and-turnover-research-interim-report/ (last access: August 2019), 2017. a
- Abstract
- Introduction
- Participation
- Retention
- Feedback
- Conclusions
- Appendix A: PRiSE schools
- Appendix B: Information about UK/English schools
- Appendix C: Method for gathering metrics on UK schools
- Appendix D: Retention data
- Data availability
- Competing interests
- Acknowledgements
- Financial support
- Review statement
- References