the Creative Commons Attribution 4.0 License.
the Creative Commons Attribution 4.0 License.
 | 13 Dec 2021
Identifying community values related to heat: recommendations for forecast and health risk communication
Kathryn Lambrecht
Benjamin J. Hatchett
Kristin VanderMolen
Bianca Feldkircher
Effective communication of heat risk to public audiences is critical for promoting behavioral changes that reduce susceptibility to heat-related illness. The U.S. National Oceanic and Atmospheric Administration (NOAA) National Weather Service (NWS) provides heat-related information to the public using social media platforms such as Facebook. We applied a novel rhetorical framework to evaluate 5 years (2015–2019) of public responses to heat-related Facebook posts from the NWS office in Phoenix (Arizona) to identify “commonplaces” or community norms, beliefs, and values that may present challenges to the effectiveness of heat risk communication. Phoenix is in one of the hottest regions in North America and is the 10th-largest metropolitan area in the U.S. We found the following two key commonplaces: (1) the normalization of heat and (2) heat as a marker of community identity. These commonplaces imply that local audiences may be resistant to behavioral change, but they can also be harnessed in an effort to promote protective action. We also found that public responses to NWS posts declined over the heat season, further suggesting the normalization of heat and highlighting the need to maintain engagement. This work provides a readily generalizable framework for other messengers of high-impact weather events to improve the effectiveness of their communication with receiver audiences.
- Article
(2810 KB) - Full-text XML
- BibTeX
- EndNote


Extreme heat is the deadliest weather or climate-related hazard in the U.S. (National Weather Service, 2019). Heat-related mortality is exacerbated by the persistence of knowledge gaps between messengers (e.g., weather forecasters and public health officials) and receiver audiences that limit the effectiveness of heat risk communication and/or delivery (Abrahamson et al., 2008; Chowdhury and Haque, 2008; Chowdhury et al., 2012; Semenza et al., 2008). Yet, where heat risk communication has been effective (and barriers to self-protection have been limited; see Toloo et al., 2013), it has been shown to lower mortality (Ebi et al., 2004; Schifano et al., 2012). Often, research aimed at improving the effectiveness of heat risk communication has, therefore, focused on closing messenger–receiver knowledge gaps. Recommended approaches for doing so include creating virtual public education opportunities (Neumann et al., 2018; Stephens et al., 2019), increasing the consistency and repetition of messaging (Hawkins et al., 2017; Keul et al., 2018), and integrating nuanced understanding of public knowledge and beliefs into risk communication (Chowdhury et al., 2012). However, to accomplish the latter, frameworks and tools are needed to help communicators of risk identify that nuance.
The identification of “commonplaces” (referred to as topoi in the field of rhetoric, originating in the work of Aristotle) offers one approach for building place-based nuance into risk communication. Commonplaces are the underlying norms, beliefs, and values that influence the way audiences respond to information (Walsh and Boyle, 2017), including information about weather and safety (Lambrecht et al., 2019). The identification of commonplaces therefore enables communicators of risk to acquire important rhetorical awareness of their unique target audiences (Walsh and Boyle, 2017) and better tailor their communication for increased effectiveness, for example, by presenting content framed specifically within local norms and values (Lambrecht et al., 2019; see Chowdhury et al., 2012). As the identification of commonplaces is a practice grounded in analyzing language, the method can be applied to any technical or risk communication (Harlow, 2015).
Here we identified commonplaces related to the communication of heat risk in Phoenix, Arizona, through analysis of public comments posted in response to National Oceanic and Atmospheric Administration (NOAA) National Weather Service (NWS) heat-related forecasts on Facebook between 2015–2019. We, additionally, evaluated the frequency and type of public comment in relation to temperature anomalies using a percentile-based approach. Our findings confirm perceptions held within the NWS Phoenix office and offer insights into how communicators of heat risk might leverage commonplaces to tailor the content and timing of messages for increased effectiveness. The methods utilized offer a replicable approach for communicators of heat risk in any location, or of different weather- and climate-related hazards (e.g., winter weather; Lambrecht et al., 2019), to acquire a nuanced understanding of the public knowledge and beliefs encouraged for closing messenger–receiver knowledge gaps (see Chowdhury et al., 2012).
To identify commonplaces related to the communication of heat risk in Phoenix, we collected and analyzed 4304 public comments from all NWS Phoenix Facebook posts that discussed heat-related forecasts or above-average temperatures during the warm season (June–September) between 2015–2019 (US National Weather Service Phoenix Arizona, 2021). The comments were expressed either in written text or as visual objects (e.g., GIFs, photographs, or memes). We chose to focus our analysis on NWS Phoenix because its County Warning Area (CWA) is subjected to extreme heat. The warm season months of June–September were selected for analysis because the vast majority (94 %) of heat-related deaths in the U.S. occur during that time of year (CDC, 2017). The period of focus, 2015–2019, was selected to capture enough data to allow for the identification of patterns in commonplaces over time.
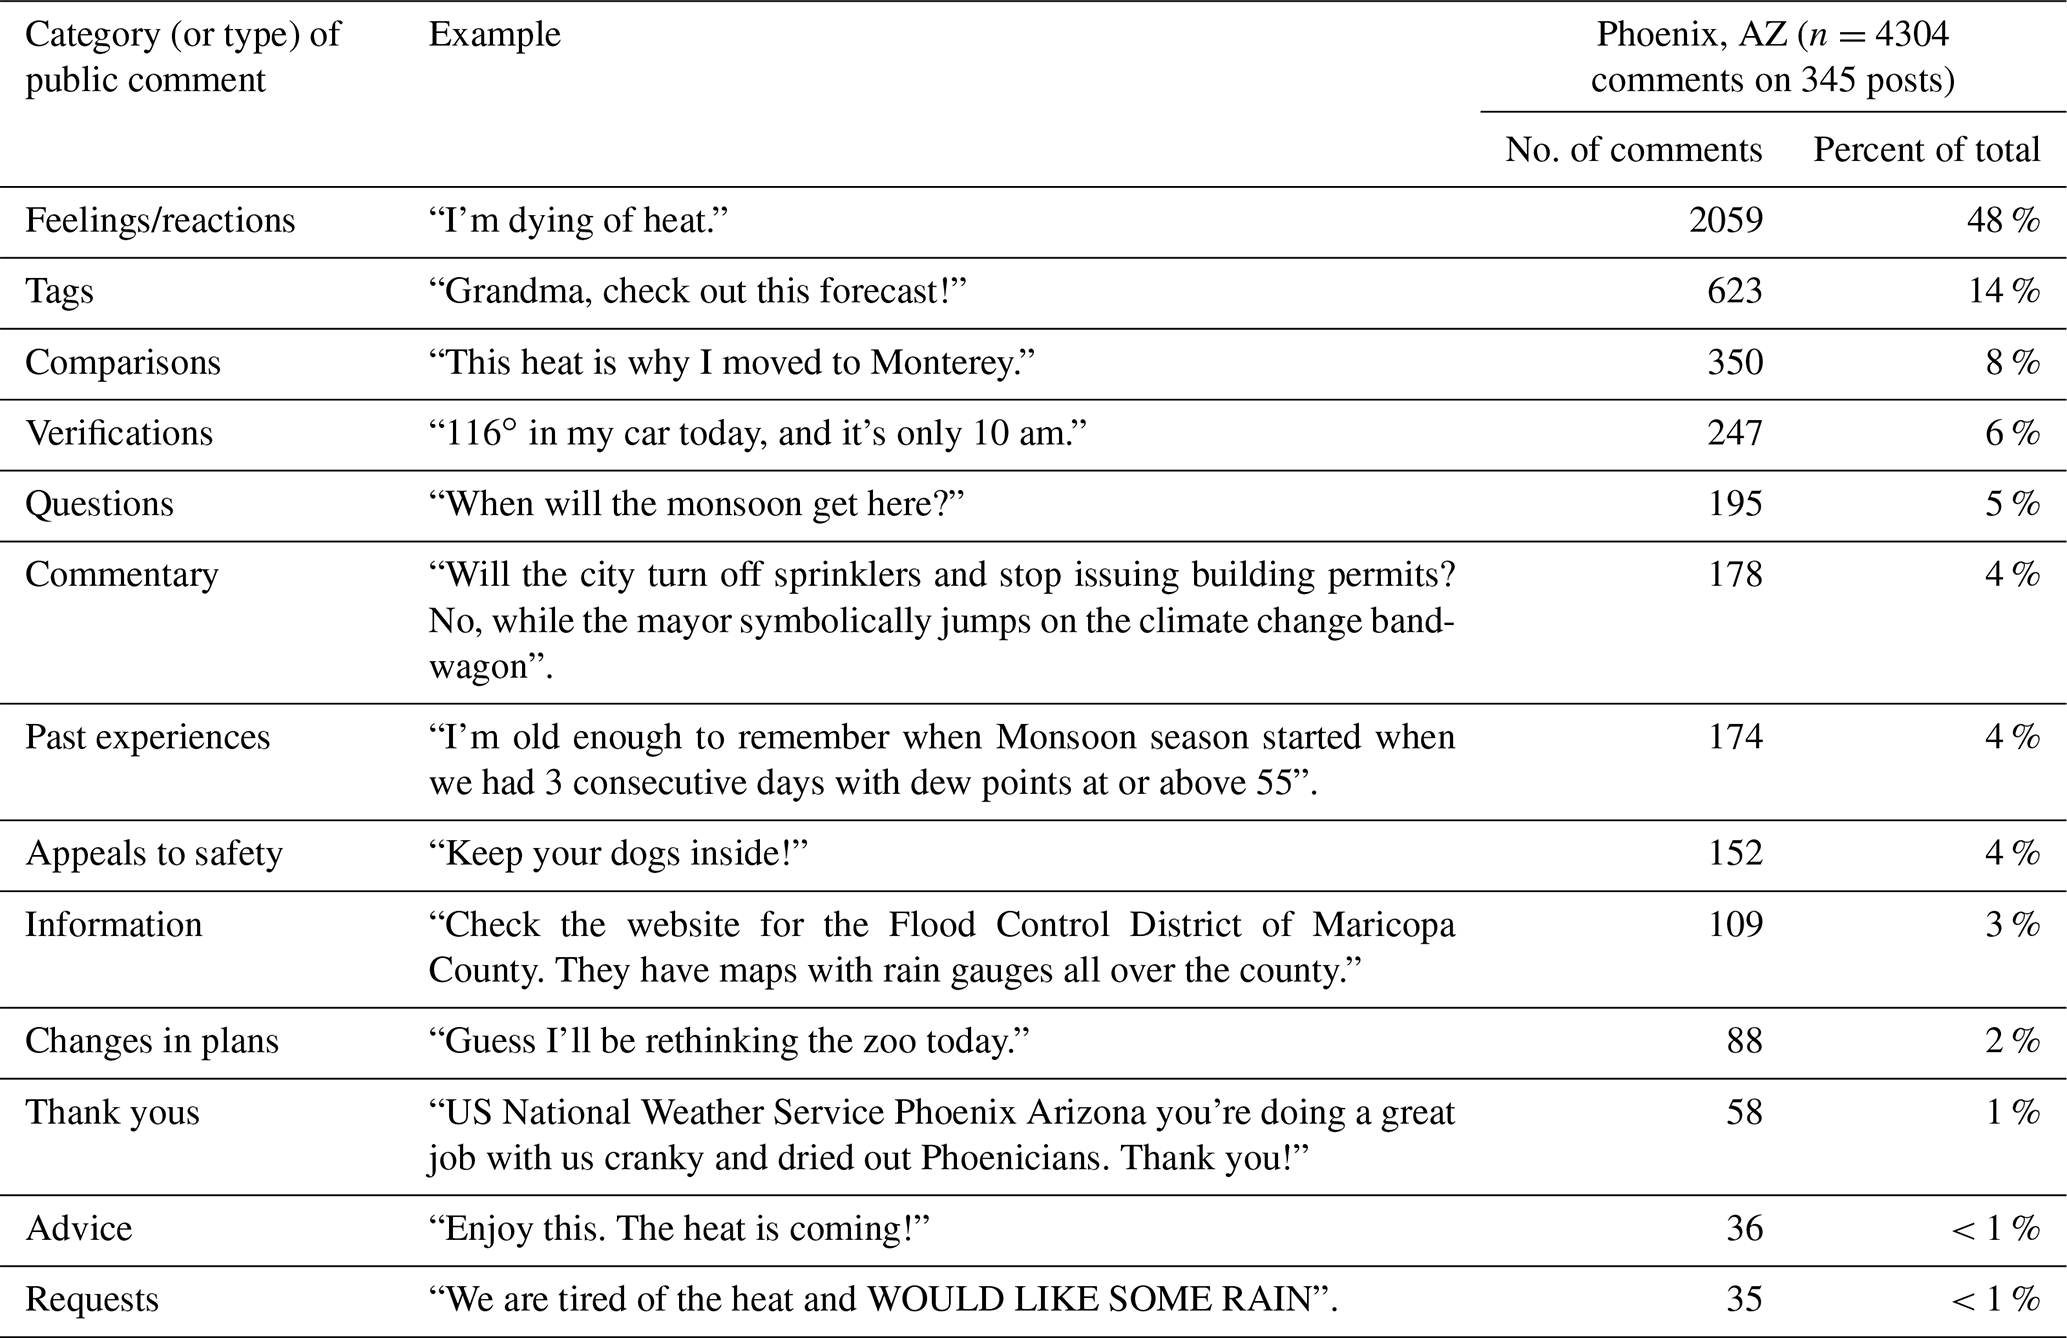
Following Lambrecht et al. (2019), the lead author inductively coded a subsample (∼ 728 or ∼ 17 %) of the total 4304 public comments according to how they functioned as a response to heat-related NWS Phoenix Facebook posts (see also Walsh and Ross, 2015). The resulting codebook was shared and discussed with co-authors, who agreed that it thoroughly and accurately reflected the different types of responses (see Saldaña, 2015). In total, the codebook included the following 13 codes (i.e., different types of comments): (1) feelings or reactions shared in response to an NWS Phoenix Facebook post, (2) tags linking the name of a person to a post to draw their attention to it, (3) verifications or sharing of information that confirms or refutes a forecast, (4) comparisons differentiating weather in Phoenix from another location, (5) questions about heat impacts, (6) commentaries exploring the political context of heat, (7) past experiences or sharing stories about heat, (8) appeals to safety or warning other members of the public about heat, (9) information sharing (e.g., about resources), (10) changes in plans, indicating that weather played a role in modifying activity, (11) thank yous, expressing appreciation for NWS, (12) advice sharing between members of the public, and (13) requests for additional weather information or about changes in the weather (Table 1). The lead author then analyzed the comments within and across each of those categories to identify commonplaces related to heat. For a particular norm, belief, or value to have been considered a commonplace, it had to be (1) expressed across multiple years and by multiple people, (2) related directly to Phoenix (as opposed to other locations), and (3) made specifically in response to an NWS Phoenix Facebook post on heat (as opposed to weather more generally; see also Walsh and Boyle, 2017). After coding ∼ 3637 (or ∼ 85 %) of the total 4304 public comments, the lead author met with co-authors to share and discuss the potential commonplaces that had emerged and to evaluate whether they met the above three criteria (see Saldaña, 2015). There was consensus among all authors about which potential commonplaces did and did not meet the criteria. Those that did not were excluded from the analysis.
To evaluate the frequency and type of public comment in relation to temperature anomalies, we utilized daily minimum and maximum temperature data, as well as archived excessive heat warnings, issued by the NWS (https://www.weather.gov/psr/heat, last access: 30 April 2021). Quality-controlled data for the first-order station at the Phoenix Airport (period of record from 1933 to 2019) were acquired from the Applied Climate Information System website (http://xmacis.rcc-acis.org/, last access: 1 May 2021). Percentile-based approaches are commonly used to study extreme heat events (Meehl and Tebaldi, 2004; Perkins and Alexander, 2013). Following Shortridge et al. (2019), percentiles for minimum and maximum temperature were estimated using an 11 d moving window centered on the day of interest for the period of record between 15 May and 15 October to remove seasonality effects (Montecinos et al., 2017). We defined heat events when maximum and/or minimum temperatures exceeded the 95th percentile.
Of the 13 categories (or types) of comments identified (Table 1), the most common was the sharing of feelings or reactions (48 %). Tags was the second most common (14 %), followed by comparisons (8 %). Our analysis of the comments within and across each of the total of 13 categories revealed two salient commonplaces, i.e., (1) the normalization of heat (i.e., that heat is normal or to be expected) and that (2) heat is seen as a marker of community identity (i.e., that the ability to withstand heat is part of being Phoenician). Both commonplaces validate perceptions held within the NWS Phoenix about the community norms, beliefs, and values shared among members of the local public.
Table 1Summary of public comment categories (or types) (US National Weather Service Phoenix Arizona, 2021).
Evidence for the normalization of heat was most prevalent in the sharing of feelings or reactions. Often, the feelings expressed were of frustration about the heat but with resignation toward or acceptance of its perceived normalcy. For example, as expressed in the following public comments, “Arizona is that feeling when you open an oven to check on your cookies and it burns your face except there's no cookies and you can't escape”, and “I get it, this is the life I made for myself” (see also Fig. 1). Other evidence for the normalization of heat was found in feelings or reactions that conveyed a lack of distinction, or at times possibly a sense of confusion, about maximum temperatures. This lack of distinction and/or sense of confusion is illustrated, for example, in the following public posts: “After it reaches 100[∘F], what really is the difference? All we can say here is, `but it's a dry heat' ha!”, and “What makes 113[∘F] excessive heat but 109[∘F] not?” Finally, the few questions asked about heat and its potential health risks, appeals to safety, and changes in plans relative to the prevalence of feelings or reactions that expressed resignation may further suggest that, having been normalized, warnings about heat are not received with concern.
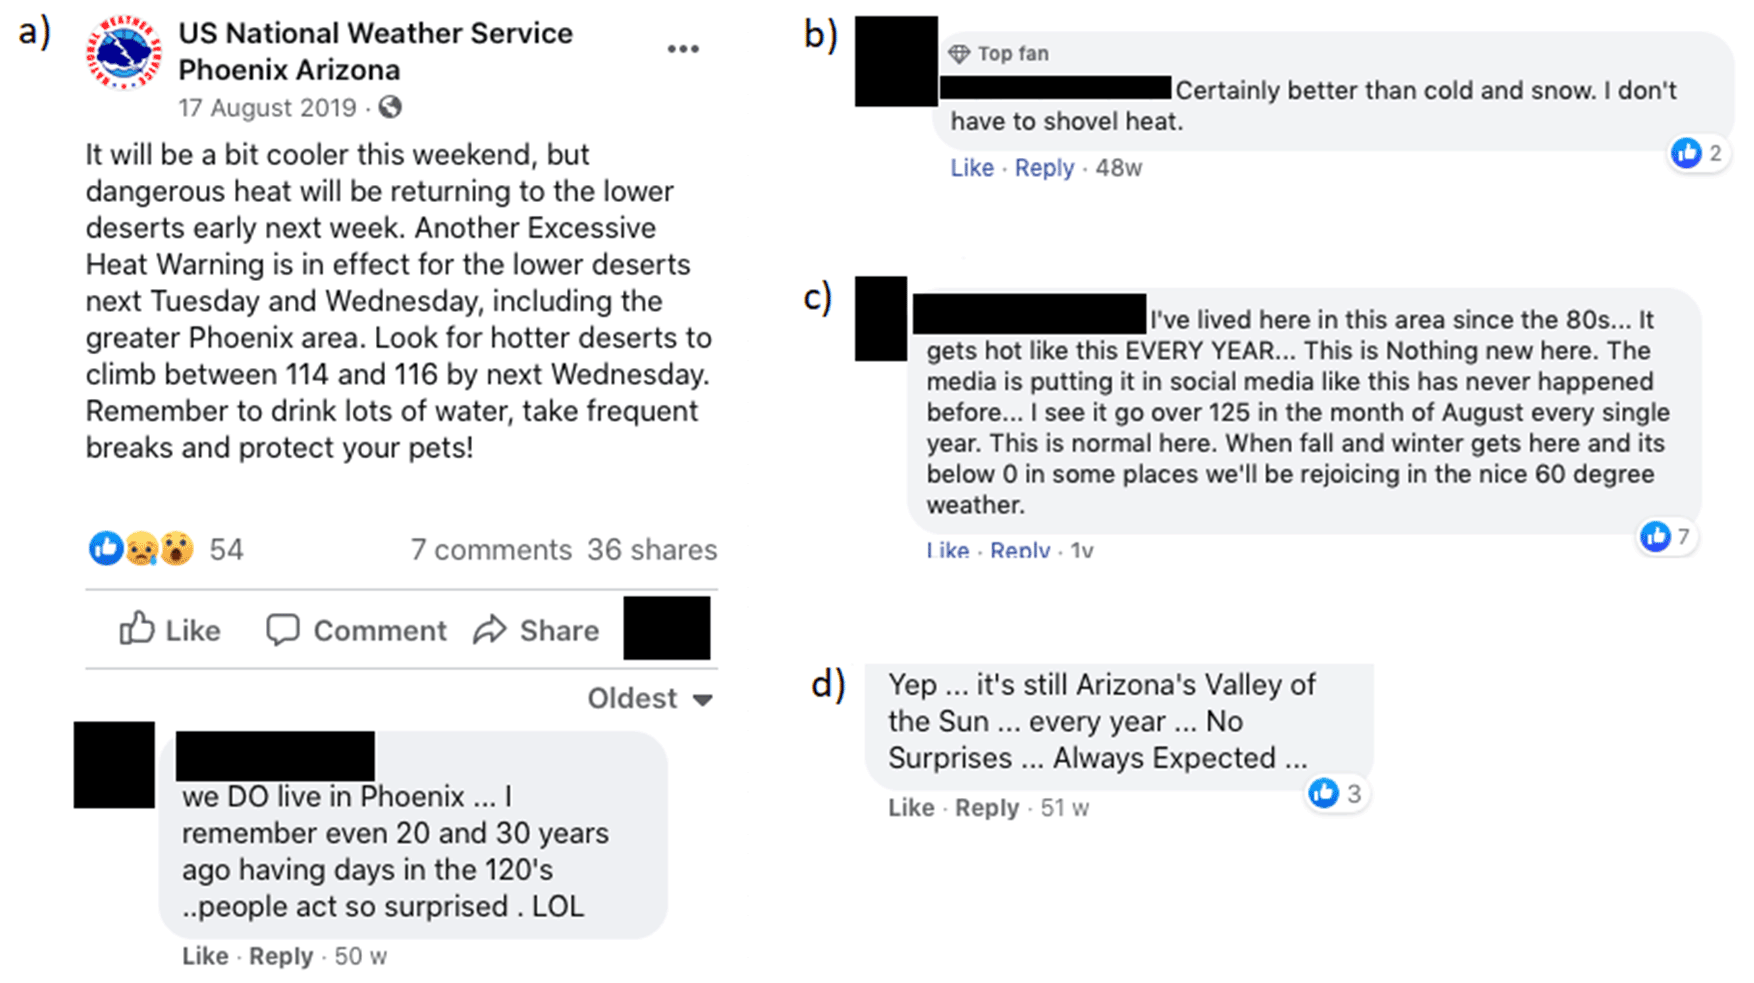
Figure 1(a–d) Comments posted by the public in Phoenix, AZ, reflecting the normalization of (and their resignation toward) heat.
The second commonplace, also most prevalent in feelings or reactions, is the role of heat as a marker of community identity, wherein the ability to withstand heat is communicated with pride and used as a means of inclusion (e.g., “Records are meant to be broken!”). In contrast, the inability to withstand heat is sometimes met with rebuke and used as a means of exclusion (e.g., “If you can't stand the heat, get out of Arizona!”, or “Even my dog is used to it. Hot schmot. Get over it.”). Such sentiments are especially common in memes (not shown here due to copyright protection) depicting movie characters in battle with accompanying text like, “Stop whining about the heat, we are Arizonians!” and “You merely adopted the Arizona heat. I was born into it. Molded by it.” Though the normalization of heat and heat as a marker of community identity are two distinct commonplaces, the latter does also offer evidence for the former, as notions of community are built in part around norms (i.e., in this case, that heat is normal; see Lidskog, 2018).
NWS Phoenix posted at least once on a total of 231 d between 2015 and 2019 (Fig. 2), with all excessive heat warnings corresponding to an NWS post on the same day or on the day prior. Posting frequency increased throughout the study period by 10 posts per year, from 26 in 2015 to 66 in 2019. A single post occurred on 148 d, and 83 d involved multiple posts. Multiple post days increased from 3 in 2015 to 35 in 2019, while single posts grew from 23 in 2015 to a maximum of 39 in 2018. Comparing days with multiple and single posts with a two-sample Student's t test, multiple post days generated significantly more engagement in terms of public reactions and comments ( and , respectively) but not shares (p=0.102). Public engagement was inversely correlated with the day of year (Spearman's correlation = −0.46, ), implying that responses were more frequent earlier in the warm season (e.g., June–July) than later (August–September). Nonetheless, extreme heat events generated responses even later in the year (e.g., September 2017 and August 2019). Any time extreme heat occurred, NWS posted at least once on Facebook. In several cases, NWS began posting several days before extreme temperatures (Fig. 2), eliciting the largest number of responses between 1 and 3 d before the extreme temperatures were observed. The 16 June 2017 posts generated the most single-day responses (8455), with the 22 July 2018 event including 3056 responses. Both heat events involved 3 d where daily maximum temperature records were set.
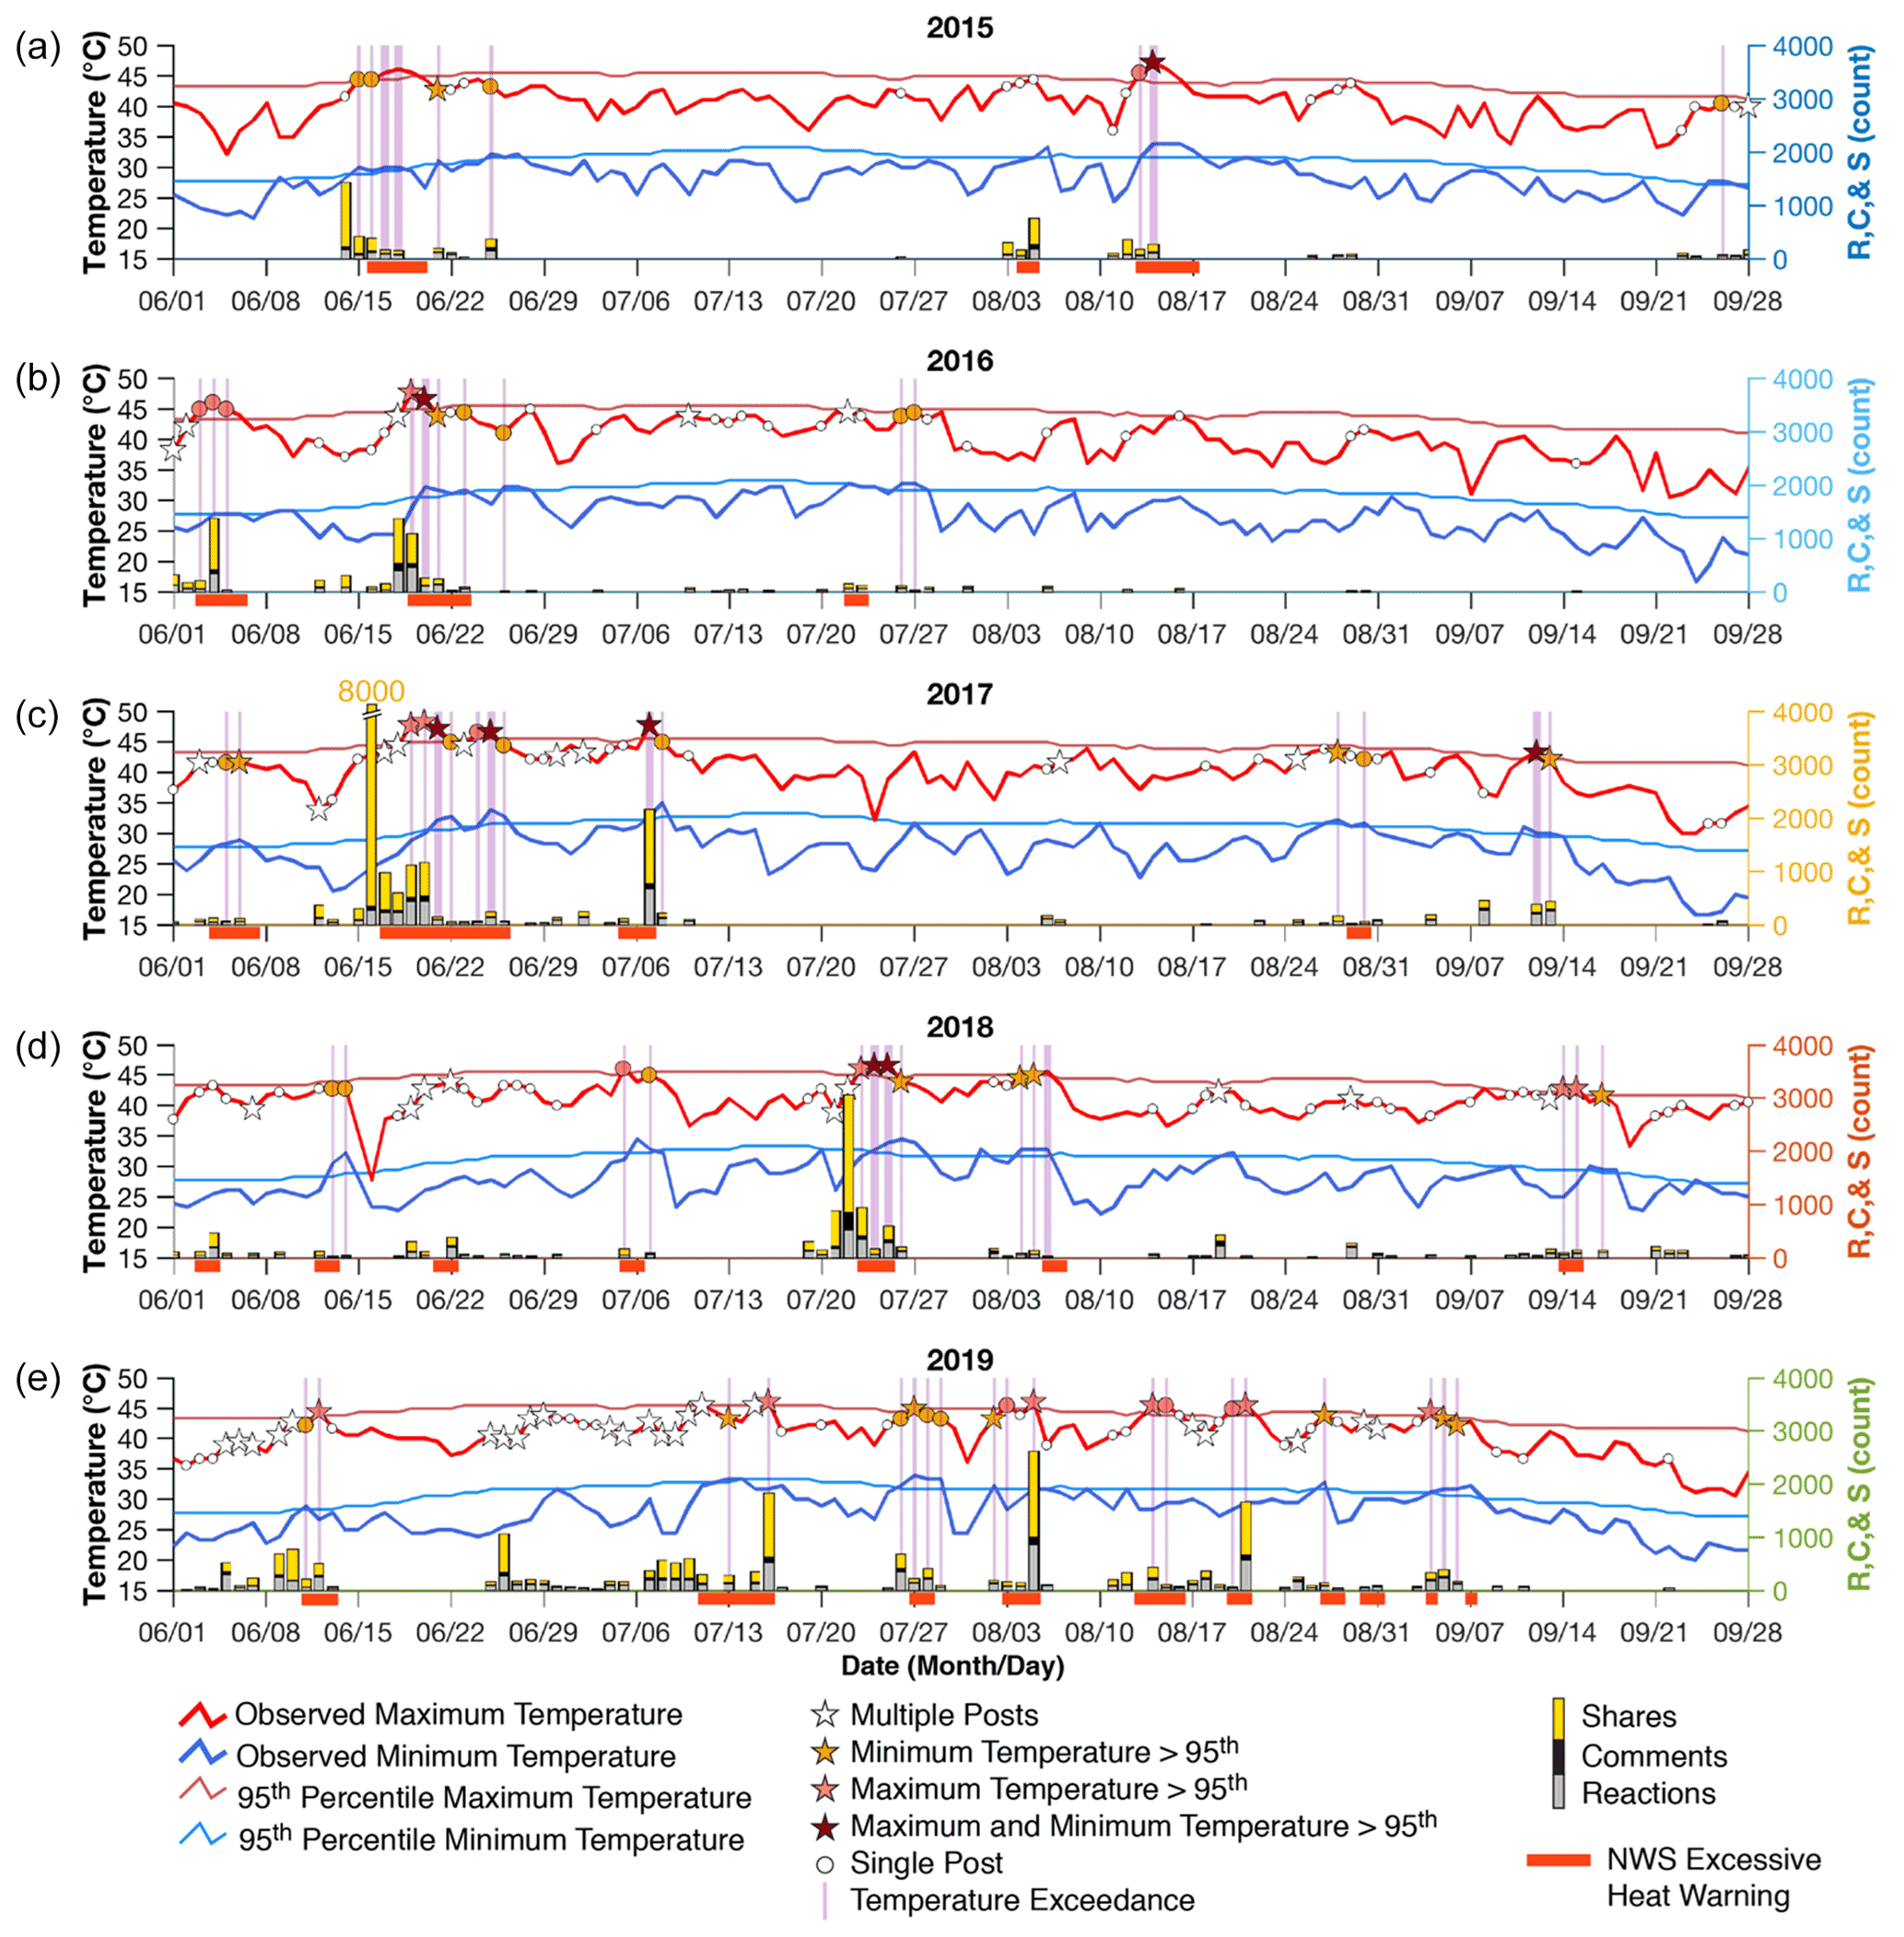
Figure 2Phoenix Airport temperatures (left y axis) and Facebook engagement (right y axis), with reactions (R), comments (C), and shares (S) for the NWS Phoenix spanning the June–September periods for (a) 2015, (b) 2016, (c) 2017, (d) 2018, and (e) 2019. Excessive heat warnings are shown by red bars along the x axes.
4.1 The normalization of heat
Rather than asking questions about the heat and its potential health risks, or alerting others to those risks, public comments in response to NWS Phoenix heat-related forecast posts were more likely to communicate a feeling or reaction, often of frustration and/or resignation toward the perceived normalcy of heat. However, the normalization of heat is not unique among this audience. For example, Abrahamson et al. (2008) found that some individuals in the UK did not perceive heat to be a risk to their health specifically because of their prolonged exposure to it over time. This raises important questions about how to encourage those accustomed to heat to protect themselves from its potential health risks. One strategy might be to add more texture to the communication of heat risk, for example, by using more clearly differentiated terms than the commonly used descriptors of “excessive heat”, “dangerous heat”, and “record heat”. Another strategy might be to offer more detail, for example, about what risks could be present (or otherwise increase in likelihood of occurrence) at what temperature ranges and for which groups. Lastly, an additional strategy might be to emphasize the real potential specifically of local heat risks, for example, by way of links to local news stories documenting incidents of heat-related illness. Appendix A contains a recent example of how NWS Phoenix has begun to apply these strategies (Fig. A1 in the Appendix). It also includes examples suggested by the authors (Table A1 in the Appendix). It is important to note that any new messaging should additionally strive to be consistent with risk communication best practices (e.g., Li et al., 2021; Lindell and Perry, 2012; Mileti and Peek, 2000; National Weather Service, 2016).
4.2 Heat as a marker of community identity
Heat as a marker of community identity is a strong commonplace. Although, in Phoenix, people were more likely to react with or express feelings of frustration about the heat, they often conveyed a related sense of pride, solidarity, and community membership about their ability to withstand it. Such sentiments were particularly pronounced in the memes posted by the public which, research has shown, can contain powerful messages of community norms and expectations (Dancygier and Vandelanotte, 2017; Kahan et al., 2017; Ross and Rivers, 2019). Simply cautioning a public that prides itself on withstanding the dangers of heat may, therefore, not work to convince people that they are truly at risk and should adopt behavioral changes to keep themselves safe. Rather, carefully drawing on and possibly reframing signals of community membership as conveyed in public posts may offer benefits for encouraging the acceptance of risk and the enactment of protective behavior (see also Lambrecht et al., 2019). For example, reframing heat safety as a community norm or communicating that protection against heat builds a stronger community could be potentially effective ways to utilize sense of belonging to encourage safety (Table A1).
4.3 The timing of messaging
The decline in public responses with time during warm seasons (Fig. 2) supports the normalization of heat also as the year progresses. However, several occasions on which responses increased late in the year provide guidance to increasing community engagement. The greater frequency of NWS posts and responses during 2019 highlights additional strategies to maintain community engagement. For example, using creative ways – following best practices – to communicate the same information (e.g., through infographics and videos) or highlighting records may serve as mechanisms to attract public attention (Dunlap and Lowenthal, 2016; Lazard and Atkinson, 2015). Last, although NWS Phoenix Facebook posts were typically coincident with extreme heat and overlapped with or preceded excessive heat warnings, there is evidence to suggest that posting several days in advance and posting multiple times per day (i.e., early and often) offers actionable information for the NWS to provide the public with an early heat warning system.
The identification of commonplaces can serve as one approach to closing knowledge gaps between communicators of risk and receiver audiences (the public). Our analysis of public comments in response to heat-related forecasts on the NWS Phoenix Facebook site validated NWS forecaster beliefs and revealed two predominant commonplaces, i.e., (1) the normalization of heat and (2) heat as a marker of community identify. These commonplaces reflect the norms, beliefs, and values that may present challenges to the effectiveness of heat risk communication. They imply discouragement of protective action, but they can also be harnessed in an effort to promote positive behavioral change. A promising direction for future research is to explore whether the above-described or other recommendations can help to reorient norms, beliefs, and values toward the encouragement of protective action. Additional research into the prevalence of these commonplaces across other regions characterized by extreme heat will provide important test beds for the potential transferability of newly crafted heat risk communication to other regions. Delivery strategies that may also increase the effectiveness of heat risk communication include messaging campaigns beginning several days in advance of a forecast of extreme heat which, especially if they leverage commonplaces, might garner more attention. Later in the season, focused posts that attract attention (e.g., records and comparisons with other locales) may also serve to communicate heat safety strategies while providing interesting information to the community. Such endeavors related to the content and timing of messaging will only gain in importance and value as the heat risk and population's exposure to extreme heat continue to increase.
The NWS Phoenix Facebook post below, from 9 September 2021, includes examples of messaging informed by the commonplaces identified. Specifically, the normalization of heat is countered in the first paragraph, and heat as a marker of community identity is reframed in the second.
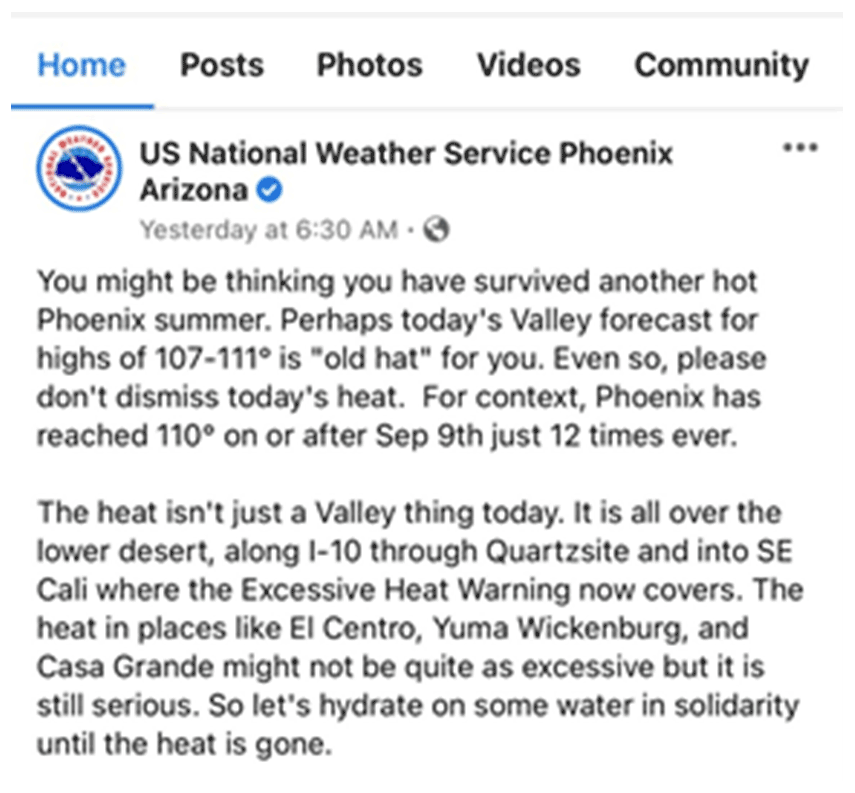
Figure A1Example of NWS Phoenix heat risk messaging informed by the commonplaces identified (9 September 2021).
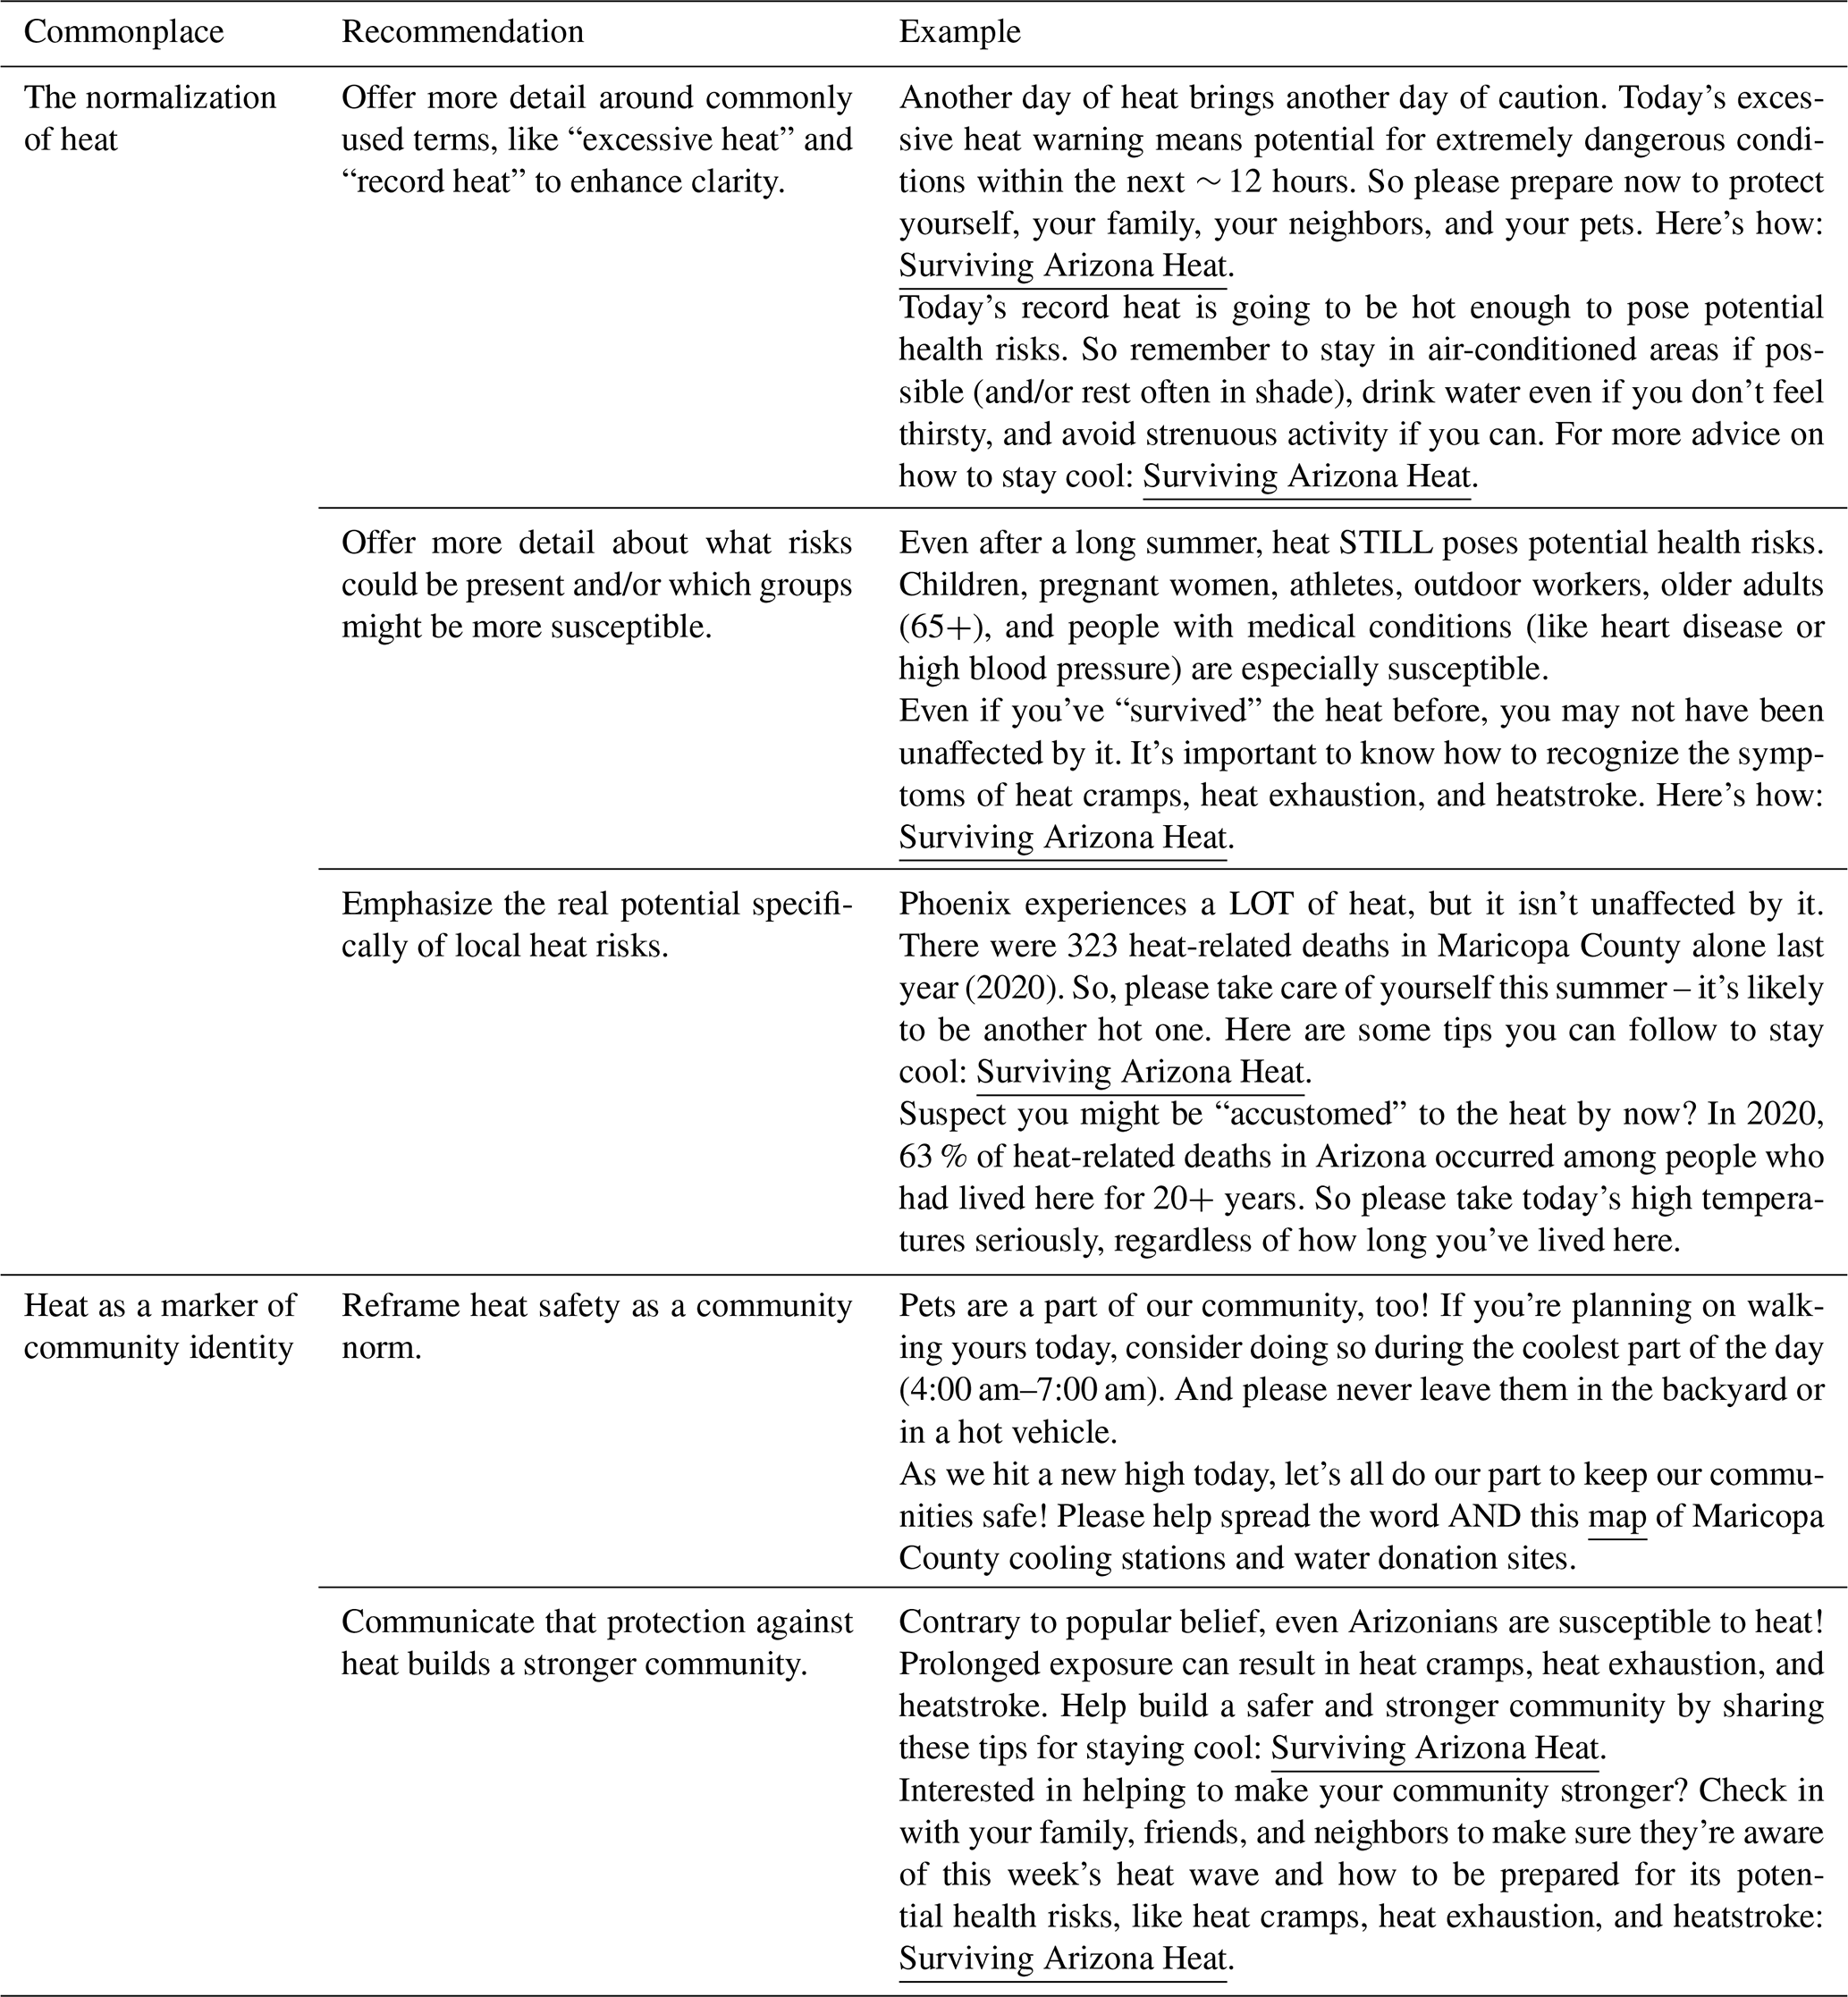
The table below contains examples suggested by the authors for informing messaging using the commonplaces identified. The table is organized by each commonplace and the set of corresponding recommendations provided in Sect. 4.1 and 4.2.
Table A1Suggested examples of heat risk messaging informed by the commonplaces identified.
The analysis code for the Phoenix data in MATLAB is available upon request.
All data are publicly available and are also available from the authors upon request.
KL, BJH, and KV conceptualized and designed the research. KL and BJH performed the analyses. KL, BJH, and KV prepared the paper, with critical input from BF.
The contact author has declared that neither they nor their co-authors have any competing interests.
Publisher’s note: Copernicus Publications remains neutral with regard to jurisdictional claims in published maps and institutional affiliations.
We wish to thank the editors and anonymous reviewers, for their thoughtful comments and feedback. We also thank Paul Iñiguez for his constructive input to an early version of this article.
This research has been supported by the NOAA International Research and Applications Project (IRAP) (grant no. NA18OAR4310341).
This paper was edited by Kirsten von Elverfeldt and reviewed by Wendy Bohon and one anonymous referee.
Abrahamson, V., Wolf, J., Lorenzoni, I., Fenn, B., Kovats, S., Wilkinson, P., Adger, W. N., and Raine, R.: Perceptions of heatwave risks to health: interview-based study of older people in London and Norwich, UK, J. Public Health, 31, 119–126, https://doi.org/10.1093/pubmed/fdn102, 2008.
CDC (Centers for Disease Control and Prevention): Heat-Related Illness, available at: https://www.cdc.gov/pictureofamerica/pdfs/Picture_of_America_Heat-Related_Illness.pdf (last access: 20 March 2021), 2017.
Chowdhury, P. D. and Haque, C. E.: Knowledge of the environmental risk and communication gaps between experts and the public: The case of climate change-induced heat waves in Winnipeg, Prairie Perspect, 11, 99–118, 2008.
Chowdhury, P. D., Haque, C. E., and Driedger, S. M.: Public versus expert knowledge and perception of climate change-induced heat wave risk: A modified mental model approach, J. Risk Res., 15, 149–168, https://doi.org/10.1080/13669877.2011.601319, 2012.
Dancygier, B. and Vandelanotte, L.: Internet memes as multimodal constructions, Cogn. Linguist., 28, 565–598, 2017.
Dunlap, J. C. and Lowenthal, P. R.: Getting graphic about infographics: design lessons learned from popular infographics, Journal of Visual Literacy, 35, 42–59, 2016.
Ebi, K. L., Teisberg, T. J., Kalkstein, L. S., Robinson, L., and Weiher, R. F.: Heat watch/warning systems save lives: estimated costs and benefits for Philadelphia 1995–98, B. Am. Meteorol. Soc., 85, 1067–1073, https://doi.org/10.1175/BAMS-85-8-1067, 2004.
Harlow, R. M.: Topoi and the reconciliation of expertise: A model for the development of rhetorical commonplaces in public policy, J. Tech. Writ. Commun., 45, 57–75, https://doi.org/10.2190/TW.45.1.d, 2015.
Hawkins, M. D., Brown, V., and Ferrell, J.: Assessment of NOAA National Weather Service methods to warn for extreme heat events, Weather Clim. Soc., 9, 5–13, https://doi.org/10.1175/WCAS-D-15-0037.1, 2017.
Kahan, D. M., Jamieson, K. H., Landrum, A., and Winneg, K.: Culturally antagonistic memes and the Zika virus: An experimental test, J. Risk Res., 20, 1–40, https://doi.org/10.1080/13669877.2016.1260631, 2017.
Keul, A. G., Brunner, B., Allen, J., Wilson, K. A., Taszarek, M., Price, C., Soleiman, G., Sharma, S., Roy, P., and Aini, M. S.: Multihazard weather risk perception and preparedness in eight countries, Weather Clim. Soc., 10, 501–520, https://doi.org/10.1175/WCAS-D-16-0064.1, 2018.
Lambrecht, K., Hatchett, B., Walsh, L., Collins, M., and Tolby, Z.: Improving visual communication of weather forecasts with rhetoric, B. Am. Meteorol. Soc., 100, 557–563, https://doi.org/10.1175/BAMS-D-18-0186.1, 2019.
Lazard, A. and Atkinson, L.: Putting environmental infographics center stage: The role of visuals at the elaboration likelihood model's critical point of persuasion, Sci. Commun., 37, 6–33, 2015.
Li, Y., Lee Hughes, A., and Howe, P. D.: Toward Win–Win Message Strategies: The Effects of Persuasive Message Content on Retweet Counts during Natural Hazard Events, Weather Clim. Soc., 13, 487–502, 2021.
Lidskog, R.: Invented communities and social vulnerability: The local post-disaster dynamics of extreme environmental events, Sustainability, 10, 4457, https://doi.org/10.3390/su10124457, 2018.
Lindell, M. K. and Perry, R. W.: The protective action decision model: theoretical modifications and additional evidence, Risk Anal., 32, 616–632, 2012.
Meehl, G. A. and Tebaldi, C.: More intense, more frequent, and longer lasting heat waves in the 21st century, Science, 305, 994–997, 2004.
Mileti, D. S. and Peek, L.: The social psychology of public response to warnings of a nuclear power plant accident, J. Hazard. Mater., 75, 181–194, 2000.
Montecinos, A., Muñoz, R. C., Oviedo, S., Martínez, A., and Villagrán, V.: Climatological characterization of puelche winds down the western slope of the extratropical Andes Mountains using the NCEP Climate Forecast System Reanalysis, J. Appl. Meteorol. Clim., 56, 677–696, https://doi.org/10.1175/JAMC-D-16-0289.1, 2017.
National Weather Service (NWS): Risk Communication and Behavior: Best Practices and Research Findings, 17 September 2001, available at: https://www.performance.noaa.gov/wp-content/uploads/Risk-Communication-and-Behavior-Best-Practices-and-Research-Findings-July-2016.pdf (last access: 29 November 2021), 2016.
National Weather Service (NWS): Weather Fatalities 2019, Weather Related Fatality and Injury Statistics, 9 April 2021, available at: https://www.weather.gov/hazstat/ (last access: 29 November 2021), 2019.
Neumann, J. L., Arnal, L., Emerton, R. E., Griffith, H., Hyslop, S., Theofanidi, S., and Cloke, H. L.: Can seasonal hydrological forecasts inform local decisions and actions? A decision-making activity, Geosci. Commun., 1, 35–57, https://doi.org/10.5194/gc-1-35-2018, 2018.
Perkins, S. E. and Alexander, L. V.: On the measurement of heat waves, J. Climate, 26, 4500–4517, https://doi.org/10.1175/JCLI-D-12-00383.1, 2013.
Ross, A. and Rivers, D.: Internet memes, media frames, and the conflicting logics of climate change discourse, Environ. Commun., 13, 975–994, https://doi.org/10.1080/17524032.2018.1560347, 2019.
Saldaña, J.: The coding manual for qualitative researchers, 3rd Edn., Sage, Los Angeles, CA, 2015.
Schifano, P., Leone, M., De Sario, M., de'Donato, F., Bargagli, A. M., D'Ippoliti, D., Marino, C., and Michelozzi, P.: Changes in the effects of heat on mortality among the elderly from 1998–2010: results from a multicenter time series study in Italy, Environ. Health, 11, 58, https://doi.org/10.1186/1476-069X-11-58, 2012.
Semenza, J. C., Wilson, D. J., Parra, J., Bontempo, B. D., Hart, M., Sailor, D. J., and George, L. A.: Public perception and behavior change in relationship to hot weather and air pollution, Environ. Res., 107, 401–411, https://doi.org/10.1016/j.envres.2008.03.005, 2008.
Shortridge, A., Hatchett, B. J., and Gustin, M. S.: Rise in coincidence of extreme heat in Nevada's largest urban areas, Journal of Nevada Water Resources Association, Winter 2019, 5–28, https://doi.org/10.22542/jnwra/2019/1/1, 2019.
Stephens, E. M., Spiegelhalter, D. J., Mylne, K., and Harrison, M.: The Met Office Weather Game: investigating how different methods for presenting probabilistic weather forecasts influence decision-making, Geosci. Commun., 2, 101–116, https://doi.org/10.5194/gc-2-101-2019, 2019.
Toloo, G., FitzGerald, G., Aitken, P., Verrall, K., and Tong, S.: Evaluating the effectiveness of heat warning systems: systematic review of epidemiological evidence, Int. J. Public Health, 58, 667–681, https://doi.org/10.1007/s00038-013-0465-2, 2013.
US National Weather Service Phoenix Arizona: Home [Facebook page], available at: https://www.facebook.com/NWSPhoenix/, last access: 29 November 2021.
Walsh, L. and Boyle, C.: Topologies as techniques for a post-critical rhetoric, Springer, New York, NY, 2017.
Walsh, L. and Ross, A. B.: The visual invention practices of stem researchers: An exploratory topology, Sci. Commun., 37, 118–139, https://doi.org/10.1177/1075547014566990, 2015.