the Creative Commons Attribution 4.0 License.
the Creative Commons Attribution 4.0 License.
 | 08 Oct 2021
Multi-scale virtual field experience: sedimentology and stratigraphy of Grand Ledge, Michigan, USA
Madeline S. Marshall
Melinda C. Higley
Field experiences are a critical component of undergraduate geoscience education; however, traditional onsite field experiences are not always practical due to accessibility, and the popularity of alternative modes of learning in higher education is increasing. One way to support student access to field experiences is through virtual field trips, implemented either independently or in conjunction with in-person field trips. We created a virtual field trip (VFT) to Grand Ledge, a regionally important suite of sedimentary outcrops in central lower Michigan, USA. This VFT undertakes all stages of a field project, from question development and detailed observation through data collection to interpretation. The VFT was implemented in undergraduate sedimentation and stratigraphy courses at two different liberal arts institutions, with one version of the VFT conducted in-person and the other online. The VFT was presented from a locally hosted website and distributed through an online learning platform. Students completed a series of activities using field data in the form of outcrop photos, virtual 3D models of outcrops and hand samples, and photos of thin sections. Student products included annotated field notes, a stratigraphic column, a collaborative stratigraphic correlation, and a final written reflection. VFT assessment demonstrated that students successfully achieved the inquiry-oriented student learning outcomes, and student reflection responses provide anecdotal evidence that the field experience was comparable to field geology onsite. This VFT is an example of successful student learning in an upper-level sedimentation and stratigraphy course via virtual field experience with an emphasis on local geology.
- Article
(12039 KB) - Full-text XML
-
Supplement
(1170 KB) - BibTeX
- EndNote


Field experiences for undergraduate geoscience students are key exercises in which students integrate classroom knowledge with real-world examples, implement skills, gain vocational experience and insight, and practice collaborating with a field team (Mogk and Goodwin, 2012; Petcovic et al., 2014). Bringing the field experience to students, rather than always taking students into the field, is increasingly important for reasons of accessibility, time, cost, and offering comparable opportunities to online students (Huntoon, 2012; Arthurs, 2021; Rotzien et al., 2021). Despite a long history of field trips in the geosciences, some desktop-based virtual field trips have, in fact, been shown to yield better learning experiences and outcomes than actual field trips (Zhao et al., 2020).
We both teach undergraduate-level sedimentation and stratigraphy courses that typically include a field trip, often to Grand Ledge, the closest major suite of sedimentary outcrops in Michigan, with a variety of lithologies and fossils (Kelly, 1933; Martin, 1982). Our goal in the development of this virtual field trip (VFT) was to create an accessible and remote field experience that undertakes all stages of a field project, from question development through data collection to interpretation. In the implementation of this VFT, the Albion College course was entirely online, and the Calvin University course was in-person.
Albion College is a comprehensive liberal arts institution with an enrollment of ∼ 1500 undergraduate students. Albion prioritizes building a culture of belonging and experiential learning and preparing students to translate critical thought into meaningful action. Calvin University is a comprehensive liberal arts college with an enrollment of ∼ 3000 undergraduate students. Learning at Calvin is rooted in its Christian Reformed commitment, and in the study of geosciences at Calvin, we pursue intellectual efforts to explore our world's beauty and engage in stewardship of Earth's resources.
The objectives of this project included (1) giving students an opportunity to explore outcrops in detail, which is valuable as an independent virtual experience or as preparatory work for going out in the field, (2) creating an expandable structure, with future goals of incorporating subsurface data and samples from the Michigan Core Repository, (3) addressing issues of accessibility, disorientation, limited data, limited scales of data, and inflexible implementation, which can make some VFT experiences less holistic and satisfying than in-person field trips (e.g., Hall et al., 2004; Carabajal et al., 2017), and (4) thoroughly documenting to encourage the preservation of a suite of historically and geologically important Pennsylvanian outcrops in Grand Ledge, Michigan (e.g., Milstein, 1987a).
For each section that follows, we describe part of the VFT assignment (see Supplement), its importance, and our expectations, discuss how it was implemented, and evaluate the outcomes (including student examples where relevant). The complete assignment, rubric, and other materials are available in the Supplement, and further information about the VFT and materials is available at https://serc.carleton.edu/NAGTWorkshops/online_field/activities/242310.html (last access: 22 September 2021).
1.1 Student learning outcomes (SLOs)
In this VFT, students focused on skill development instead of working towards a single “right” answer. The dual emphases of the VFT were for students to develop conceptual understanding (e.g., recognizing and describing bedding styles) and research skills (e.g., hypothesis testing and analysis). Upon successfully completing this project, students will be able to
-
apply their course knowledge to analyze the stratigraphic characteristics of a real-world field site through a virtual field experience,
-
identify and describe lithologies from a combination of outcrop photos, 3D models, and thin sections,
-
recognize and describe bedding styles and geometry from outcrop photos and 3D models,
-
create a detailed, (litho)stratigraphic column using data from SLOs 2 to 3 and additional stratigraphic column resources,
-
develop an interpretation of the depositional environment(s) for the stratigraphic column, and
-
present final products and discuss observations and the strengths and weaknesses of different interpretations.
1.2 Deliverables
Through the course of the VFT, students produced three major deliverables. First, they submitted field notes, including an annotated outcrop sketch, rock descriptions, and their original paleoenvironmental hypothesis (Parts 2–4 of the assignment; see Supplement). Second, each student submitted an original stratigraphic column with their graphical log, descriptive notes, and interpretations for each unit (Part 5 of the assignment). Third, after completing all other VFT components and engaging in a group discussion of the stratigraphic correlations as well as discussing the supporting literature, students wrote a final reflection (Part 7 of the assignment). In our experiences, students were able to complete most VFT components during the allotted class and lab time: 10 in-person hours for Calvin students, 12 online hours for Albion students. This dedicated in-class time over the course of 4–5 total days was essential to engage in the group work, particularly when considering that collaboration and discussion on an outcrop are key parts of in-person field work. In assessing student learning in this VFT, all students have unique products tied to different primary outcrops, making plagiarism a non-issue even in a virtual setting. Thus, rubrics were designed to account for the inherent variability of student products and focused largely on skill development.
1.3 VFT development
Over the course of a month, we invested substantial time to prepare this virtual experience, which included 2 full days of field work plus several weeks of image and data processing. When collecting field data to prepare this VFT, it was essential to document outcrops through photos and virtual 3D models at many scales and from multiple angles. This resulted in an experience for students similar to walking around all sides of an outcrop, stepping back, and moving in closer. In the development phase of the VFT we documented each outcrop through the following methods.
-
We explored the outcrop and marked several important places on the outcrop to be used for close-up photos. Previous work at Grand Ledge guided our outcrop choices (e.g., Martin, 1982; Venable et al., 2013).
-
360∘ photos of each outcrop were taken with a GoPro Max 360∘ camera. The 360∘ photos provided a sense of orientation for the outcrop and surrounding landscape and context.
-
Photos of the outcrop were taken at multiple levels in approximately the same plane and were compiled into an outcrop panorama photo using Adobe Photoshop (Fig. 1). Of note, photos taken using an iPhone overcame the issue of dappled shadows on the outcrops significantly better than other cameras we used. Heavy vegetation, steep cliffs, and limited outcrops created challenges in photographing all aspects of outcrops from uniform distances; therefore, panorama photos of outcrops incurred distortion during the photomerging process.
-
Additional photos of the outcrop were taken at multiple levels and from multiple angles and were compiled into a high-resolution 3D outcrop model using Agisoft Metashape Professional (2020) software and then uploaded to Sketchfab, where the marked locations of close-ups were added as annotations to the model (Fig. 2).
-
Close-up photos were taken of each marked feature. These included examples of bedding for each geologic unit, fossils, and examples of the varieties of sedimentary structures in the outcrop (Fig. 3).
-
We collected small, loose hand samples from several close-up areas that would benefit from further imaging or thin sectioning.
-
Photos of each hand sample were taken using a turntable and were processed into a 3D hand sample model using Agisoft Metashape Professional (2020) software and then uploaded to Sketchfab (Fig. 4).
-
We prepared 14 of the hand samples into thin sections, resulting in 1–3 representative samples from each locality, to capture the lithologic variation through the stratigraphy in each region of the VFT. These thin sections were photographed under plane-polarized and cross-polarized light at multiple magnifications to provide a suite of photomicrographs for students to evaluate thin sections in a virtual setting (Fig. 5).
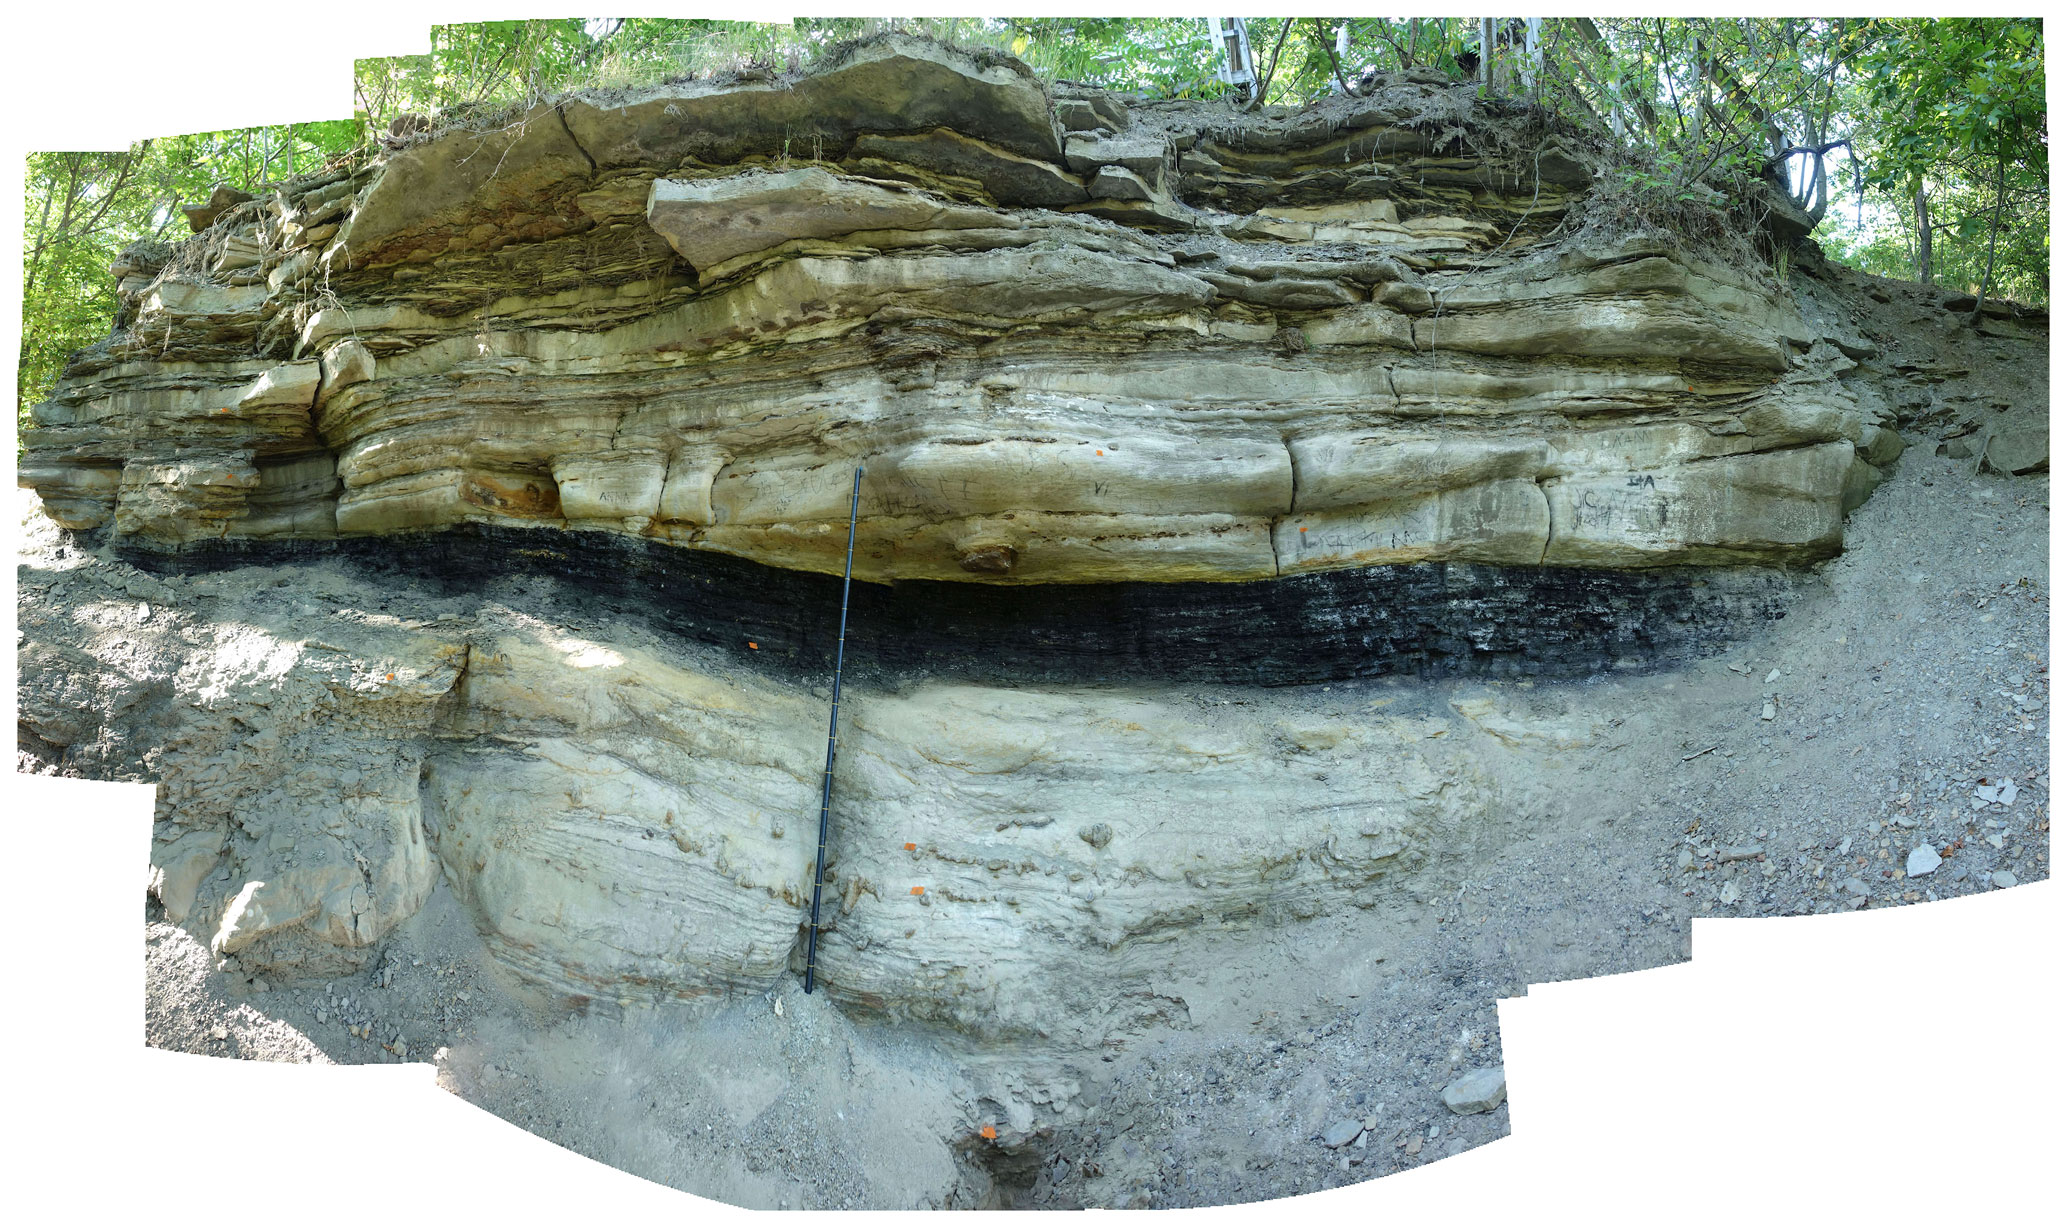
Figure 1Stitched panorama photo of the American Vitrified 2 outcrop (staff is 1.6 m and has 10 cm increments). This image is used in Parts 2–5 of the assignment. Figure 2 is the equivalent 3D model of this outcrop, and the corresponding stratigraphic log is in Fig. 6.
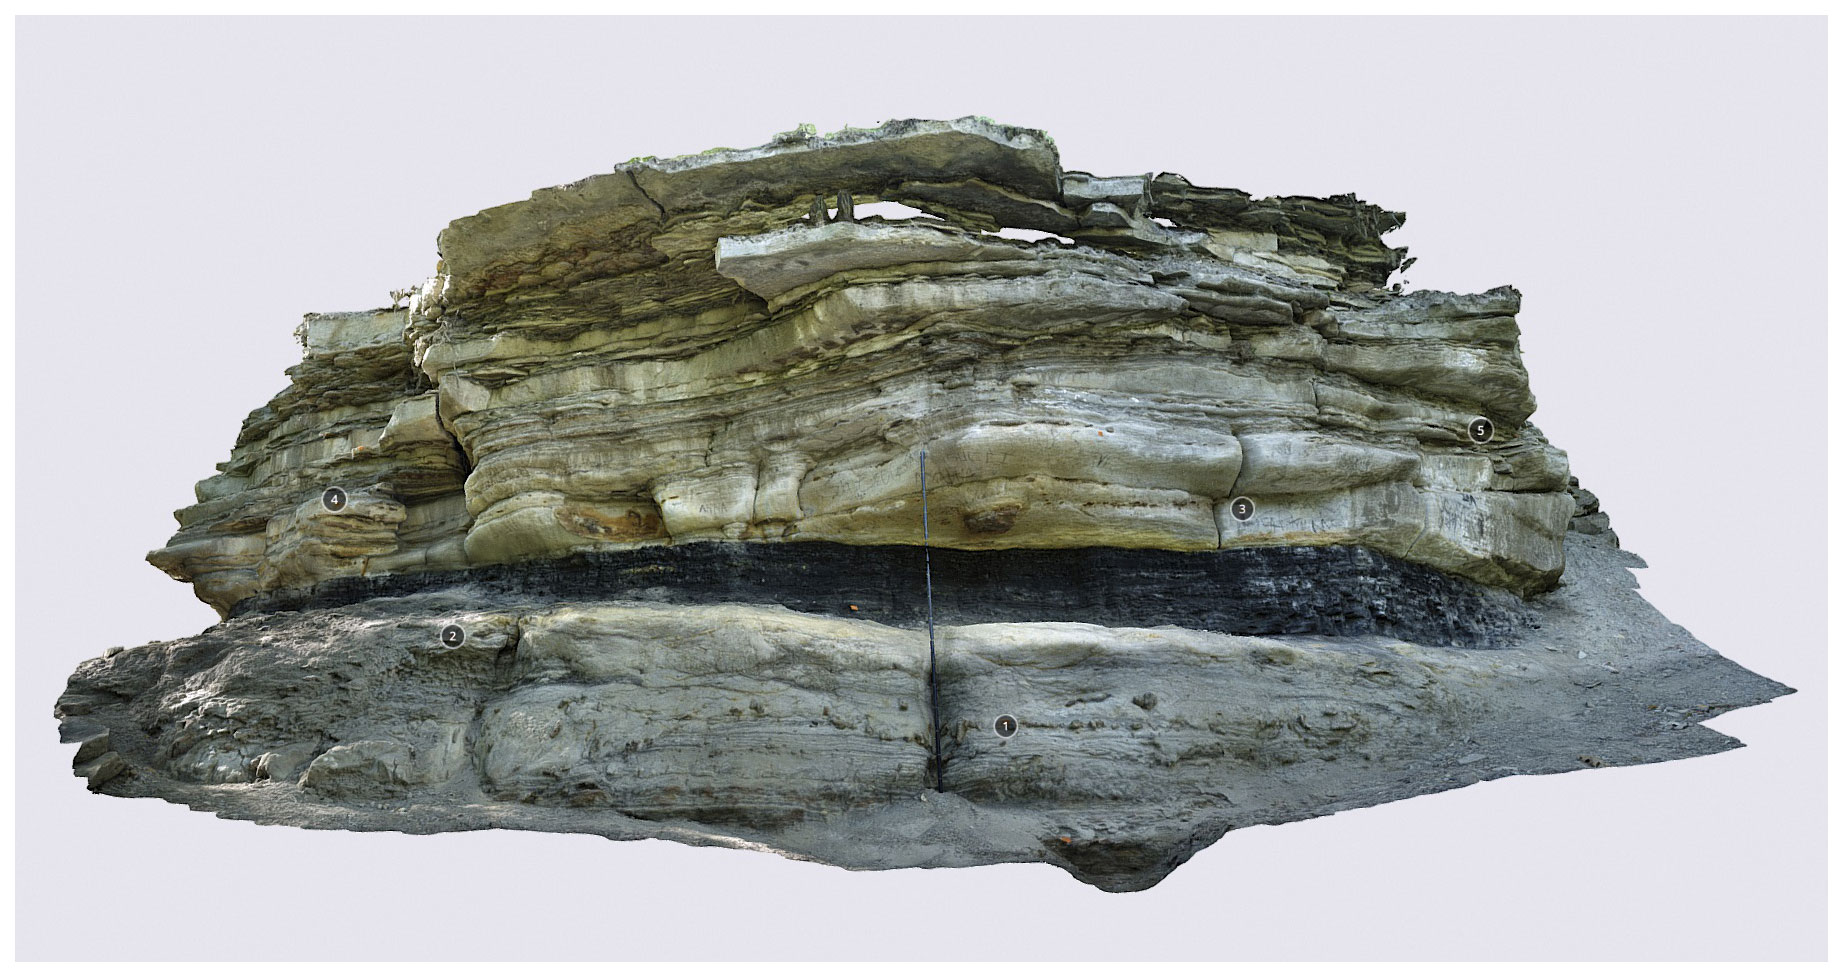
Figure 2Virtual 3D outcrop model of American Vitrified 2 (staff has 10 cm increments); annotation numbers correspond to other photo and sample data in the VFT. This is a still image of the fully manipulatable 3D virtual model of the outcrop, available via Sketchfab. This model is used in Parts 2–5 of the assignment.
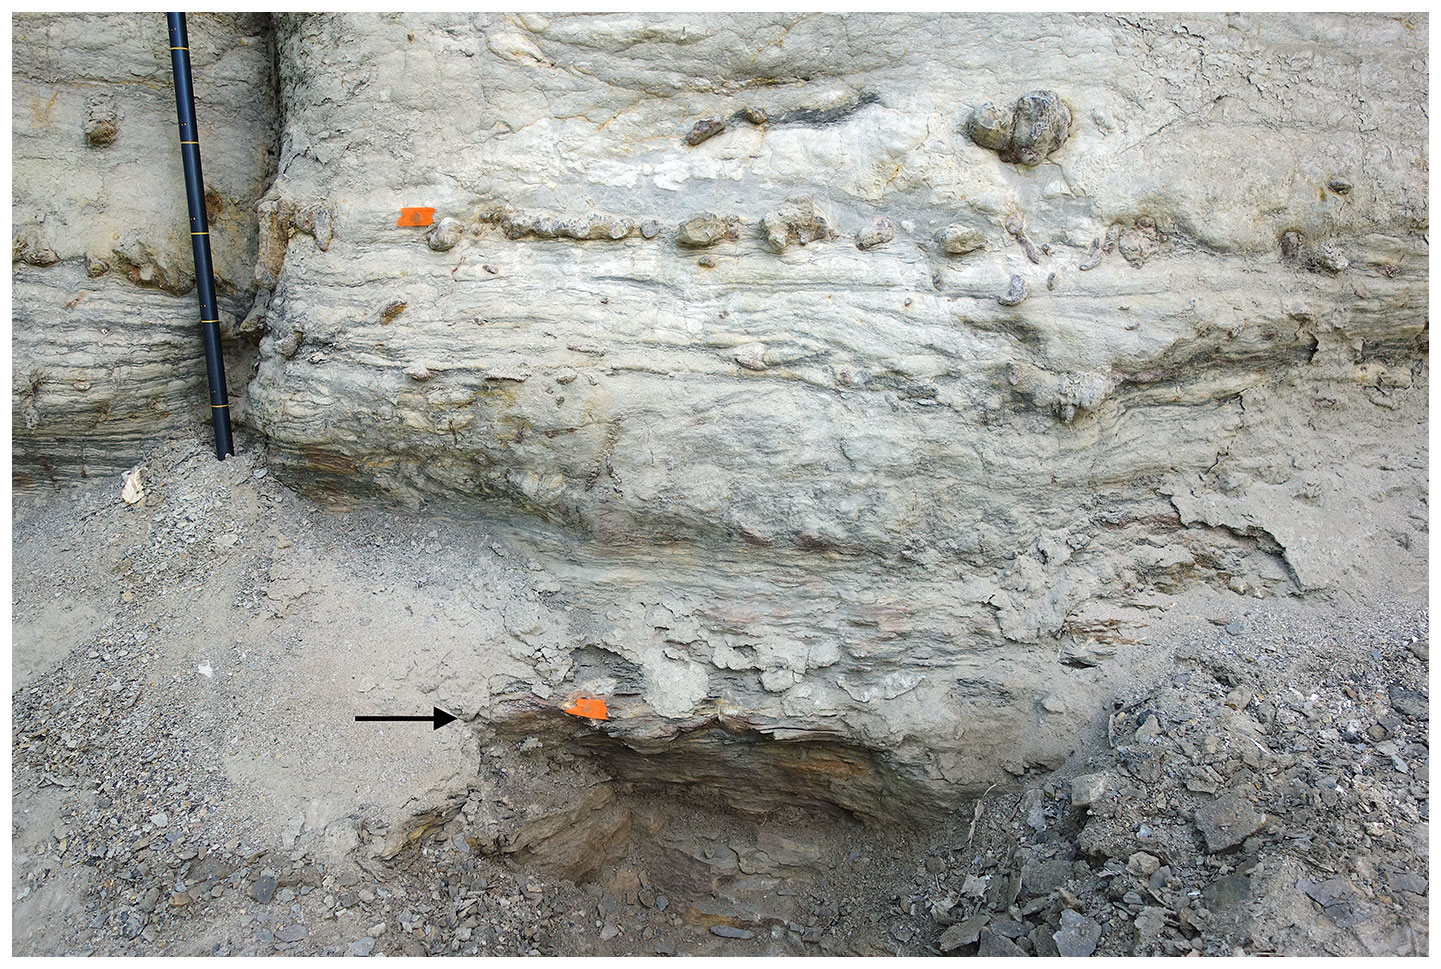
Figure 3Close-up photo of the base of the American Vitrified 2 outcrop, with location of the basal mudstone sample (AV 2-1 in Fig. 4) shown with the black arrow and orange tape (staff has 10 cm increments and is in the same location in Figs. 1–3). This photo is used in Parts 3–5 of the assignment.
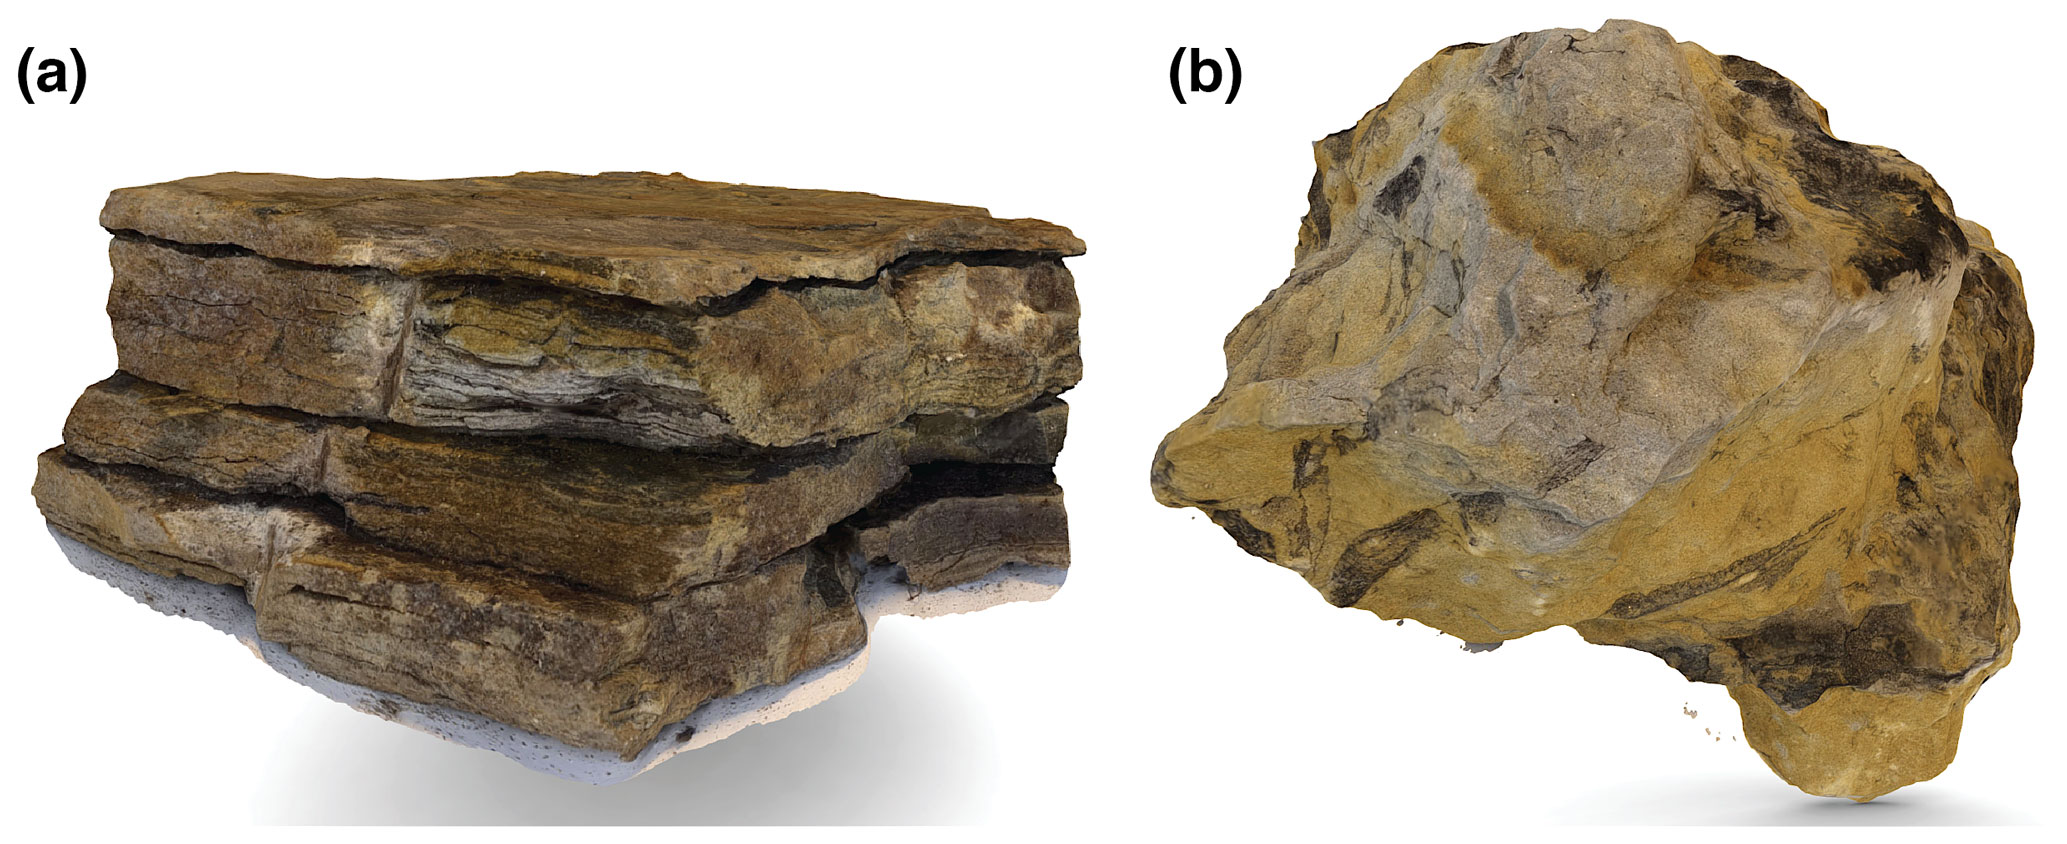
Figure 43D virtual models of hand samples from the American Vitrified 2 outcrop: (a) AV 2-1 mudstone from the base of the outcrop (arrow in Fig. 3), maximum diameter of sample 13 cm; (b) AV 2-2 sandstone with Stigmaria from the outcrop model annotation 2 (in Fig. 2), maximum diameter of sample 15 cm. These samples are available as models AV 2-1 and AV 2-2 via Sketchfab; scale bars are provided separately in still photos of these hand samples hosted for students on the project website.
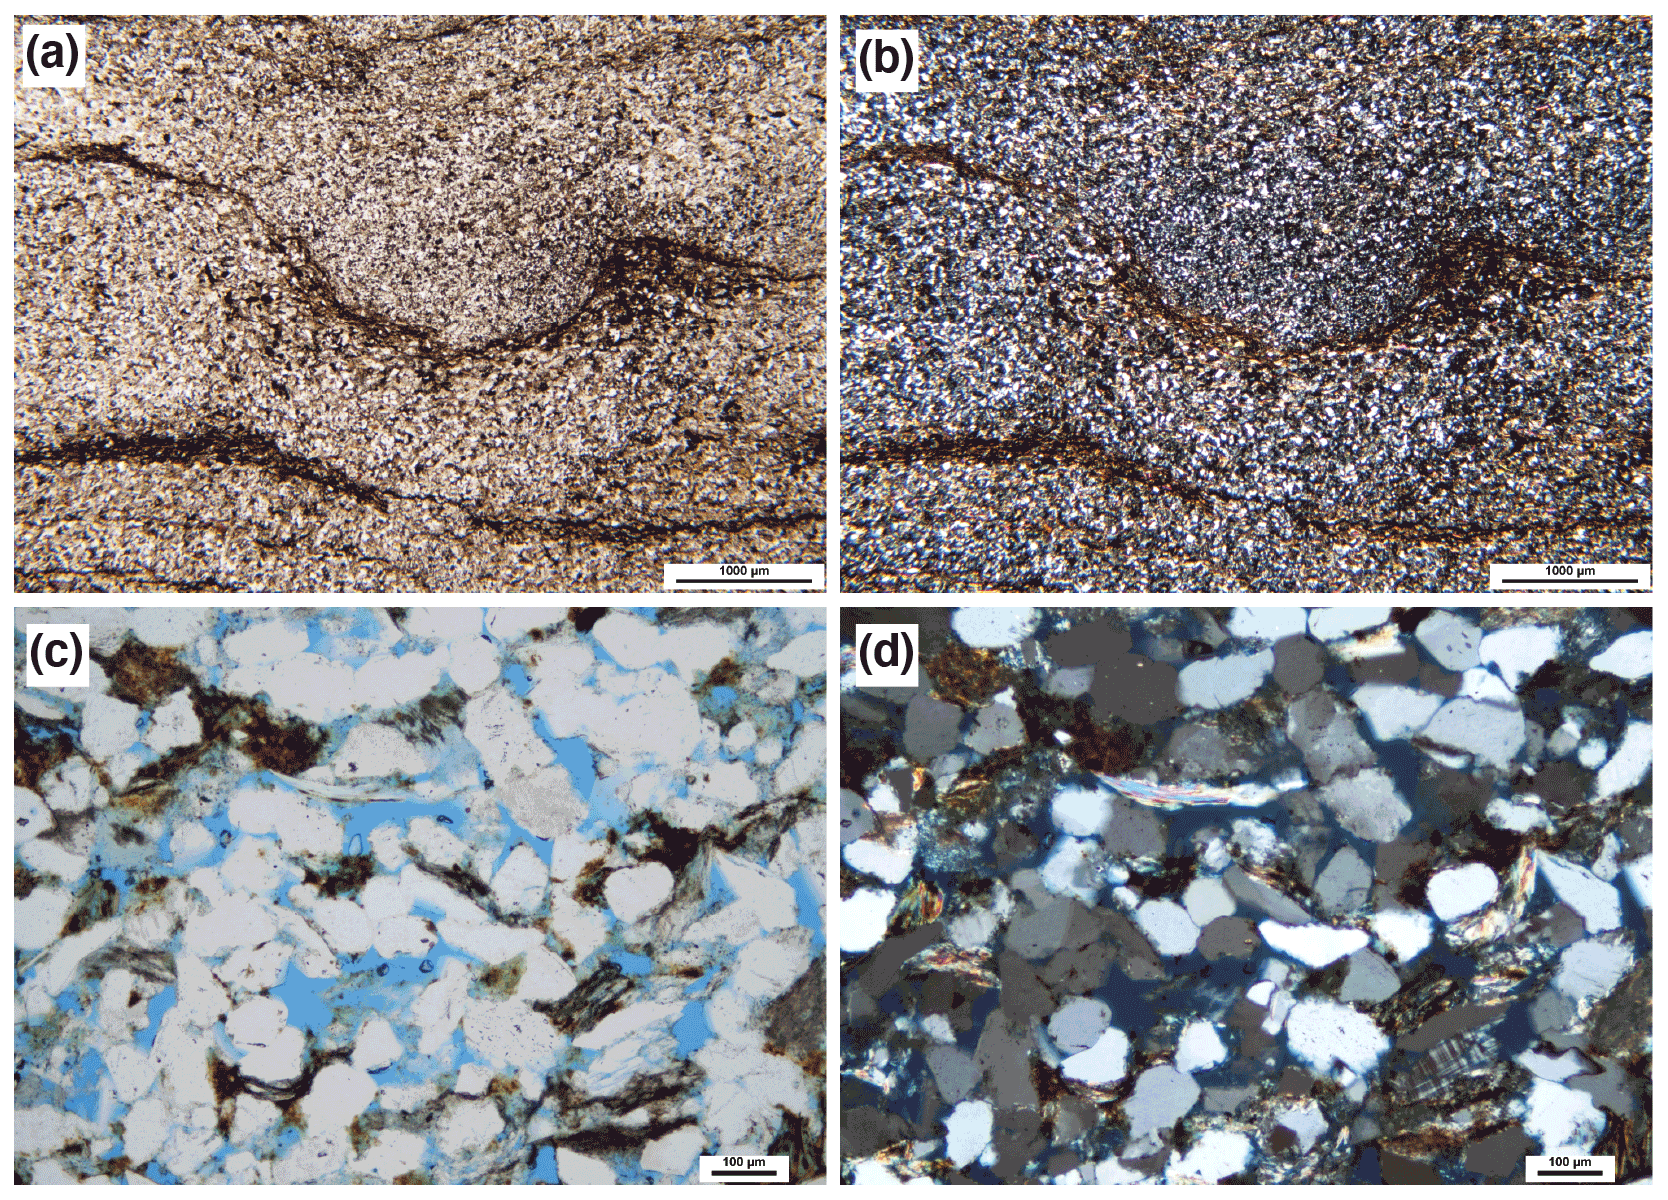
Figure 5Thin section images from American Vitrified 2, used in Part 3 of the assignment for students to precisely determine lithologies. (a) Sample AV 2-1 in PPL, the organic-rich mudstone from Fig. 4, (b) sample AV 2-1 in XPL from Fig. 4, (c) sample AV 2-2 in PPL, the sandstone from Fig. 4, and (d) sample AV 2-2 in XPL from Fig. 4. Scale bars in (a)–(b) are 1000 µm, and scale bars in (c)–(d) are 100 µm.
1.4 Ethics
This study describes a virtual field experience project completed in our respective classrooms in the fall of 2020. This was not a research project involving human subjects, students were not surveyed, and we do not report data about human subjects. Written permission was obtained from students whose work is presented here as examples.
In class periods leading up to the VFT, students engaged with concepts of lateral and vertical facies relationships, drivers of sea-level change, and environments of deposition. The first part of the VFT was designed to orient students to time and place, establishing the background geology of the Paleozoic of the Michigan Basin and making connections to broader sedimentology and stratigraphy topics (preliminary work on SLO no. 1). The students used Google Earth imagery at multiple scales, both statewide and focused on their unique outcrops in Grand Ledge, Michigan. Students worked through provided written and graphical information about the Late Paleozoic structure, stratigraphy, and climate of the Michigan Basin and surrounding areas (Milstein, 1987b; Catacosinos et al., 2000; Haq and Schutter, 2008; Towne et al., 2013; Venable et al., 2013). They also discussed the following two sets of questions with their small group, coordinating theory with the evidence presented and recording their hypotheses in their field notes. (1) Why was relative sea level low during the early Pennsylvanian? Hypothesize about the different drivers of relative sea level change that may have caused this. How might those drivers have also influenced the sedimentary record we will observe? (2) What environmental changes can you recognize in the Michigan Basin stratigraphy of the late Paleozoic? Are there particular times of high or low relative sea level?
Importantly, students were tasked with developing preliminary hypotheses about the Pennsylvanian depositional environments of Grand Ledge, which they would subsequently revise. This step of the VFT introduced important vocabulary and context and was structured to connect with concepts discussed in class. In the field, this step is about establishing familiarity with when, where, and what is above and below the interval of interest so the context can better inform our hypotheses and interpretations.
Discussion of background and framework
Establishing the context for the virtual field experience, including some regional geology and sea-level history, was a critical part of students understanding why Grand Ledge was an interesting locality to study and visit virtually. Student response to the background section was mixed, and this is one aspect that could have benefited from an initial class discussion. On in-person field trips, the leader or instructor often gives the background context before participants head to the outcrops, and a similar approach could be valuable herein. However, the goal of the background section of the project was also for students to gain more experience reading maps, stratigraphic columns, and sea-level curves and formulating hypotheses based on these. To that end, a recommended improvement would be to require students to submit these initial hypotheses immediately or have the instructor validate each hypothesis. Ideally, this part of the VFT should expand their field notes to address the context around questions 1 and 2 above: time periods of interest, primary depositional environments, paleoclimate, and field site location information.
The second part of the VFT was to become oriented to the outcrop and make an annotated sketch to record initial observations, similar to how one approaches a new outcrop in person by first taking in the big picture (preliminary work on SLO no. 1). The students used Google Earth imagery and 360∘ photos and began exploring all of the outcrop and hand sample virtual 3D models and photos for their site (Figs. 1–4). In small groups of two to three, students first accessed the materials for their assigned field site to conduct reconnaissance through a cursory examination of the available maps, imagery, and descriptions. Students then used the 3D outcrop model and outcrop photos to make an outcrop sketch in their notes; in their sketch, each student defined distinct lithologic units and annotated their sketch with any observations they could make. Students were also encouraged to record preliminary questions and hypotheses to drive their subsequent investigation. This step of the VFT yielded the primary product of an outcrop sketch with labeled units and annotated features, accompanied by notes on preliminary hypotheses about the lithologies and paleoenvironmental interpretations. This aspect of field work is essential and was incorporated to make sure students could establish their orientation and understanding of the site in space, which is a challenge both in person and virtually and is a significant accessibility issue (Hall et al., 2004). Utilizing virtual outcrop models has also been shown to be a positive and effective experience for students when engaging in virtual field experiences and developing 3D spatial thinking skills (Bond and Cawood, 2021, this issue).
Discussion of outcrop reconnaissance
Prior to the virtual field trip, we spent time scaffolding by discussing principles of making a good outcrop sketch, practicing as a class, and assessing examples (Geology Drawing Skills Handbook, 2018). That preparation made a difference in the confidence and skill of students as they approached the VFT data, given the particular challenge of sketching an outcrop with only virtual materials. One of the challenges for students was to focus on the original sedimentary features, looking past rubble, fractures or joints, weathering stains, and vegetation. While most students depicted accurate shapes and beds for their outcrops, sketches varied from being highly stylized to largely realistic.
The third part of the VFT was to identify and describe lithologies from a combination of outcrop photos, 3D models, and thin sections (SLO no. 2). The students used close-up photos tied to annotations on the 3D outcrop models (Fig. 2), 3D hand sample models and photos (Fig. 4), and thin sections made from the hand samples (Fig. 5). Notes accompanied some of the imagery to clarify locations and relationships that would aid in understanding orientations. Students first differentiated distinct units within their outcrop and then wrote a rock description for each unit. Students then studied thin sections and completed ternary QFR diagrams (Folk, 1980) with the goal of refining their rock descriptions. This step of the VFT yielded products of rock names and their QFR constituent percentages, textural descriptions, and hypotheses of depositional environments for each lithologic unit described. Additionally, students experienced the complexities and challenges of making lithologic observations in the field.
Discussion of lithologies
To accurately describe lithologies, it is important to examine multiple scales of data. In the VFT, we achieved this through outcrop photos, 3D models and photos of hand samples, and photomicrographs – this approach also replicated the order of in-person field work and subsequent laboratory investigations.
The outcrop is the first point of interaction in the field experience, requiring broad-scale observations. In asking students to define their own units in each outcrop, it rapidly became clear who was looking closely at details and who was rushing to finish: students who had not examined all parts of their available data during the reconnaissance stage invariably noted fewer units than there were hand samples for. This led to revision of their hypotheses as they collected more data at finer scales.
In the field, it is often more intuitive for students to zoom in and out of an outcrop, stepping closer to view more details. In the VFT, students had to learn that the discrete images and models at different scales were the equivalent experience. Photos of hand samples and 3D models are high enough resolution that rock texture is visible; therefore, students can make observations about grain size and mineralogy. Students did need instructor assistance to determine exactly what information could be gleaned from a hand sample. This is similar to our experiences with students interacting with physical samples in the field or lab, with particular emphasis on encouraging students to look at the primary structures and lithology, as opposed to weathering rinds or fractures.
Thin section data were a valuable component of the lithology section. At the Grand Ledge outcrops, the differences between some of the rock units are subtle (e.g., silt versus very fine sand), and grain size information is key to distinguishing them. Thin section photomicrographs allowed students to test their hypotheses of grain size, which until this point in the VFT were based on hand sample data and the general appearance of the outcrop. Students estimated percent distributions of minerals and plotted these data on QFR diagrams. Incorporating a semiquantitative component was important in offering students a concrete way to back up their interpretations. With thin section data students are challenged to revise estimates of grain size, evaluate sediment provenance, and consider possible depositional environments.
By presenting highly organized data in the VFT, it seemed possible that students would approach the VFT as if the instructors had prescribed the answers. However, students approached the VFT data with fresh eyes and did not necessarily follow the units or order of operations we had planned. This was a surprising and positive outcome and showed that a VFT can be a genuine exploration for students.
The fourth part of the VFT focused on recognizing and describing bedding styles and geometry from outcrop photos and 3D models (SLO no. 3). Students evaluated outcrop photos and 3D outcrop models (Figs. 1–3) to measure bed thicknesses in their outcrops and assess trends through the section (i.e., thinning or thickening up-section). They next identified and carefully described any sedimentary structures (e.g., flaser bedding, trough cross-bedding, burrows) and clasts (e.g., rip-up clasts, fossils of plant material) they saw, which were often difficult to distinguish due to the nature of the outcrops. Both of these components were added to their outcrop sketches and notes to refine their initial work. Students then revised their environmental interpretation hypotheses based on these new data and were encouraged to focus on how the energy, sediment supply and type, and life present changed over time through the succession of units present. This step of the VFT yielded products of actual measurements of bed thicknesses and named sedimentary structures for their outcrop, which required students to step back from the lithologic details and reassess the stratigraphic patterns. This step presents the challenge of working with incomplete or obscured evidence, since real outcrops may only show part of a cross-set, have a highly weathered surface, or present an imperfect version of a structure.
Discussion of bedding style and sedimentary structures
To accurately describe bedding geometry and other sedimentary structures, it is important to examine multiple scales and orientations of the outcrop of interest. In the VFT, we achieved this by using outcrop photos and 3D outcrop models that could be rotated and zoomed in on, in conjunction with instructor guidance on annotating images virtually on Zoom (e.g., outlining key geometries), as one would point out key features in the field.
The types of bedding at Grand Ledge are limited and often highly weathered or vegetated, and students did not always pay close enough attention to distinguish small variations. Interestingly, in some relatively monotonous outcrops, students simply did not notice major sedimentary structures (such as large-scale cross-bedding) until an instructor guided their observations. Encouraging students to “zoom out” and examine the whole outcrop did help them to see all key sedimentary structures and bedding trends but required instructor guidance. This is not dissimilar to in-person field experiences, in which students often focus on weathering features or fractures instead of the primary structures. An important aspect of preparation for the VFT is to show examples in previous classes of large-scale geometries, such as channel lenses.
In some outcrops, students took the initiative to zoom in as much as possible and also utilize the imagery from their lithology investigations, and they identified millimeter- or centimeter-scale features, such as flaser and lenticular bedding or small pockets of coal. This level of detail allowed students to confirm or revise their environmental interpretations with a high degree of confidence. Like an in-person field experience, the students who explored the entirety of an outcrop at all scales collected enough data to make the most accurate interpretations.
Part 5 of the VFT was to create a detailed, stratigraphic column using data acquired in previous sections (SLO nos. 2–4) in order to develop an interpretation of the depositional environment(s). Detailed instructions on how to construct a stratigraphic column as well as several examples were provided for the students. Our instructions were adapted from exercises on constructing virtual graphic logs (Bristow, 2020) and clastic facies analyses (Anderton, 1985). Our examples came from Geological Field Techniques (Coe, 2010), the Art of Geological Field Sketches (Noad, 2016), Geology Drawing Skills Handbook (2018), various notes on field geology and stratigraphy techniques (e.g., Susan Kidwell, personal communication, 2014), and our personal field books. A pdf of a blank logging sheet was provided to the students to construct their log digitally (e.g., in a pdf viewer, Word, PowerPoint, or Google Slides) or on paper by hand in a standardized format.
Prior to the VFT, students prepared by learning how to make a stratigraphic column. In the online-only format at Albion, students worked through a virtual graphic logs lab exercise (Bristow, 2020), preparing students to also draw using their computers. At Calvin, students practiced through making an in-person outdoor stratigraphic column of campus buildings and using supplements from the VFT.
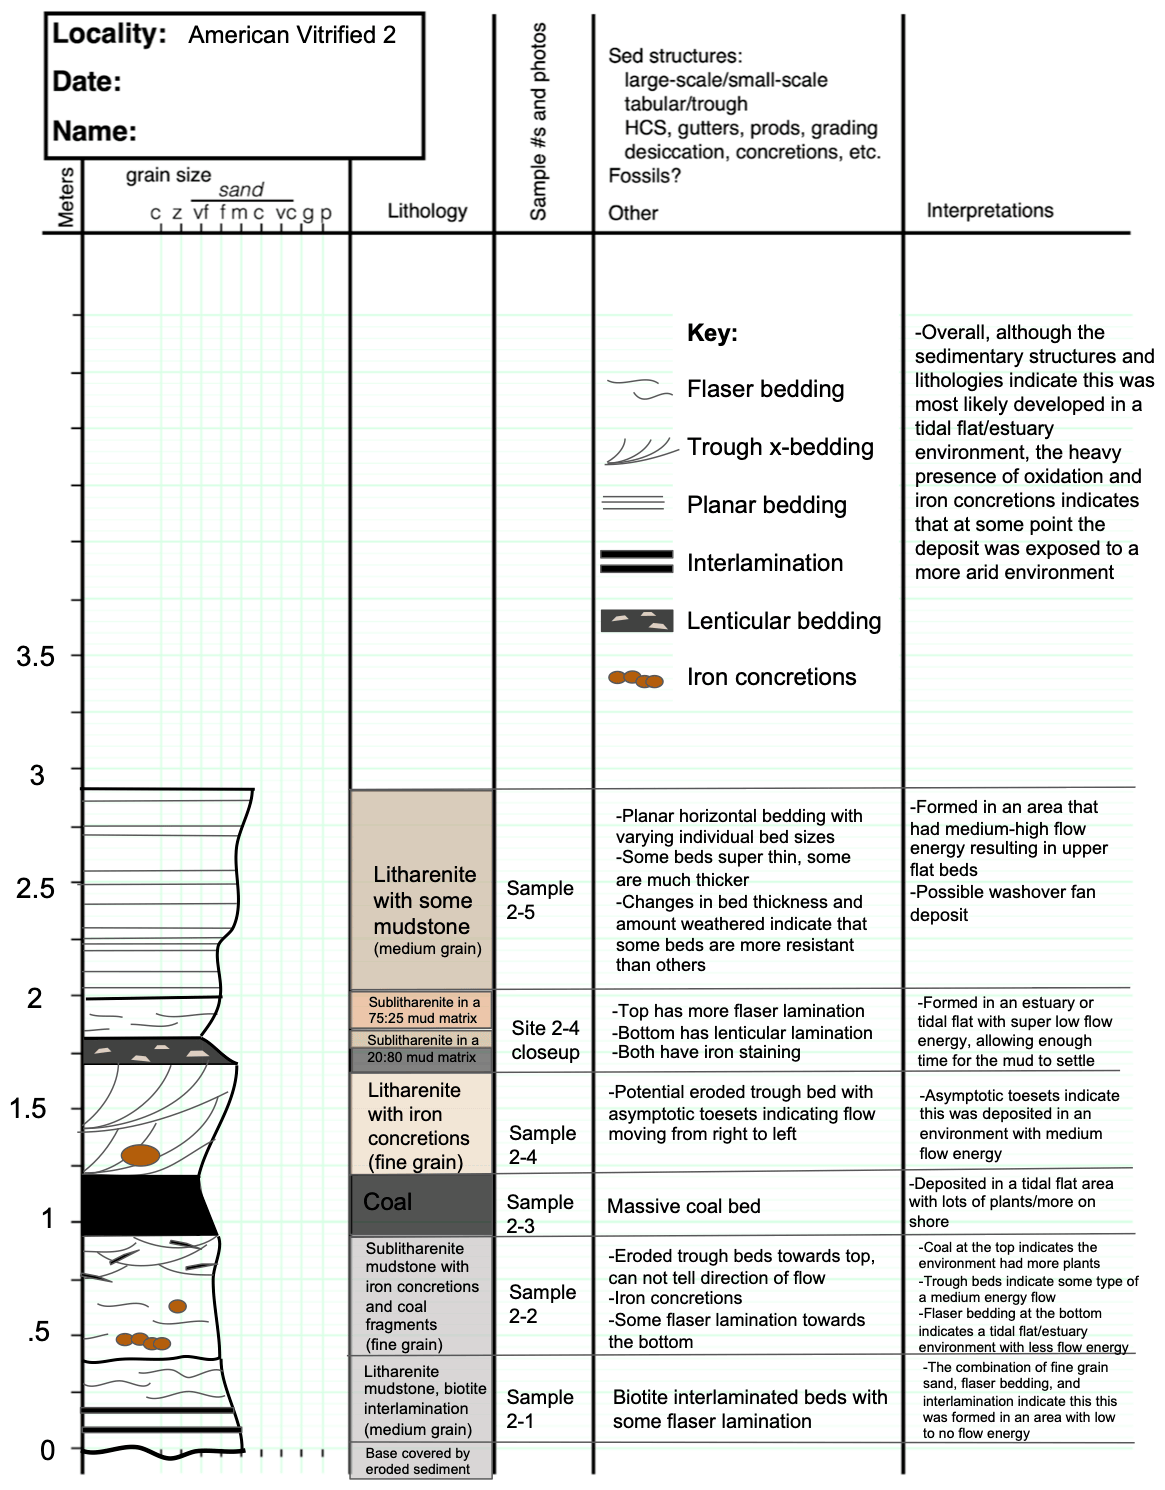
Figure 6Example student stratigraphic section drafted from American Vitrified 2 outcrop data. This is a product from Part 5 of the assignment, using data collected in Parts 1–4 of the assignment (examples of data shown in Figs. 1–5). Stratigraphic columns that students produce include the graphic log, descriptions, and interpretations.
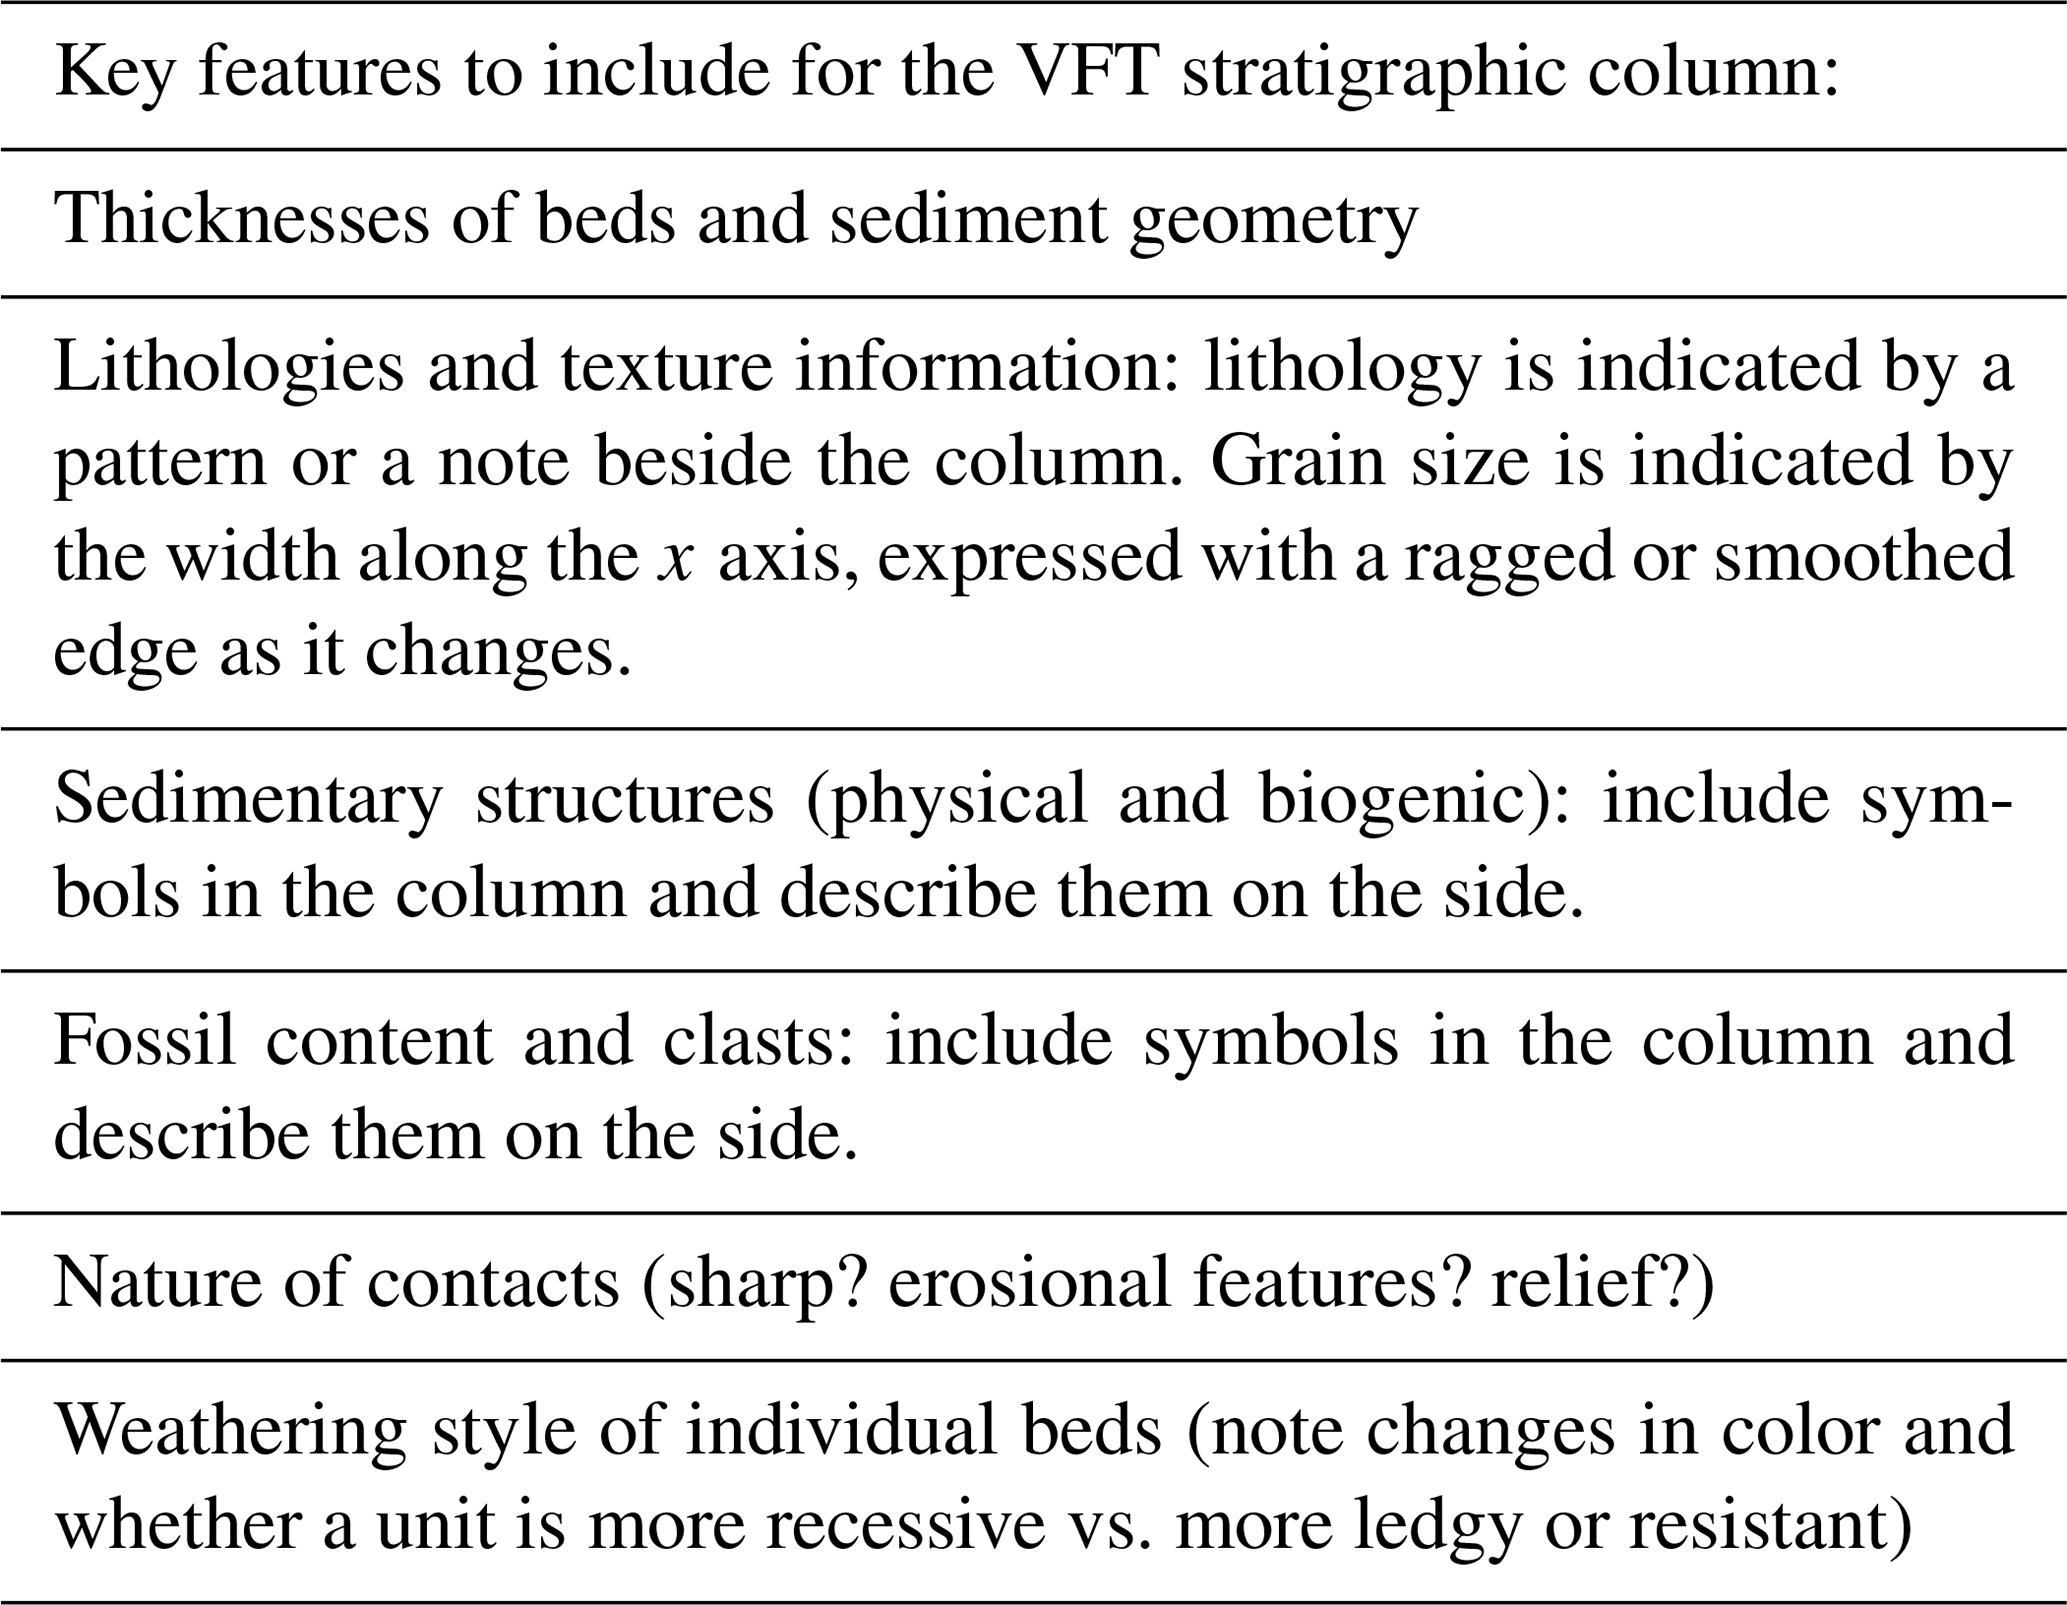
It was important to have all students use the same increments in their stratigraphic column for consistency. This allowed us to compare and correlate the columns in Part 6. They were instructed to include the data listed in Table 1 to construct their stratigraphic columns, drafting both a graphic log and including written notes on their data and interpretations. Students were instructed to make interpretations and concise notes on their column, including hypotheses about paleoenvironmental interpretations and notes on relative sea-level change. Students were encouraged to continually revise their interpretations. This step of the VFT yielded products of stratigraphic columns, which were explicitly to be their most refined product, an example of which is provided in Fig. 6. The construction of stratigraphic columns prepared students for a discussion and comparison of their data with their peers. In the final stage of this part, students worked with their partner(s) to assemble a short set of Google Slides that included a map showing their locality, an outcrop sketch, a stratigraphic column, and interpretations to be presented in the next step of the VFT.
Table 1Key features to include for drafting a stratigraphic column in the Grand Ledge VFT.
Discussion of stratigraphy
To compile a stratigraphic column with sufficient detail and precision, it was important for students to incorporate their observations from the previous sections of the VFT in an organized manner, using a standardized logging sheet and symbols. The Albion students completed all of their stratigraphic sections digitally, annotating the log file in pdf-viewing software or inserting the .png file into Word, PowerPoint, or a Google Slide to draw upon. One consideration is that it took students a long time to construct columns digitally due to the challenge of manipulating a laptop track pad. By typing descriptions and interpretations, students were able to include more details than when handwriting on the same logging sheet. Calvin students drafted theirs on paper by hand (Fig. 7 shows examples of their final products). The problems students encountered in drafting their stratigraphic columns were largely similar for both groups of students, though none were significant. We describe some of the challenges and successes below.
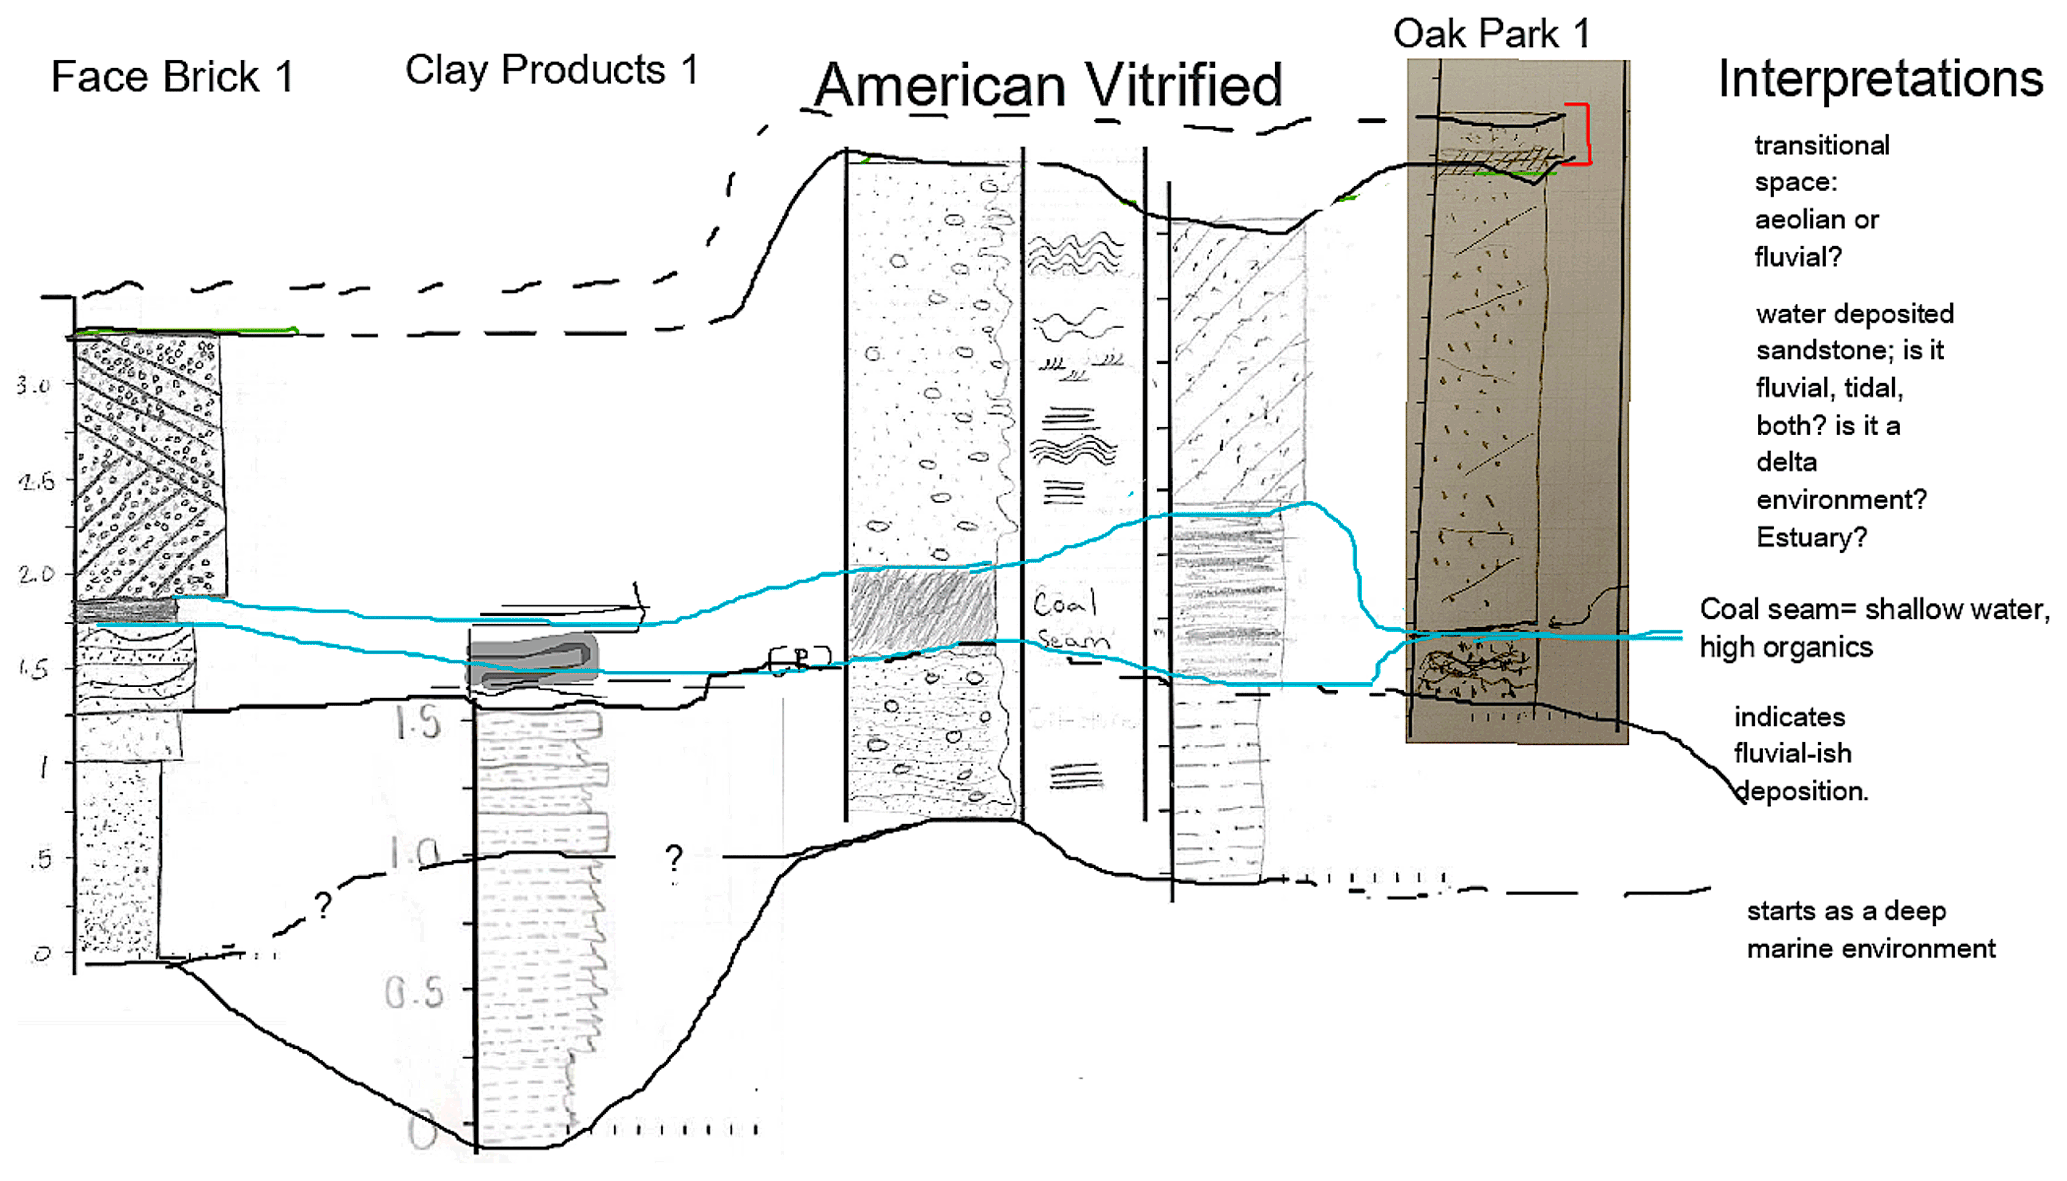
Figure 7Example student correlation constructed in Part 7 of the assignment by one class group using Google Jamboard, including hand-drawn representative stratigraphic sections drafted in Parts 5–6.
Stratigraphic columns are essentially graphs of data, and yet students often took artistic liberties, resulting in fanciful bedding scales and unrealistic distributions of features. Students found it challenging to draw realistic representations of sedimentary structures, such as drawing the larger-scale cross-beds that included multiple sets; smaller sedimentary structures such as laminations and fossils were represented more successfully. They also found it challenging to represent the scope of outcrop features accurately. For example, students noticed the iron concretions in one unit and incorporated them accurately into their outcrop sketches but then included the concretions throughout the entirety of the stratigraphic column, instead of only in the units in which they occurred.
The blank lithologic log provided to students for drafting their sections did not include a numbered scale. Part of the instructions guided students through how and where to number their scale, but this was not foolproof. A future modification could include a numerical scale already on the log, which will save time and prevent scaling errors between students that hinder correlations with other sections. Interpretations of the columns yielded inconsistent results: students varied in their responses, with some simply reiterating their descriptions, others giving a broad interpretation for the entire column, and some detailing a paleoenvironmental interpretation for each unit (the goal). Students were encouraged to create multiple drafts in order to yield a professional final product.
Most students displayed all geologic units accurately and consistently, incorporating both patterns and descriptions of lithologies. Many sections included a sufficient level of detail, particularly in the lithologic patterns and notes of other features, such as fossils, bedding, and concretions. While students did include joints and fractures in their realistic outcrop sketches, they successfully excluded those secondary features from their stratigraphic columns.
In the previous part of the VFT, each student drafted a stratigraphic column for their assigned outcrop (SLO no. 4; Fig. 6). In Part 6, students collaborated with class members to discuss and revise their interpretations of the depositional environment(s) for their stratigraphic columns (SLO no. 5). The groups met with one to two other groups (now a “pod”) working at adjacent outcrop localities to collaborate and share ideas. To start, each outcrop group presented an overview of their outcrop data and interpretations to the pod. To aid their discussion, the pod organized representative stratigraphic columns from each outcrop into one document (we used Google Jamboard, a collaborative online whiteboard), retaining scale across the sites. With the outcrops in place for comparison, the groups studied the sites for similarities and differences. Using Google Jamboard, they began making correlations between outcrops, tracing marker beds or distinctive contacts or facies changes. To support the graphical correlations, students also added text to their Jamboard, describing particular similarities, differences, and uncertainties across the sections (see Fig. S1 in the Supplement). Additionally, students compared and contrasted individual environmental interpretations and then worked as a pod to refine a written paleoenvironmental history for their general area.
Discussion of collaboration
Students were successful in this part of the VFT in seeing how adjacent stratigraphy could be similar or different and how stratigraphic sections could consistently be correlated with key features. For example, students recognized a coal seam regionally and noted that it was in most sections – this provided a point of familiarity and drove their correlation decisions. This was the part of the project where students had big “lightbulb” moments of understanding the connections. For the first time, students were learning how to relate one stratigraphic column to another.
Uneven amounts of participation and commitment from the small groups within a pod was a challenge. This could potentially be ameliorated by providing open access to all groups' stratigraphic columns and interpretations. Some groups had a very good collaborative dynamic, while others did not. This dynamic is often challenging to predict in advance, whether students choose their own partners or are assigned groups. Jigsaw activities and group projects are contingent on all students being present and participating. When any student is absent, this presents challenges for the entire group or pod. We attempted to address this challenge by having pods of three small groups, so that if one group did not engage, the remaining two groups could still collaborate. Collaboration was necessary for all students to be comfortable with the data for their outcrops and adjacent outcrops.
Ideally, students would return to their stratigraphic columns at this point to correct misconceptions or errors in sketching their observations that they discovered upon discussion and peer review with the larger pod. A significant challenge is getting students to ask questions of each other or of their own work. In the future, it would be beneficial for students to be provided with examples of useful questions to ask. As instructors monitor the pods, they could explicitly model the types of questions to ask and how to modify stratigraphic columns.
For time constraints, it is possible to proceed directly to the full-class Jamboard (Part 7) from individual sections (Part 5), skipping Part 6. However, the key realization that different outcrops even within close proximity to each other can show very different features, or help to fill in gaps and confusion before doing a larger-scale correlation (addressed in Part 6), is a useful step. Practice presenting and organizing thoughts in a pod setting prior to full-class presentations was also important.
Part 7 of the VFT asked students to bring the previous stages of the project together, collaborating as a full class to develop a correlation and an interpretation of the range of depositional environments for the entire field area and then writing final reflections (SLO no. 6). Each small group was tasked with selecting a representative stratigraphic column from their site and presenting the columns and their preliminary interpretations to the full class. The pods of small groups with adjacent outcrops were also given the opportunity to present and justify their preliminary correlations. These virtual presentations were done using either Google Slides or Google Jamboard. Next, each small group added their representative stratigraphic column to a full-class Jamboard. The class used the live-annotate functions of the Jamboard to virtually draft correlations between sections, debate lateral relationships, and draw upon their knowledge of similar sedimentary records from readings and class to generate a cohesive set of hypotheses about the depositional system (Fig. 7). To equip students to make more explicit environmental interpretations, two additional readings were assigned, which describe modern examples of tidal inlets and wash-over fans (Pierce, 1970) and discriminate between tidal versus fluvial influences on sedimentation (Johnson and Dashtgard, 2014).
Following this work of sharing data and interpretations, students read a short field guide to the Grand Ledge area (Milstein, 1987a), which presents a clear interpretation of the site for students to evaluate. To conclude the VFT, students wrote a final reflection summarizing what they learned and discussing how the final class hypotheses and interpretations compared with their original hypotheses and with published interpretations. In addition, students reflected on what went well and what to change about the experience.
Discussion of dissemination of knowledge
Part 7 of the project took a big-picture perspective, bringing all previous parts together scientifically while also asking students to present their ideas and reflect on their learning. Students were enthusiastic as they saw how everything fit together. They felt like “real geologists” in this part and enjoyed seeing how all the data connected and explained a real-world scenario. Students improved their skills at graphically representing ideas by applying their knowledge from the collaboration in Part 6 to the bigger picture.
It is important to remind students to draw upon the multiple scales of data they worked with throughout the VFT. This leads to more nuanced hypotheses and interpretations by incorporating all available data from different perspectives: for example, sometimes the best evidence to support a final correlation hypothesis was from the thin sections, which were studied in Part 3. When it came to interpreting paleoenvironments, it was important to remind students to zoom out and recognize the lateral variation of landscapes and consider the expected lateral and vertical successions of facies.
It was challenging to ensure that all students contributed to the correlation, since the most confident students often take the lead and complete this work first. Some students struggled to incorporate all their data and observations into a final interpretation, relying heavily on only one or two parts of the project for their final reflections, instead of uniting the sedimentology, stratigraphy, correlations, and related readings.
Since this VFT required teamwork, a useful component to both evaluating student work and giving students a voice in their outcomes was to collect peer and self-evaluation reflections. Students were asked to numerically assess their own and their partners' performance on a scale of 1–5 and also to provide qualitative assessment on how effectively their group worked together and any behaviors of team members that were particularly valuable or detrimental to the team. This information was used to assess student performance and classroom dynamics but has no bearing on our evaluation of the VFT as presented in this study.
In reading student reflections, we selected representative student responses about their learning outcomes that corresponded to each SLO and coded these responses by SLO and school to ensure an even distribution of comments from Albion and Calvin students. We focused on feedback related to why students did or did not like the VFT, what was challenging and how challenges were overcome, and achievement of the project SLOs. Student experiences and outcomes were markedly similar between the two schools, and comments from reflections were aggregated. We excluded student reflection responses that were not related to an SLO or that were focused on specifics they learned about their particular outcrop. Student reflections were intended to be open-ended, as opposed to a structured survey; thus, further qualitative data analysis is beyond the scope of this project. Table S1 summarizes a variety of student reflections related to the SLOs and their experiences with the VFT overall. Prominent themes from the students' final reflections include the following.
-
Students gained a sense for the challenges associated with all aspects of field work. For example, they identified note-taking as an aspect of field work they had not previously realized was important or difficult.
-
Students appreciated the opportunity to apply what they had learned in class to a real-world, imperfect situation with natural variation.
-
Students reported that they learned how to form hypotheses about sedimentary environments and revise their hypotheses based on additional information and collaboration.
-
Students noted how important collaboration was in solving problems and that teamwork was useful even when challenging.
This VFT about Grand Ledge, Michigan, provided an opportunity for a remote field experience for two sedimentation and stratigraphy classes at liberal arts colleges. The success of this VFT depended on all components being prepared in advance and carefully structured. This created continuity and a guided experience while still allowing students the freedom to explore within each part of the VFT. Through this VFT, students were able to access more data than during a traditional field trip (i.e., thin sections), leading to a complete experience in which they could develop hypotheses and also access the multiple types of data needed to test the hypotheses and refine their interpretations. This VFT facilitated a learning process that asked students to utilize and build upon multiple skill sets and content areas in a single continuous framework, which students perceived as important for developing their skills as geologists. The student products and feedback suggest that the VFT can yield the benefits of a traditional field experience. The products, such as student field notes, stratigraphic columns, and group interpretations support this, as well as the prominent themes from the student feedback. Therefore, the VFT is viable if used independently or could be used in conjunction with an in-person field trip. Importantly, this VFT provided students with a realistic experience related to a local field area and all of its natural variations and complexities, all within an accessible format and achievable within the designated class time.
Access to the collection of Grand Ledge virtual 3D models of outcrops and hand samples created by Madeline S. Marshall and used in this VFT is via Sketchfab (https://sketchfab.com/albionsedpaleo/collections/grand-ledge) (last access: 22 September 2021, Marshall, 2021) (in the collections of albionsedpaleo).
All other VFT data and materials are available at https://serc.carleton.edu/NAGTWorkshops/online_field/activities/242310.html (last access: 22 September 2021, Marshall and Higley, 2021).
The supplement related to this article is available online at: https://doi.org/10.5194/gc-4-461-2021-supplement.
MSM developed the VFT concept; MSM and MCH collected the VFT data and designed and co-wrote the paper.
The contact author has declared that neither they nor their co-author has any competing interests.
Publisher’s note: Copernicus Publications remains neutral with regard to jurisdictional claims in published maps and institutional affiliations.
This article is part of the special issue “Virtual geoscience education resources”. It is not associated with a conference.
We would like to thank our students at both Albion and Calvin, the 2020 NAGT Early Career Workshop, Ralph Stearley, John VanRegenmorter, and Ian Winkelstern for field-work discussions and assistance, and Crystal Bruxvoort and William Bartels for helpful suggestions and feedback on our manuscript. Additionally, our thanks to Anita Marshall and Kent Syverson, whose reviews helped improve this article.
This paper was edited by Marlene Villeneuve and reviewed by Anita Marshall and Kent Syverson.
Anderton, R.: Clastic facies models and facies analysis, in: Sedimentology: Recent Developments and Applied Aspects, edited by: Brenchley, P. J. and Williams, B. P. J., Geological Society, London, Special Publications, Blackwell Scientific Publications, 18, 31–47, 1985.
AgiSoft Metashape Professional (Version 1.6.3), Software, available at: https://www.agisoft.com/downloads/installer/ (last access: 22 September 2021), 2020.
Arthurs, L.: Bringing the Field to Students during COVID-19 and Beyond, GSAT, 31, 28–29, https://doi.org/10.1130/GSATG478GW.1, 2021.
Bond, C. E. and Cawood, A. J.: A role for virtual outcrop models in blended learning – improved 3D thinking and positive perceptions of learning, Geosci. Commun., 4, 233–244, https://doi.org/10.5194/gc-4-233-2021, 2021.
Bristow, C.: Observe, Record, Interpret: some examples of teaching sedimentology by distance learning including virtual graphic logs, Sedimentary Record, 18, 4–11, https://doi.org/10.2110/sedred.2020.2.4, 2020.
Carabajal, I. G., Marshall, A. M., and Atchison, C. L.: A Synthesis of Instructional Strategies in Geoscience Education Literature That Address Barriers to Inclusion for Students With Disabilities, Journal of Geoscience Education, 65, 531–541, https://doi.org/10.5408/16-211.1, 2017.
Catacosinos, P. A., Harrison III, W. B., Reynolds, R. F., Westjohn, D. B., and Wollensak, M. S.: Stratigraphic nomenclature for Michigan, Michigan Department of Environmental Quality, Geological Survey Division, Lansing, Michigan, USA, 2000.
Coe, A. L. (Ed.): Geological Field Techniques, Wiley-Blackwell, The Open University, Milton Keynes, UK, 336 pp., 2010.
Folk, R. L.: Petrology of sedimentary rocks, Hemphill Publishing Company, Austin, Texas, USA, 182 pp., 1980.
Geology Drawing Skills Handbook: Geological Drawing, Version 1, Oxford Cambridge and RSA, University of Cambridge, Cambridge, UK, 2018.
Hall, T., Healey, M., and Harrison, M.: Fieldwork and disabled students: discourses of exclusion and inclusion, J. Geogr. Higher Educ., 28, 255–280, https://doi.org/10.1080/0309826042000242495, 2004.
Haq, B. U. and Schutter, S. R.: A Chronology of Paleozoic Sea-Level Changes, Science, 322, 64–68, https://doi.org/10.1126/science.1161648, 2008.
Huntoon, J.: Demonstrating the unique benefits of field experiences, Science, 175–176, 2012.
Johnson, S. M. and Dashtgard, S. E.: Inclined heterolithic stratification in a mixed tidal–fluvial channel: Differentiating tidal versus fluvial controls on sedimentation, Sediment. Geol., 301, 41–53, https://doi.org/10.1016/j.sedgeo.2013.12.004, 2014.
Kelly, W. A.: Pennsylvanian Stratigraphy near Grand Ledge, Michigan, J. Geol., 41, 77–88, https://doi.org/10.1086/624006, 1933.
Marshall, M. S.: Grand Ledge 3D Models, Sketchfab [data set], available at: https://sketchfab.com/albionsedpaleo/collections/grand-ledge, last access: 22 September 2021.
Marshall, M. S. and Higley, M. C.: Virtual Field Trip to Grand Ledge, Michigan: Interpreting Sedimentary Environments, Teach the Earth, available at: https://serc.carleton.edu/NAGTWorkshops/online_field/activities/242310.html, last access: 22 September 2021.
Martin, J. R.: Pennsylvanian Deltaic Sedimentation in Grand Ledge, Michigan, MS thesis, Western Michigan University, Kalamazoo, Michigan, USA, 131 pp., 1982.
Milstein, R. L.: The Ledges of the Grand River, Michigan, in: North-Central Section of the Geological Society of America, edited by: Biggs, D. L., Geological Society of America, Boulder, Colorado, USA, 311–314, https://doi.org/10.1130/0-8137-5403-8.311, 1987a.
Milstein, R. L.: Bedrock Geology of Southern Michigan, Michigan Department of Natural Resources, Lansing, Michigan, USA, 1987b.
Mogk, D. W. and Goodwin, C.: Learning in the field: Synthesis of research on thinking and learning in the geosciences, in: Earth and Mind II: A Synthesis of Research on Thinking and Learning in the Geosciences, edited by: Kastens, K. A. and Manduca, C. A., Geological Society of America, Boulder, Colorado, USA, Special Paper, 486, https://doi.org/10.1130/2012.2486(24), 2012.
Noad, J.: The (Forgotten?) Art of Geological Field Sketches, AAPG Annual Convention and Exhibition, Calgary, Alberta, Canada, 19–22 June 2016.
Petcovic, H. L., Stokes, A., and Caulkins, J. L.: Geoscientists' perceptions of the value of undergraduate field education, GSAT, 24, 4–10, https://doi.org/10.1130/GSATG196A.1, 2014.
Pierce, J. W.: Tidal Inlets and Washover Fans, J. Geol., 78, 230–234, https://doi.org/10.1086/627504, 1970.
Rotzien, J., Sincavage, R., Pellowski, C., Gavillot, Y., Filkorn, H., Cooper, S., Shannon, J., Yildiz, U., Sawyer, F., and Uzunlar, N.: Field-Based Geoscience Education during the COVID-19 Pandemic: Planning, Execution, Outcomes, and Forecasts, GSAT, 31, 4–10, https://doi.org/10.1130/GSATG483A.1, 2021.
Towne, S., Barnes, D., Westjohn, D. B., and Harrison III, W. B.: A core workshop: Late Mississippian (Chesterian) through early Pennsylvanian (Atokan) strata, Michigan Basin, USA, in: Insights into the Michigan Basin: Salt Deposits, Impact Structure, Youngest Basin Bedrock, Glacial Geomorphology, Dune Complexes, and Coastal Bluff Stability, edited by: Gillespie, R., Geological Society of America, Boulder, Colorado, USA, Field Guide, 31, 119–148, 2013.
Venable, N. B. H., Barnes, D. A., Westjohn, D. B., and Voice, P. J.: Pennsylvanian fluvial-deltaic depositional systems in central lower Michigan: sedimentology, stratigraphy, and hydrogeology of the Saginaw Aquifer, in: Insights into the Michigan Basin: Salt Deposits, Impact Structure, Youngest Basin Bedrock, Glacial Geomorphology, Dune Complexes, and Coastal Bluff Stability, edited by: Gillespie, R., Geological Society of America, Boulder, Colorado, USA, Field Guide, 31, 119–148, 2013.
Zhao, J., LaFemina, P., Carr, J., Sajjadi, P., Wallgrun, J. O., and Klippel, A.: Learning in the Field: Comparison of Desktop, Immersive Virtual Reality, and Actual Field Trips for Place-Based STEM Education, in: 2020 IEEE Conference on Virtual Reality and 3D User Interfaces (VR), Atlanta, GA, USA, 893–902, https://doi.org/10.1109/VR46266.2020.00012, 22–26 March 2020.
- Abstract
- Introduction and motivations
- Background geology and framework: Part 1 of the assignment
- Outcrop reconnaissance: Part 2 of the assignment
- Lithologies: Part 3 of the assignment
- Bedding style and sedimentary structures: Part 4 of the assignment
- Stratigraphy: Part 5 of the assignment
- Collaborate: Part 6 of the assignment
- Disseminate knowledge: Part 7 of the assignment
- Summary of student feedback
- Conclusions
- Data availability
- Author contributions
- Competing interests
- Disclaimer
- Special issue statement
- Acknowledgements
- Review statement
- References
- Supplement
like a real geologist.
- Abstract
- Introduction and motivations
- Background geology and framework: Part 1 of the assignment
- Outcrop reconnaissance: Part 2 of the assignment
- Lithologies: Part 3 of the assignment
- Bedding style and sedimentary structures: Part 4 of the assignment
- Stratigraphy: Part 5 of the assignment
- Collaborate: Part 6 of the assignment
- Disseminate knowledge: Part 7 of the assignment
- Summary of student feedback
- Conclusions
- Data availability
- Author contributions
- Competing interests
- Disclaimer
- Special issue statement
- Acknowledgements
- Review statement
- References
- Supplement