the Creative Commons Attribution 4.0 License.
the Creative Commons Attribution 4.0 License.
 | 21 Jan 2019
Assessing the impact of outreach strategies in cities coping with climate risks
Ioulia Tchiguirinskaia
Daniel Schertzer
The resilience of our cities to weather extremes relies both on physical environmental factors and on socio-economic factors. The latter includes communication processes among the members of an urban community. This paper presents a study that aims at appraising how public outreach campaigns influence urban resilience. According to this research, seizing the added value of science outreach efforts calls for an assessment method that takes into consideration the interactions between communication processes and other urban resilience drivers. The paper begins by presenting examples of methods to assess urban resilience to weather extremes. We then propose an approach to comprehend the impact of communication activities on resilience in the context of urban flood resilience strategies. We use five guiding criteria to define “resilience communication indicators” and we present two communication assessment experiments based on these criteria. These experiments were undertaken to assess communication activities addressed to non-specialist audiences and tailored for a flood resilience project in the Paris region. Different research methods were tested through these experiments, with the goal of comprehending their strengths and weaknesses in the framework of urban resilience strategies.
- Article
(888 KB) - Full-text XML
-
Supplement
(566 KB) - BibTeX
- EndNote


Cities are complex systems, with multiple functions and interacting components, where climate pressures contribute to their complexity (Ruth and Coelho, 2007). In this paper, we refer to the social–ecological resilience as a theoretical frame, since it allows the complex interactions among social, economic, physical and environmental components of urban systems to be comprehended. The early engineering interpretation of resilience was concerned with the capacity of a stable system to absorb stress and to continue to maintain its function. The “social–ecological resilience” approach departed from the mainstream interpretation of resilience by pointing at renewal, re-organisation, innovation, development and adaptation as important capacities of a resilient system (Gunderson and Holling, 2002; Carpenter, 2003; Walker and Meyers, 2004; Bellwood et al., 2004; Berkes et al., 2003; Adger, 2006; Folke, 2006; Folke et al., 2010). This approach presupposes the use of resilience metrics as an empirical basis to translate the concept of social–ecological resilience into practice (e.g. Carpenter et al., 2001). Once different urban components and functions are identified as “resilience drivers”, specific variables are chosen to measure the impact of each of them on urban resilience.
In this study, we propose to explore how urban resilience assessment can take into account the interactions between science outreach and other resilience drivers. With this general scope, we examine the following:
- i.
the variables that are available in the context of a flood resilience project (RainGain) and that can be adopted as indicators of the impact of communication on urban resilience to climate risks;
- ii.
the strengths and weaknesses of different methods that can be employed to monitor these indicators.
After outlining the concept of social–ecological resilience and discussing the worth of resilience metrics in Sect. 2, we give an overview of different assessment frameworks that consider communication impact in Sect. 3. We propose to define indicators that can measure the impact of communication on urban resilience and are tailored to the operational context of climate-resilient strategies involving science outreach efforts. Some examples of flood resilience strategies implemented in the Paris region are recalled in Sect. 4 and used as a basis to outline guiding criteria for selection of relevant communication indicators that we define as “resilience communication indicators” (RCIs). These indicators are based on quantitative variables since numerical data allow the correlations between communication and other resilience drivers to be explored. In Sect. 5 we present three experiments undertaken in the framework of the European project Interreg NWE IVB1 RainGain to test different assessment methods: the media monitoring, a questionnaire and interviews.
According to the social–ecological resilience perspective, “resilience” can be defined as the “the capacity of a system to absorb disturbance and reorganise while undergoing change so as to still retain essentially the same function, structure, identity, and feedbacks” (Walker et al., 2004, p. 2). “Transformability” and “adaptability” (Folke et al., 2010) are considered essential characteristics of a resilient system. This approach puts the accent on uncertainty, non-linear dynamics, and the interplay between gradual change and rapid change (Walker and Meyers, 2004). The trajectory followed by a system after a perturbation cannot be described as reaching “stable states” or “equilibria”, but rather with the concepts of “regimes” or “attractors” (Carpenter, 2003).
These dynamics involve interactions across different time and space scales (Schertzer and Lovejoy, 2004; Tchiguirinskaia et al., 2014), as well as throughout different socio-economic and physical environmental dimensions of a system (Kirch, 2005; Millennium Ecosystem Assessment (MA), 2005). This multi-dimensional perspective is particularly suited to studying the complexity of urban systems and the influence of communication processes on resilience. Cities have multiple components and functions, including the communication factors that can be defined as part of the social dimension and that obviously have interdependencies with the economic, physical and environmental dimensions.
By the 2000s, increasing attention among academics, as well as practitioners, has been devoted to the implementation of resilience. Putting the concept of social–ecological resilience into practice involves relevant changes in policy and decision-making. Indeed, the social–ecological resilience approach emphasises the need to apply the principle of subsidiarity2, i.e. to decentralise risk management, encourage citizen participation and share responsibilities with them (Tanguy, 2015). In Sect. 4, we discuss some cases of recent resilience strategies implemented in the Paris region that entail public engagement activities. These examples illustrate how public outreach and citizens' perceptions are gaining importance, as a consequence of the implementation of the subsidiarity principle.
Going beyond theory and implementing resilience requires resilience metrics: relevant indexes allow decision-makers to compare the costs of resilience enhancement actions with the economic, environmental, social and sanitary costs of non-action. Resilience metrics also help to set up clear objectives at the beginning of a project, to evaluate and improve management capacities, and to increase transparency and stakeholders' involvement during and after a project. According to Carpenter et al. (2001), resilience metrics allow testing hypotheses on the dynamics of systems and enable cross-system comparisons.
A first necessary step to design resilience metrics is to identify the disturbance and the system we are interested in. Even though the interplay with other scales and other shocks or stresses should not be ignored, answering the question “resilience of what, to what?” (Carpenter et al., 2001) is an essential basis to establish resilience indicators. The same relevant variables can be then compared in different systems (e.g. different cities) or in the same system at different moments. In this paper, the focus is on cities facing climate risks: in the next sections we present examples of resilience assessment frameworks that are adequate to urban areas coping with extreme weather (Sect. 3); we then discuss the role of communication in flood resilience strategies implemented in the Paris region and we outline guidelines to define what we call RCIs for cities facing climate risks (Sect. 4); we finally compare different communication assessment techniques that have been tested in the framework of RainGain, a European research project on urban flood resilience (Sect. 5).
The resilience assessment approaches presented in the next section are quite heterogeneous in terms of the concept of resilience they refer to, the system and disturbances they consider, the selection of indicators and variables, and the degree of the on-site implementation. All these techniques propose a number of indicators to monitor social factors that are related to communication.
According to Charrière et al. (2017), impact assessment of risk communication is quite a new practice. The emergent recognition of the importance of communication can also be observed in the literature on resilience indicators. This section presents three examples of resilience assessment frameworks that consider communication processes and infrastructure, a feature that has recently gained importance among the available indicators for cities coping with weather extremes (for a review, see Vicari, 2018).
3.1 Resilience Alliance
The “Resilience Alliance” (RA) (Resilience Alliance: https://www.resalliance.org/, last access: 14 October, 2018; Resilience Alliance, 2010; Haider et al., 2012) is an international, multidisciplinary research organisation that has developed guidelines to assess resilience of social–ecological systems and to implement sustainable development strategies. RA outlines an assessment framework that is consistent with the social–ecological approach. According to this method, multiple spatial and temporal interacting scales must be considered to comprehend, for instance, how resilience at the level of a neighbourhood can affect the resilience of a city. Furthermore, for each quantitative variable, a threshold should be defined. If the threshold is crossed, the effects on other social and ecological variables must be identified. Communication is evaluated in terms of “information sharing”, a factor that characterises social relations among stakeholders. According to the RA method, social relations and information flows need to be monitored since they affect the governance system. This specific factor is analysed by comparing different social network structures: e.g. a highly centralised network or a network composed of two isolated subgroups. The RA approach focuses on institutional relations and does not offer any tool to investigate the intensity or quality of information exchange.
3.2 The Disaster Resilience Of Place model and the Baseline Indicators for Communities
The “DROP” (Disaster Resilience Of Place) model and the related “BRIC” (Baseline Resilience Indicators for Communities) (Cutter et al., 2008, 2010, 2014) focus on resilience to natural hazards at community level and on the relationship between resilience and vulnerability. The model is a conceptual basis to identify resilience indicators that can be used at different spatial scales. It outlines a composite resilience index, with sub-indexes corresponding to different dimensions of the urban system. These indexes are exclusively quantitative variables, and a method is proposed to normalise different ranges of values to a unique scale. Social factors that are related to communication and are examined by Cutter et al. (2014) concern public engagement, education, training and communication infrastructure. Examples of indicators are “English language competency (% Population proficient English speakers)”, “Local disaster training (% Population in communities with Citizen Corps programme)”, “Communication capacity (% Households with telephone service available)', “Social capital-disaster volunteerism (Red Cross training workshop participants per 10 000 people)”. Other important communication infrastructure – such as mobile phones, the Internet, TV and radio – as well as public outreach are not considered.
3.3 Disaster Resilience Scorecard for Cities
In 2010, the United Nations secretariat of the International Strategy for Disaster Reduction launched the campaign “Making Cities Resilient” (Making Cities Resilient: https://www.unisdr.org/campaign/resilientcities/, last access: 28 September 2018). Following the adoption of the “Sendai Framework for Disaster Reduction” (UN/ISDR, 2015)3, the goals and priorities of the campaign were updated, as well as the resilience assessment tool dedicated to cities: the “Disaster Resilience Scorecard for Cities” (DRSC) (UN/ISDR, 2017). This methodology is aimed at monitoring the implementation of the Sendai Framework at local government level through “Ten Essentials for Making Cities Resilient”. Two kinds of evaluations are foreseen to monitor the progress towards these essentials: a preliminary evaluation that includes 47 qualitative and quantitative indicators with a graduated 3-point scale, and a detailed evaluation involving the participation of stakeholders, which includes 117 indicators with a 0–5 score.
Among the three selected assessment frameworks, the DRSC is the method that proposes the widest number and variety of indicators that can be related to communication processes. Examples of indicators are “Use of mobile and e-mail `systems of engagement' to enable citizens to receive and give updates before and after a disaster”, “Extent to which data on the city's resilience position is shared with the community organisations and public”, “Consultation in plan making”, “Accessibility of education and training to all linguistic groups in the city”, and “Communication service days at risk of loss”. These indicators are monitored in terms of presence/absence of efforts, frequency of activities, audience diversity and size (e.g. how many of the listed groups of stakeholders are involved in plan consultation?), and exposure (e.g. how many media channels are used for public relations and education campaigns?).
3.4 General remarks on communication evaluation and next steps
The proposed approach draws on the three assessment methods we have presented in this section. Indeed, as proposed by the RA method (Sect. 3.1), we aim to detect possible correlations between social processes (e.g. communication) and environmental processes. In accordance with the first two approaches (Sect. 3.1 and 3.2), we also consider that quantitative variables are adequate to establish RCIs. In fact, quantitative variables facilitate the observation of space–time variability, as well as the investigation of correlations between communication processes and other resilience drivers. We also consider the frequency of communication activities, the exposure, the audience size and composition as relevant variables, similarly to what is outlined in the DRSC approach (Sect. 3.3).
At the same time, the aim of our study goes beyond a description of the state of communication processes and infrastructure in an urban area exposed to risks. We propose a dynamic perspective, with the RCIs outlined in the next section and tested in Sect. 5. The RCIs are tailored to appraise how specific communication activities contribute to achieving local resilience goals. These indicators require a rich and detailed selection of communication variables that are activity driven; i.e. they allow the detection of resilience changes that occur even in a brief time, and the causes related to a past or ongoing communication activity.
The audience knowledge and its behavioural change, due to communication activities, have been investigated by researchers in the fields of risk communication and of public understanding of science. The first series of works explore the impact of risk communication on the audience perceptions and behaviour. Rohrmann (1992) and Lundgren and McMakin (2004) discuss the importance of evaluating the success of risk communication strategies. Other authors (e.g. Terpstra et al., 2009; Maidl and Buchecker, 2015) evaluate the impact of specific risk communication activities such as interactive workshops, focus groups and one-way communication.
The second set of studies describe different approaches and techniques to evaluate science outreach. Godin and Gingras (2000), Bauer (2008), and Neresini and Pellegrini (2008) discuss the methodological principles of science outreach assessments. Examples of evaluation experiments are described by Scheufele et al. (2005), who designed a national telephone survey on nanotechnology, and by Wagoner and Jensen (2015), who assessed adolescents' learning at the zoo by combining questionnaire data with responses with detailed verbally administered questions.
Our research specifically investigates resilience communication and tests what we define as resilience communication indicators: quantitative indicators to comprehend how a communication activity influences urban resilience to climate risks. Nevertheless, the above-mentioned literature provides helpful hints for this study. As highlighted by Neresini and Pellegrini (2008), the evaluation of a communication activity presupposes that the communication goal is taken into account. For instance, assessing a communication campaign aimed at disseminating knowledge on flood resilience is different from assessing a campaign that promotes public engagement in flood resilience strategies. In the specific case of the communication activities examined in Sect. 5, the goal was to raise awareness of flood resilience issues and solutions in the Paris region, as well as to gain the support of the local population for the project implementation. Since this research focuses on communication indicators, we assume that communication activities – planned and implemented in the framework of a resilience strategy or project – enhance resilience if they contribute to achieving the strategy or project goals.
As stated by Neresini and Pellegrini (2008), we consider that the methodological principles developed in the sphere of social research can be applied to communication evaluation. In this paper we refer to the research process and techniques adopted in the field of “social impact assessment” (SIA) (Inter-organisational Committee on Guidelines and Principles for Social Assessment, 1994; Social Analysis at the World Bank: http://www.worldbank.org/socialanalysis, last access: 25 September 2018), an approach aimed to monitor and better take into account the effects of social variables in territorial development. In particular, the experiments presented in this paper (Sect. 5) are based on three investigation techniques that are used in SIA: research based on secondary sources, a questionnaire and interviews. The first two techniques aim to monitor a selection of RCIs, and the last one is employed for exploratory research.
As we mention above, it is necessary to keep in mind the objective of a communication activity when evaluating it. In the next section, we recall that a communication objective also depends on the territorial context where an activity is implemented. The study that is summarised in the next section, and the experiments that are presented in Sect. 5 were all carried out in the context of Paris region and its flood resilience challenges.
In the last 5 years in the Paris region, public authorities have made increasing efforts to facilitate access to information on climate risk management, encourage citizens' participation and share responsibilities with them. Unlike the strategies released by public authorities before 2014, recent strategic documents (EPBT SGL, 2014; MEDDE, 2014; OECD, 2014; DRIEE, 2015; DRIEE/DBSN, 2015; Mairie de Paris and Prefecture de Police, 2015; Mairie de Paris, Direction des Espaces Verts et de l'Environnement, Agence d'Écologie Urbaine, 2015; Mairie de Paris and 100 Resilient Cities, 2017) define in a detailed manner the communication objectives and the profile of the target audiences and propose innovative outreach and public engagement activities. Furthermore, they refer to risk culture development as a priority: instead of focusing on emergency warning, as in the past, recent documents treat outreach and public engagement as opportunities to raise awareness and educate urban communities with long-term effects.
This trend results from a political will to apply the principle of subsidiarity and decentralise risk management (Tanguy, 2015) that have led public authorities to pay attention to the citizens' perceptions. The communication between public authorities and citizens, especially a two-way dialogue, is becoming a keystone of resilience strategies since it facilitates mutual understanding, identification of shared goals and cooperation.
With communication that has become a key part of recent resilience plans, since 2014 the French government has called attention to the need for communication impact assessment in flood risk management strategies (MEDDE, 2014; DRIEE, 2015). A hypothesis of relevant communication variables and indicators has been outlined by Vicari et al. (2016). In this previous scoping study, the variables draw on an analysis of 12 strategies, developed by local national and international institutions, from 2003 to 2017, to cope with flood risk in Paris. On the basis of these variables, we have outlined RCIs. The study consisted of the following steps:
-
identifying communication activities proposed in the public authorities' strategic documents, and specifying the communication context, objectives and target audiences;
-
detecting communication variables that are adequate to the context, objectives, audiences and activities of each communication strategy (outlined through the previous step);
-
identifying the recurrent communication variables that can be exploited as relevant indicators to assess the impact of communication on resilience.
The result of this analysis is five recurring categories of variables that are listed below. According to the study, the following categories can serve as guiding criteria to include relevant RCIs in a wider urban resilience assessment:
- i.
Intensity. This is measured by the number of tweets, retweets, followers, comments, attendees, unique website visitors, visit duration, number of press news items, readerships, etc. Each rate can be broken down by different sub-groups of audiences.
- ii.
Quality (Did it reach the adequate target audience? Was the message correctly received? Does the response match with what was expected?). This is measured by the number of distributed messages that are consistent with the key campaign messages, percentage of the target audience that had a good understanding of the messages, percentage of the audience who gained knowledge through the campaign, percentage of the target audience that took action to contribute to the campaign goal achievement. Each rate can be broken down by different sub-groups of audiences.
- iii.
Participatory communication. This is the percentage of the target audience who contributed to disseminating information and percentage of citizen information that contributed to changing risk management. Data on public engagement can be easily collected in the case of projects involving the use of social media (Grandi and Neri, 2014; Topping and Illingworth, 2016) or mobile apps for “citizen science” (Keating et al., 2017; Koole et al., 2015).
- iv.
Comparison. This allows the observation of how communication impacts change over time, in different locations and from one segment of the population to the other.
- v.
The interplay with other resilience drivers. Examples of correlations between communication and other urban system components are (a) policy-makers that have been influenced by the media coverage of a flood (e.g. a debate on insurance issues or alarm dysfunction), (b) an information campaign that has contributed to decreasing damages and injuries, and (c) a new transport connection that has increased the attendance rate and variety of participants to a conference. This criterion allows the connection between RCIs and other resilience indicators to be established and communication assessment to be integrated into a wider resilience assessment framework.
The next section presents three different kinds of experiments that were carried out in the framework of the RainGain project. Each experiment takes into account some of the five guiding criteria listed above. More specifically, the first experiment “Media coverage monitoring” explores the intensity of communication (criterion i); it compares different time periods (criterion iv) and highlights the correlations between communication and another resilience driver, i.e. a meteorological event (criterion v). The second experiment “Questionnaire administered to the visitors of an exhibition” explores the quality of communication (criterion ii) and compares different sub-groups of audiences (criterion iv). The third experiment “Interviews” is aimed at providing data for preliminary research and support monitoring of RCIs.
The HM&Co (Hydrology Meteorology and Complexity) laboratory of École des Ponts ParisTech has coordinated several research projects aimed at enhancing urban resilience to extreme weather. HM&Co research projects also involve developing and strengthening a network of stakeholders through dissemination and public engagement activities. HM&Co has striven in this direction by first being involved in the participatory workshops addressed to the stakeholders of the ERANET Crue SUCAs and FP7 SMARTeST projects. After these first experiences, HM&Co has coordinated a 4-year-long communication strategy in the framework of the RainGain project. The main communication objective was “to disseminate and make available the tools and methodologies developed in the project, so that its target groups are informed, educated, involved and mobilised so that vulnerability to urban pluvial flooding is reduced and resilience is enhanced” (Interreg NWE IVB RainGain, 2011).
The frequency of communication activities and their impact, in terms of audience size, have been monitored since the beginning of the communication plan. This has enabled the RainGain project team to adjust the communication activities during the project implementation when problems were revealed. Indeed, precise target values have been established as part of the communication strategy, in agreement with the European Commission evaluators in charge of the Interreg NWE IVB funding programme. During the execution of the plan, the project partners and the funding programme staff periodically compared the target values to the attained values, in order to appraise whether sufficient efforts and resources were devoted to specific activities. The design of the experiments, the data collection and the analysis of the results were carried out through a participatory process, involving the international project team (the communication officer, the scientists and the practitioners), and external staff (from the EC Interreg Programme, École des Ponts and Terre et Avenir association) who provided third-party advice.
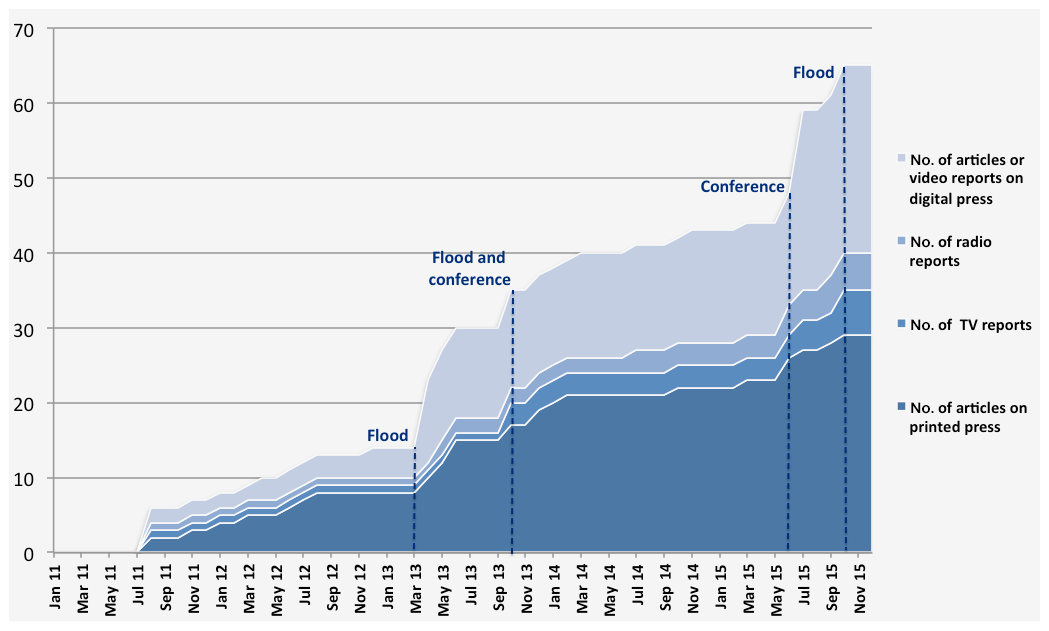
Figure 1Cumulative number of news items (printed press, digital press, TV and radio) concerning the RainGain project and published from July 2011 to November 2015. The number of news items rose rapidly during specific events: (1) dissemination of a press release on the project (March 2013); (2) a flood event in the Netherlands, followed by a project conference in France (October 2013); organisation of an international scientific conference related to the project (May–June 2015); (3) a flood event in south-eastern France (October 2015).
5.1 Media coverage monitoring
Among the communication values that were monitored during the RainGain project, the media coverage has reached remarkable results that have far surpassed the target values. The data presented in this section were collected from different sources:
-
feedback from the Communication Department of École des Ponts that constantly monitors, through Argus de la Presse (Argus de la Presse: http://www.argus-presse.fr/, last access: 20 November 2018), whether the media mention “École des Ponts”;
-
a periodic search on Google News of press news items that include the key word “RainGain”;
-
feedback from the researchers that were interviewed by the press on the RainGain project;
-
data on the audience size of printed press were collected on each newspaper website.
From July 2011 to December 2015, we have counted a total number of 65 news items on the RainGain project, published by the French, Dutch and Belgian press. These news items include 29 articles on printed press, 6 TV reports, 5 radio reports, 25 Web articles and online video reports.
Figure 1 shows that during specific months the number of news items has rapidly increased. Two kinds of events have occurred when the increase rate was high:
-
The RainGain communication activities (a press release in March 2013 and two conferences in October 2013 and May 2015). These are social and endogenous causes of news rate increase, since they are the outcome of the work of the project team;
-
Flood events in The Netherlands (October 2013) and in France (October 2015) that are environmental and exogenous causes. The impact of a flood event on media coverage is an example of correlation between an environmental factor and a social factor.
Data on the number of press articles were compared to the data on the newspaper audience size. We refer to audience size as the readership that has been estimated by the newspaper editor or by companies specialised in media measurement. These estimates are not precise as measurements of immediate audience (i.e. a public who is face-to-face with the speaker), but provide an approximate metric of the potential dissemination of a news item. Figure 2 displays a comparison between the temporal evolution of the cumulative number of articles and the cumulative audience size of printed press. The difference between the two cumulative curves is variable. Indeed, different newspapers have different impacts in terms of audience size. Hence, the impact of an article is variable according to the newspaper that publishes it. This is particularly true when we compare the impact of a local newspaper to the impact of a national newspaper. The audience size is also variable in the case of TV, radio and digital press.
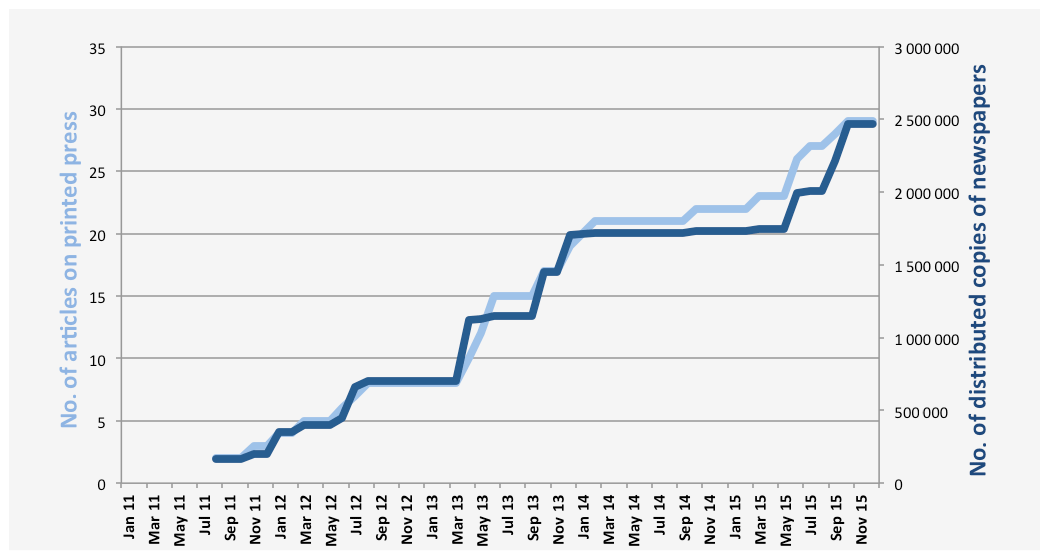
Figure 2A comparison between the temporal evolution of the cumulative number of articles and the cumulative audience size of printed press. The differences between the two cumulative curves are due to the fact that different newspapers have different impacts in terms of audience size; hence, the impact of an article is variable according to the newspaper that publishes it. In order to highlight this variability we have overlapped the first and the last values of the two curves.
The frequency of press news items and the audience size are two RCIs that allow identification of the population that has received a specific message. This is a necessary step to evaluate the communication effects on citizens' perceptions and urban community resilience. The RCIs employed in this experiment also allow observation of how the resonance of a message evolves over time (Figs. 1 and 2) and identification of possible correlations with other resilience drivers (e.g. a meteorological event, as is shown in Fig. 1). With respect to the resilience goals of the project, the experiment has shown that press relations allowed increased media attention on urban flood-prone areas and on emerging scientific and technological solutions. We finally should observe that an aggregated analysis of press news items does not give any insight into the quality of the communication contents.
5.2 Questionnaire administered to the visitors of an exhibition
The experiment presented in this section illustrates how RCIs based on a questionnaire can capture the quality of communication and how the audience has interpreted and perceived a message. Indeed, even if a communication activity reaches a wide public, the communication impact on urban resilience will vary according to the way the message is perceived. Questionnaire questions, such as those presented in this experiment, provide variables (e.g. frequency of correct questions, frequency of high risk perception) that can be used as RCIs to assess the respondent's interpretation and perception.
An exhibition dedicated to the RainGain project was held at École des Ponts in April–May 2014. It included five panels (84 cm × 120 cm) with texts and images on the project and the weather radar that was going to be installed beside the school, at the end of 2014. The subject of the exhibition was very technical: only professionals in the field of weather forecasts and flood risk management are knowledgeable about it and have access to other sources of information on the topic. The questionnaire was distributed to the workers and students of the school 1 month after the end of the exhibition. The questionnaire aimed at exploring how the exhibition contents were interpreted, memorised after several weeks, and whether it changed the visitors' perception of RainGain (Persoz, 2014). A total of 37 respondents were recruited on a voluntary basis among the 513 workers and 827 students of École des Ponts (all domiciled in the Paris region). They were invited through internal mailing to complete an online questionnaire (see Supplement S1, for a detailed list of the questions). The sample was expected to be small, since no monetary incentive was provided for questionnaire participation and there was no examiner who could individually reach each potential respondent to solicit his answers. We were also aware that questionnaires give limited insights into the cognitive processes that shape individual and social perceptions. However, rather than obtaining results that can be generalised to a wider population, our main objective was to test if quantitative research can be employed to evaluate the quality of communication. Indeed, this method and the research technique presented in the previous experiment have a common characteristic: they provide numerical data that are adequate to integrate communication assessment in a wider urban resilience assessment.
The questionnaire included questions on the professional background of the respondents. These questions allowed six experts from the sample to be excluded, in order to obtain a relative homogeneity in terms of background knowledge. As a result, the final sample consisted of 31 respondents (see Supplement S1 for demographic data). Other questions were aimed at identifying the source of information through which the respondents learnt about the project. On the basis of these questions the sample was divided into four subsets: (1) 13 visitors to the exhibition; (2) five visitors who also read the brochure distributed at the exhibition; (3) six respondents who received only informal information (by word of mouth4); (4) 12 participants who never heard about the project. In order to perform a comparative experiment, subset no. 1 was considered the experimental group (with 13 respondents); subsets nos. 3 and 4 were considered the control group (with a total number of 18 respondents). We have used the Fisher's exact test to compare the answers by the experimental group with those of the control group.
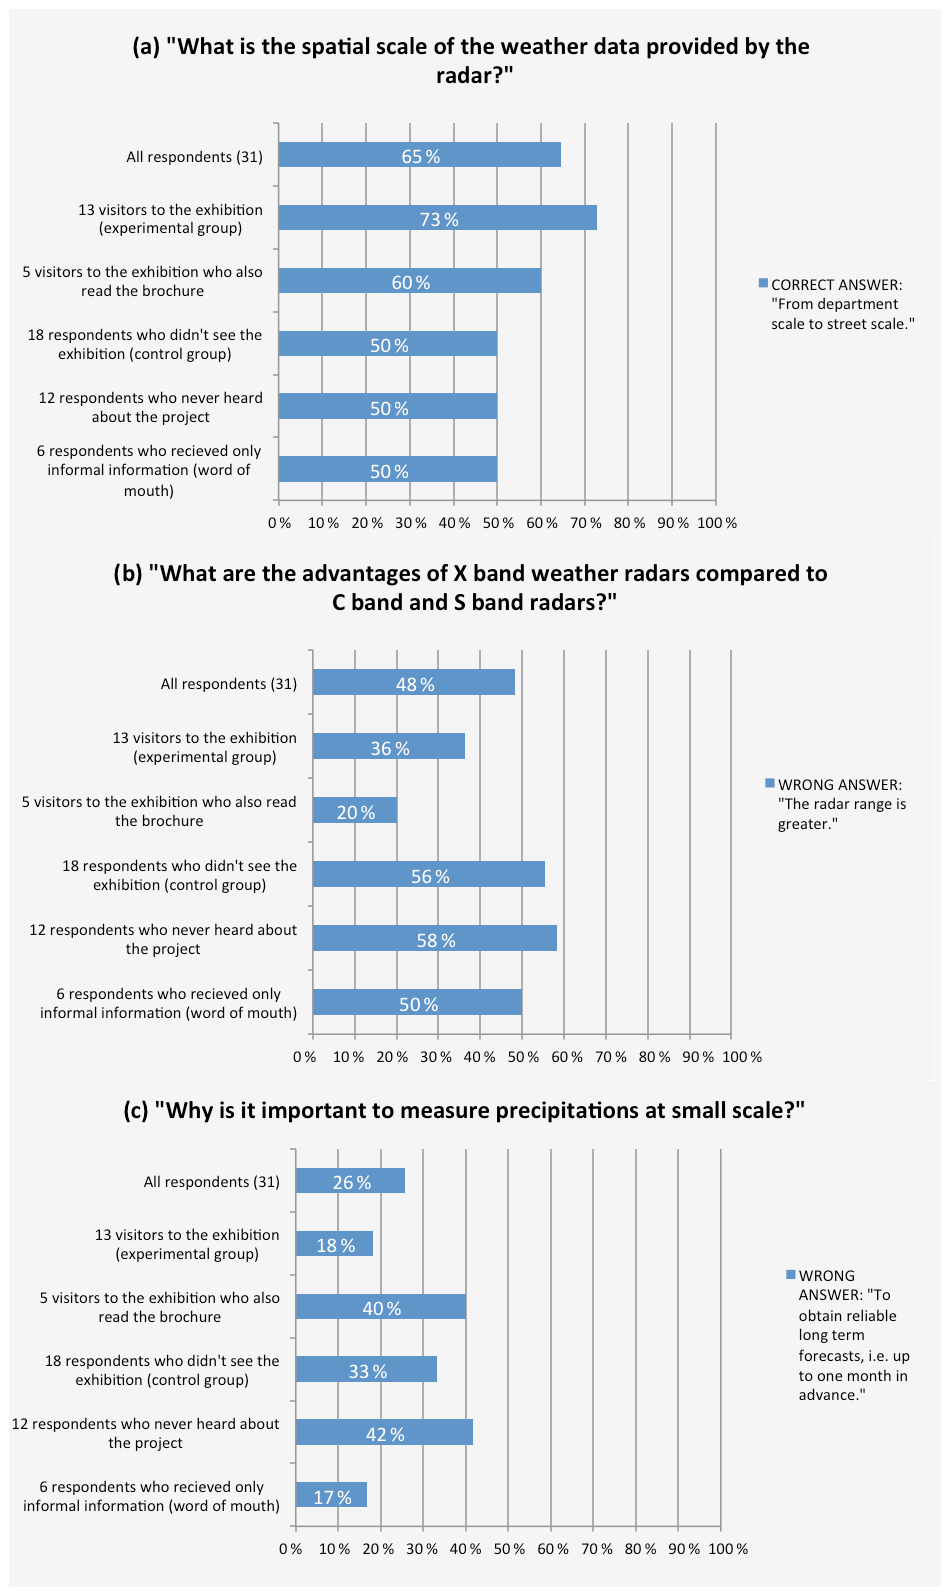
Figure 3The answers to three of the questionnaire questions on the RainGain exhibition held in April–May 2014. 100 % corresponds to the total number of respondents included in each subset: 31 respondents in the first row, 13 respondents in the second row, 5 respondents in the third row, and so on.
Figure 3a shows that the number of respondents who visited the exhibition and have ticked the correct option for the question “what is the spatial scale of the weather data provided by the radar?” is 23 % higher than in the control group. As it appears in Fig. 3b, the wrong responses to the question “what are the advantages of X band weather radars compared to C band and S band radars?” are 20 % less frequent among the exhibition visitors. According to the results presented in Fig. 3c, the number of respondents who visited the exhibition and have provided a wrong response to the question “why is it important to measure precipitations at small scale?” is 15 % lower than in the control group. The discrepancy between the visitors' results and the control group results is between 15 % and 23 % and it provides an approximate indication of the impact of the exhibition in terms of knowledge dissemination.
An unexpected result concerns the responses of the respondents who read the brochure at the exhibition in Fig. 3a and c. In Fig. 3a the rate of correct responses of the respondents who read the brochure is lower (60 %) than in the experimental group (73 %). Figure 3c shows that the rate of wrong answers by the respondents who read the brochures is surprisingly high (40 %): it is close to the rate of wrong answers by the respondents who never heard about the project (42 %). We could assume that the respondents who picked the brochure spent little time reading the exhibition panels and that part of the brochure information was not didactic or suitable enough for the general public.
Figure 3c highlights another interesting result: the lowest rate of wrong answers corresponds to the group of respondents who did not attend the exhibition but heard about the project by word of mouth. We can suppose that face-to-face communication can strongly reinforce transmission of highly technical information.
To sum up, the answer rates, displayed in Fig. 3, show that the exhibition had a modest positive effect on the respondents' awareness about a flood resilience project, the background environmental issues and the solutions being developed. We suppose that this effect was reinforced by word of mouth communication, but was also weakened by the brochure.
Figure 4 presents the answers to a questionnaire question aimed at evaluating the risk perception and project acceptance of the respondents who visited the exhibition. The results show that the exhibition and the brochure, i.e. formal and official information, helped to reassure the respondents on security issues and encouraged them to support the implementation of the flood resilience project. Word of mouth communication did not have such a positive effect as formal information, but neither did it compromise the achievement of the project goals.
The Fisher Exact test5 was applied to the results of the four questions: p values are not significant, as these are always greater than 0.05 (the conventionally accepted significance level). Hence, the test confirms that, because of the small size of the sample, the differences between the answers by the experimental group and of the control group are not statistically significant.

Figure 4Answers to a questionnaire question evaluating the risk perception of the visitors after the RainGain exhibition. 100 % corresponds to the total number of respondents included in each subset: 31 respondents in the first row, 13 respondents in the second row, 5 respondents in the third row, and so on.
5.3 Interviews
While questionnaires with closed-ended questions allow the results to be quantified, interviews can reveal more insights into the reactions and reasoning of the respondents. These research techniques do not provide quantitative variables that can be used as RCIs. Nevertheless, this is a helpful evaluation method to be adopted for exploratory studies. Two assessments based on open-ended questions were conducted during the RainGain project in relation to outreach activities.
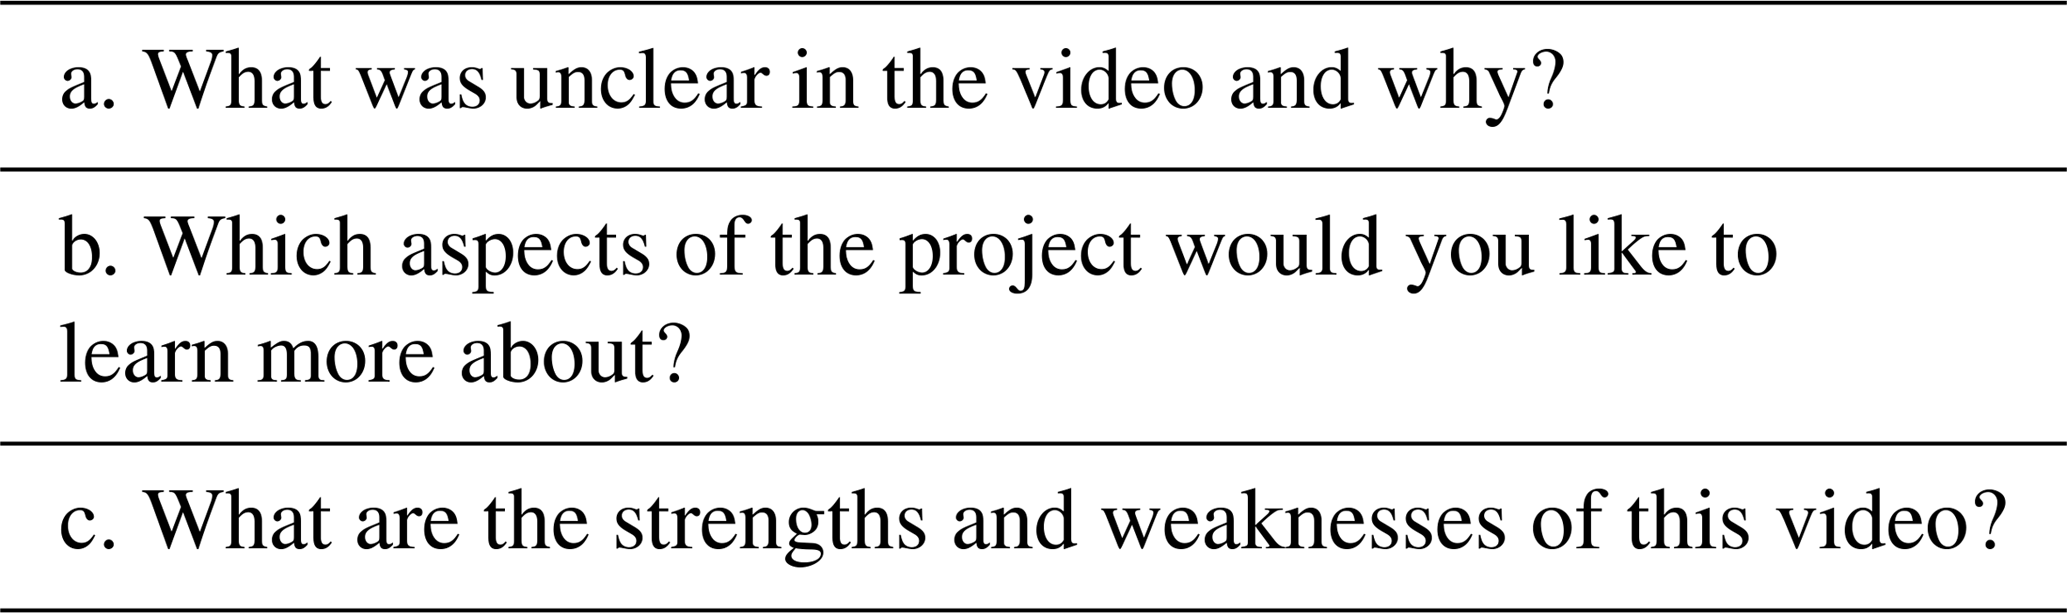
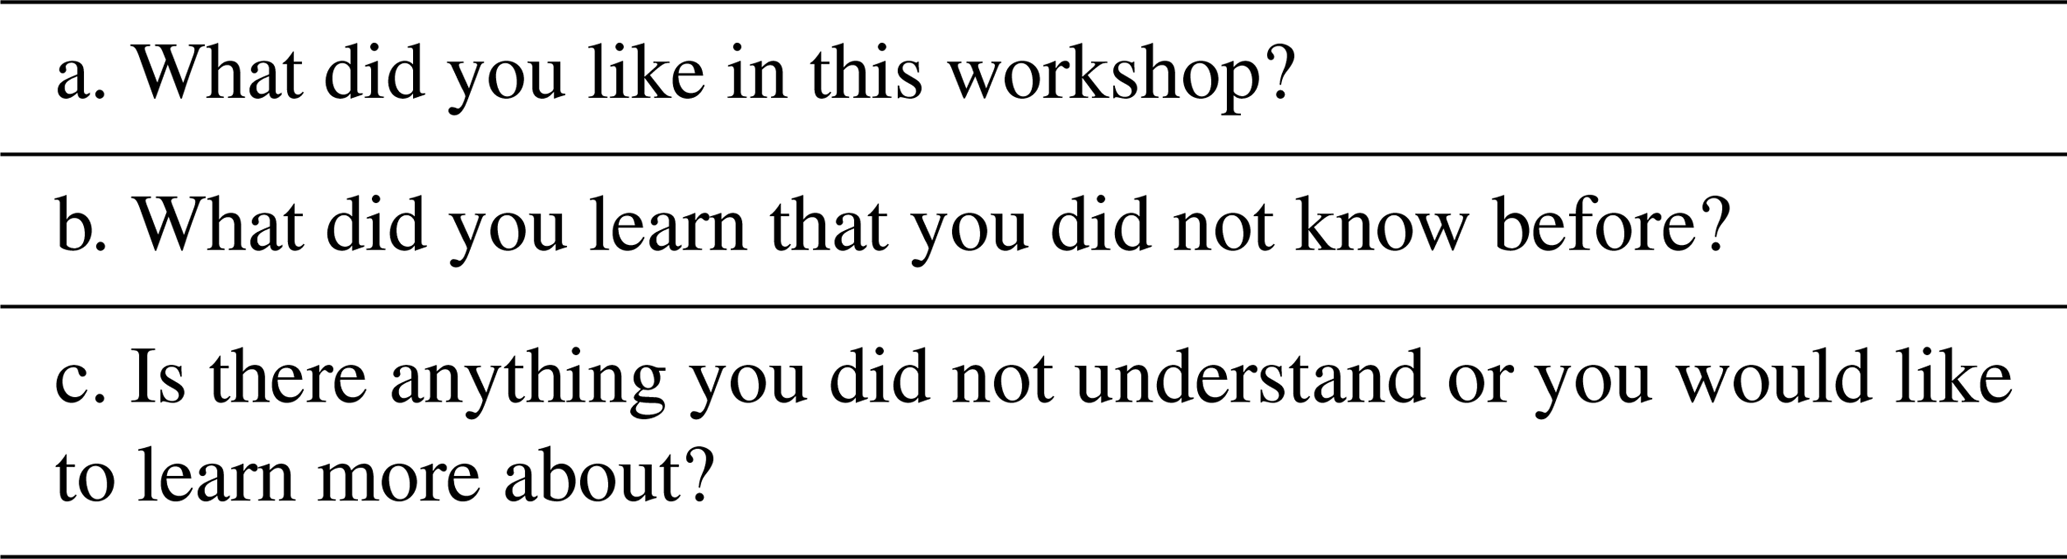
One of the achievements of RainGain has been the inauguration of a new high-resolution weather radar at École des Ponts during the international conference “Researchers & water managers preparing cities for a changing climate” (8 and 9 June 2015). The promotion of this event has involved a wide range of outreach activities and means. One of the pieces of promotional content, which was produced on this occasion, is a short video (Mulard et al., 2015). It shows the installation of the radar, highlights the importance of this device in terms of research and innovation, and invites the audience to attend the conference. The video is mainly addressed to the students and workers of École des Ponts, since the school is located in front of the radar site. Jeannine Courtot, the manager of the school café and a charismatic and well-known figure on the campus, was involved as the speaker of the video. While the video was broadcast on YouTube and on the school screens, two women and two men were interviewed (they were all university students, aged between 20 and 23 years and domiciled in the Paris region). The questions, displayed in Table 1, aimed to appraise what kind of information the audience expected, how they interpreted the video contents, and how they reacted to the interview questions. The respondents were selected from the list of students invited to the conference and they participated in the interview on a voluntary basis.
Table 1Questions to the audience of the video “Jeannine presents the radar” (Mulard, 2015).
The video was appreciated by the respondents who found it “catchy” thanks to its dynamic pacing and the charisma of the speaker. They have also found the images of the radar installation interesting. However, the respondents, who were all engineering school students, expected more information about the radar functioning and its concrete applications. They were curious about the extent of the implementation of the project (“is the radar already operational?”, “how many new radars will be installed in Europe?”, “you should include a map with the pilot sites in the video.”) and the radar functioning (“does the radar allow predicting the rainfall volume?”, “it would have been nice to see some radar images.”). They also wondered about the researchers and engineers that operate the radar, the services that can be developed with these new weather data (“is it used only for weather forecasts?”, “is it possible to use it for Roland-Garros?”). These results will be used to design new questionnaires addressed to students from an engineering school. In particular, it appears relevant to include questions that make the link with their professional interests and that are accurately tailored to their background knowledge.
A similar assessment, based on three open-ended questions (Table 2; see Supplement S2 for the respondents' answers), was undertaken in November 2015 to evaluate the impact of a workshop on RainGain (held during the Provin Climate Forum). The respondents were all the participants of the workshop: 18 pupils (10 girls and 8 boys), all aged between eight and nine years and resident in the Paris region, who had been invited by the forum organisers. We chose the snapshot interviews (Fogg Rogers et al., 2015) as an investigation method since it is an alternative technique that is appropriate for a young audience and the context of a forum. The assessment highlighted that the audience enjoyed and well remembered a manual activity on rainfall observation in which they were active participants. It also revealed that the third question was misunderstood. Its purpose was to assess the clarity and exhaustiveness of the communication contents, but the respondents interpreted it as a question testing their learning capacities. This result suggests that the questions addressed to a young audience should be formulated in such a way that the respondents do not feel like they are being examined.
Table 2Questions to the participants of the RainGain workshop, conceived and held by Auguste Gires in the framework of the Provin Forum (November 2015).
The increasing awareness of the role that citizens can play as active actors of urban resilience makes it necessary to develop relevant indicators of the communication impact. This study highlights that quantitative metrics are a promising tool for communication assessment in the framework of resilience strategies and shows, at the same time, that aggregated analysis has its limits.
The experiments carried out during the RainGain project have brought out valuable RCIs. A preliminary study of Paris flood resilience strategies and the related communication plans has allowed us to identify five recurring categories of communication variables. Each category constitutes helpful guidance to define RCIs. At this stage of the research, we are cautious in generalising the validity of the RCI guiding criteria because they refer to the resilience communication strategies adopted in a unique region to cope with a specific climate risk. Nevertheless, this work paves the way for future developments. The same applies to the following conclusions that are the result of a limited number of small-scale experiments.
The media monitoring experiment highlights that news item frequency and audience size are two RCIs that allow the estimation of the population that was reached. Furthermore, it shows that a correlation between a physical environmental process (a flood event) and a social process (press communication) can be quantified. Nevertheless, aggregated analysis does not allow investigation of the quality of the contents that have spread through the press: for instance, whether the representation of scientific innovation by the press is positive or negative and whether links between science and urban resilience are highlighted by the media. Computer-assisted text mining tools are a possible methodological path to be followed.
Such big data exploration techniques would also allow time and cost constraints that were encountered with the questionnaire experiment to be overcome, the results of which should be validated with a larger sample. However, thanks to this experiment it has been possible to (1) design RCIs aimed at evaluating how a message has been interpreted and perceived by a non-specialist audience, (2) test their implementation in the operational context of a resilience communication campaign, and (3) compare the experimental group response with the control group response in order to normalise the response ratings to different questions.
The questionnaire did not provide in-depth understanding of the respondents' reasoning and reactions. On the contrary, qualitative assessment methods, such as interviews, allow for moving beyond an aggregated analysis and for zooming into an individual perspective. Nevertheless, for the purposes of this research, qualitative research methods are adequate for preliminary studies. The interview outcomes show that these results can be used to develop the content of the questionnaire and ensure that questions are formulated in an appropriate fashion.
The methods tested through these three experiments appear to be complementary and endorse the following conclusions: assessment aimed to investigate the impact of communication on resilience cannot rely on a unique technique, and quantitative analysis is paramount in this context. Indeed, data in numerical form facilitate the study of interactions between the communication processes and other resilience drivers, such as meteorological events. Investigating these interactions is a necessary basis to integrate communication indicators in a wider urban resilience assessment.
As a follow-up to this study, we envisage comparing the present results with those obtained by investigating the quality of digital media contents and the socio-semantic dynamics that occur through the Web. From a resilience assessment perspective, the advantage of digital communication datasets is that they allow extracting numerical data on social relations. Moreover, thanks to computer-aided exploration techniques it is possible to consider both the global trend and the individual behaviour. The RCIs employed in the media monitoring and questionnaire experiments could be tested on larger scales thanks to big data exploration techniques. At the same time, the methods discussed in this paper can be used to detect possible biases induced by the Web. This emphasises again the need to use complementary techniques to assess communication impact on urban resilience.
Underlying research data can be found in the Supplement to this article.
The supplement related to this article is available online at: https://doi.org/10.5194/gc-2-25-2019-supplement.
This research was carried out by RV and supervised by IT and DS.
The authors declare that they have no conflict of interest.
The authors gratefully acknowledge partial financial support of the chair “Hydrology for resilient cities” endowed by Veolia and of the Interreg NWE IVB RainGain project.
Edited by: Mathew
Stiller-Reeve
Reviewed by: three anonymous referees
Adger, W. N.: Vulnerability, Global Environ. Chang., 16, 268–281, https://doi.org/10.1016/j.gloenvcha.2006.02.006, 2006.
Bauer, M.: Survey research on public understanding of science, in: Routledge Handbook of Public Communication of Science and Technology, edited by: Bucchi, M. and Trench, B., Routledge, London, UK, 111–129, 2008.
Bellwood, D. R., Hughes, T. P., Folke, C., and Nyström, M.: Confronting the coral reef crisis, Nature, 429, 827–833, 2004.
Berkes, F., Colding, J., and Folke, C.: Navigating Social-ecological Systems: Building Resilience for Complexity and Change, Cambridge University Press, Cambridge, UK, 2003.
Carpenter, S. R.: Regime Shifts in Lake Ecosystems: Pattern and Variation, Ecology Institute, Oldendorf/Luhe, Germany, 2003.
Carpenter, S., Walker, B., Marty Anderies, J., and Abel, N.: From metaphor to measurement: Resilience of what to what?, Ecosystems, 4, 765–781, https://doi.org/10.1007/s10021-001-0045-9, 2001.
Charrière, M. K. M., Junier, S., Bogaard, T. A., Mostert, E., Malet, J.–P., and van de Giesen, N.: The impact of an exhibition on risk awareness of the general public in mountainous areas, Int. J. Disast. Risk Re., 25, 36–59, https://doi.org/10.1016/j.ijdrr.2017.07.011, 2017.
Cutter, S. L., Barnes, L., Berry, M., Burton, C., Evans, E., Tate, E., and Webb, J.: A place – based model for understanding community resilience to natural disasters, Global Environ. Chang., 18, 598–606, https://doi.org/10.1016/j.gloenvcha.2008.07.013, 2008.
Cutter, S. L., Burton, C. G., and Emrich, C. T.: Disaster resilience indicators for benchmarking baseline conditions, J. Homel. Secur. Emerg., 7, 51, https://doi.org/10.2202/1547-7355.1732, 2010.
Cutter, S. L., Ash, K. D., and Emrich, C. T.: The geographies of community disaster resilience, Global Environ. Chang., 29, 65–77, https://doi.org/10.1016/j.gloenvcha.2014.08.005, 2014.
DRIEE: Plan de Gestion des Risques d'Inondation 2016–2021 – Bassin Seine–Normandie, Direction Régionale et Interdépartementale de l'Environnement et de l'Énergie, Paris, France, 156 pp., available at: http://www.driee.ile-de-france.developpement-durable.gouv.fr/IMG/pdf/PGRI_2015_WEB_240416.pdf (last access: 14 January 2019), 2015.
DRIEE/DBSN: CPiER Plan Seine, Direction Régionale et Interdépartementale de l'Environnement et de l'Énergie, Paris, France, 19 pp., available at: https://www.iledefrance.fr/sites/default/files/cpierv30_signe-2_0.pdf (last access: 14 January 2019), 2015.
EPBT SGL: Programme d'Actions de Prévention des Inondations de la Seine et de la Marne Franciliennes (PAPI), Établissement Public Territorial de Bassin Seine Grands Lacs, Paris, France, 28 pp., available at: http://seinegrandslacs.fr/sites/default/files/dossier_synthese_papi.pdf (last access: 14 January 2019), 2014.
Fogg Rogers, L., Grand, A., and Sardo, M.: Integrating public engagement into our research, Science in Public Conference 2015, Bristol, UK, 9–10 July 2015.
Folke, C.: Resilience: the emergence of a perspective for social–ecological systems analyses, Global Environ. Chang., 16, 253–267, 2006.
Folke, C., Carpenter, S. R., Walker, B., Scheffer, M., Chapin, T., and Rockström, J.: Resilience thinking: Integrating resilience, adaptability and transformability, Ecol. Soc., 15, 20, http://www.ecologyandsociety.org/vol15/iss4/art20/, 2010.
Godin, B. and Gingras, Y.: What is scientific and technological culture and how is it measured? A multidimensional model, Public Underst. Sci., 9, 43–58, 2000.
Grandi, R. and Neri, F.: Sentiment analysis and city branding, in: New Trends in Databases and Information Systems, Advances in Intelligent Systems and Computing, edited by: Catania, B., Cerquitelli, T., Chiusano, S., Guerrini, G., Kämpf, M., Kemper, A., Novikov, B., Palpanas, T., Pokorný, J., and Vakali, A., 241, Springer, Cham, Switzerland, 339–349, 2014.
Gunderson, L. H. and Holling, C. S.: Panarchy: Understanding Transformations in Human and Natural Systems, Island Press, Washington DC, USA, https://doi.org/10.1007/978-3-319-01863-8_36, 2002.
Haider, J. L., Quinlan, A., and Peterson, G. D.: Interacting traps: resilience assessment of a pasture management system in Northern Afghanistan, Planning Theory and Practice, 13, 299–333, 2012.
Inter-organisational Committee on Guidelines and Principles for Social Impact Assessment: Guidelines and Principles for Social Impact Assessment, Impact Assessment, 12, 107–152, https://doi.org/10.1080/07349165.1994.9725857, 1994.
Interreg NWE IVB RainGain: Communication Strategy, RainGain Project, Interreg NWE IVB Programme, Lille, France, 21 pp., 2011.
Keating, A., Campbell, K., Szoenyi, M., McQuistan, C., Nash, D., and Burer, M.: Development and testing of a community flood resilience measurement tool, Nat. Hazards Earth Syst. Sci., 17, 77–101, https://doi.org/10.5194/nhess-17-77-2017, 2017.
Kirch, P. V.: Archaeology and global change, Annu. Rev. Env. Resour., 30, 409–440, https://doi.org/10.1146/annurev.energy.29.102403.140700, 2005.
Koole, W., Overeem, A., Van Riemsdijk, M. B., Uijlenhoet, R., and Ten Veldhuis, J. A. E.: Rain sense: Sensors and citizens preparing Amsterdam for future weather, in: Proceedings of the Amsterdam International Water Week Conference – IWW2015, Amsterdam, the Netherlands, 2–6 November 2015, 1–4, 2015.
Lundgren, R. E. and McMakin, A. H.: Risk Communication. A Handbook for Communicating Environmental, Safety and Health Risks, Battelle Press, Colombus, USA, 453 pp., 2004.
Maidl, E. and Buchecker, M.: Raising risk preparedness by flood risk communication, Nat. Hazards Earth Syst. Sci., 15, 1577–1595, https://doi.org/10.5194/nhess-15-1577-2015, 2015.
Mairie de Paris and 100 Resilient Cities: Stratégie de Résilience de Paris, Mairie de Paris, Paris, France, 65 pp., available at: https://api-site-cdn.paris.fr/images/95335 (last access: 14 January 2019), 2017.
Mairie de Paris and Prefecture de Police: Plan Communal de Sauvegarde de Paris, Mairie de Paris and Prefecture de Police, Paris, France, 81 pp., available at: http://www.prefecturedepolice.interieur.gouv.fr//var/pp_fr/storage/original/application/df16d4824f5e3c48ef4244ee83d1a800.pdf (last access: 14 January 2019), 2015.
Mairie de Paris, Direction des Espaces Verts et de l'Environnement, Agence d'Écologie Urbaine: Plan Climat Énergie de Paris – Stratégie d'Adaptation, Mairie de Paris, Paris, France, 64 pp., available at: https://api-site.paris.fr/images/76270, 2015.
MEDDE: Stratégie Nationale de Gestion des Risques d'Inondation, Ministère de l'Écologie, du Développement Durable et de l'Énergie, Paris, France, 24 pp., available at: http://www.driee.ile-de-france.developpement-durable.gouv.fr/IMG/pdf/Strategie_nationale_de_gestion_des_risques_d_inondation_cle2b1737.pdf (last access: 14 January 2019), 2014.
Millennium Ecosystem Assessment (MA): Ecosystems and Human Well–being: Synthesis. Island Press, Washington DC, 155 pp., available at: https://www.millenniumassessment.org/documents/document.356.aspx.pdf (last access: 14 January 2019), 2005.
Mulard, A.: Action de diffusion de la culture scientifique sur le risque d'inondations urbaines et évaluation de son impact, Scientific internship report, LEESU, École des Ponts ParisTech, Champs–sur–Marne, France, 61 pp., 2015.
Mulard, A., Ali, M., and Vicari, R.: Jeannine presents the radar, Interreg NEW IVB RainGain, École des Ponts ParisTech, Champs–sur–Marne, France, available at: https://vimeo.com/127724670 (last access: 14 January 2019), 2015.
Neresini, F. and Pellegrini, G.: Evaluating public communication of science and technology, in: Routledge Handbook of Public Communication of Science and Technology, edited by: Bucchi, M. and Trench, B., Routledge, London, UK, 237–251, 2008.
OECD: Seine Basin, Île–de–France, 2014: Resilience to Major Floods, OECD Reviews of Risk Management Policies, 204 pp., available at: http://www.keepeek.com/Digital-Asset-Management/oecd/governance/seine-basin-ile-de-france-2014-resilience-to-major-floods_9789264208728-en#.WEgUr2QrI9c (last access: 14 January 2019), 2014.
Persoz, B.: Reduction of the flood risk in urban environment. The stakes of science communication, Scientific internship report, LEESU, École des Ponts ParisTech, Marne–la–Vallée, France, 74 pp., 2014.
Resilience Alliance: Assessing Resilience in Social–ecological Systems: Workbook for practitioners. Version 2.0, 54 pp., available at: http://www.resalliance.org/files/ResilienceAssessmentV2_2.pdf (last access: 14 January 2019), 2010.
Rohrmann, B.: The evaluation of risk communication effectiveness, Acta Psychol., 81, 169–192, 1992.
Ruth, M. and Coelho, D.: Understanding and managing the complexity of urban systems under climate change, Clim. Policy, 7, 317–336, https://doi.org/10.1080/14693062.2007.9685659, 2007.
Schertzer, D. and Lovejoy, S.: Space–time complexity and multifractal predictability, Physica A, 338, 173–186, https://doi.org/10.1016/j.physa.2004.04.032, 2004.
Scheufele, D. A. and Lewenstein, B. V.: The public and nanotechnology: how citizens make sense of merging technologies, J. Nanopart. Res., 7, 659–667, 2005.
Tanguy, J.-M.: Analyse Intégrée de Résilience Territoriale, Colloque SHF AFEPTB, Gestion des Risques d'Inondation, Paris, France, 27–28 May 2015, 2015.
Tchiguirinskaia, I., Schertzer, D., Giangola-Murzyn, A., and Hoang, T. C.: Multiscale metrics to assess complex system resilience, in: Proceedings of ICCSA 2014, Normandie University, Le Havre, France, 23–26 June 2014, 225–231, 2014.
Terpstra, T., Lindell, M. K., and Gutteling, J. M.: Does communicating (Flood) risk affect (Flood) risk perceptions? Results of a quasi-experimental study, Risk Anal., 29, 1141–1155, 2009.
Topping, D. and Illingworth, S.: Using sentiment analysis to observe how science is communicated, EGU General Assembly, Vienna, Austria, 17–22 April 2016, EGU2016-805, 2016.
UN/ISDR: Sendai Framework for Disaster Risk Reduction, United Nations secretariat of the International Strategy for Disaster Reduction (UN/ISDR), Geneva, Switzerland, 37 pp., available at: https://www.preventionweb.net/files/43291_sendaiframeworkfordrren.pdf (last access: 14 January 2019), 2015.
UN/ISDR: Disaster Resilience Scorecard for Cities: Detailed level assessment (UN/ISDR), Geneva, Switzerland, 118 pp., available at: https://www.unisdr.org/campaign/resilientcities/assets/documents/guidelines/04 Detailed Assessment_Disaster resilience scorecard for cities_UNISDR.pdf (last access: 14 January 2019), 2017.
Vicari, R.: Digital traces of climate risks: assessing the communication impact of Paris resilience strategy, PhD dissertation, HM&Co, École des Ponts ParisTech, Marne–la–Vallée, France, 267 pp., defended on 5 November 2018.
Vicari, R., Schertzer, D., and Tchiguirinskaia, I.: State of the Field of Social Impact Assessment under the Paris – R100 Projection, 107 pp., Chair Hydrology for Resilient Cities, École des Ponts ParisTech, Champs–sur–Marne, France, 2016.
Wagoner, B. and Jensen, E.: Microgenetic Evaluation: Studying Learning in Motion, in: Reflexivity in Psychology, edited by: Marsico, G., Andrisano Ruggeri, R., and Salavatore, S., Information Age Publishing, 2015.
Walker, B. H. and Meyers, J. A.: Thresholds in ecological and social–ecological systems: a developing database, Ecol. Soc., 9, 3, http://www.ecologyandsociety.org/vol9/iss2/art3/, 2004.
Walker, B., Holling, C. S., Carpenter, S. R., and Kinzig, A.: Resilience, adaptability and transformability in social–ecological systems, Ecol. Soc., 9, 5, http://www.ecologyandsociety.org/vol9/iss2/art5, 2004.
INTERREG IVB North-West Europe “is a financial instrument of the European Union's Cohesion Policy. It funds projects which support transnational cooperation” (Interreg NWE IVB: http://4b.nweurope.eu/, last access: 20 November 2018).
Subsidiarity is the principle that decisions should be taken and tasks should be performed as close as possible to the citizen or to where they will have their effect. Hence, central authority should have a subsidiary function and cover those decisions and tasks that cannot be managed at local level (Oxford English Dictionary: https://en.oxforddictionaries.com/, last access: 20 November 2018).
The Sendai Framework is a 15-year agreement adopted in March 2015 by UN member states to ensure “the substantial reduction of disaster risk and losses in lives, livelihoods and health and in the economic, physical, social, cultural and environmental assets of persons, businesses, communities and countries” (Sendai Framework: https://www.unisdr.org/we/coordinate/sendai-framework, last access: 22 October 2018). The Sendai Framework succeeds to the Hyogo Framework for Action (HFA) 2005–2015: Building the Resilience of Nations and Communities to Disasters.
We use the term “by word of mouth” to refer to information that was passed from person to person – working or studying at the school – by oral and informal communication.
We have computed a 2 × 2 contingency table, for each questionnaire question, with the frequencies of (a) the correct answers by the experimental group, (b) the correct answers by the control group, (c) the wrong answers by the experimental group and (d) the wrong answers by the control group. We then applied the Fisher's exact test because in all the 2 × 2 contingency tables at least one value is N=5. The test uses the following formula where the “a”, “b”, “c” and “d” are the individual frequencies of the 2 × 2 contingency table, and “N” is the total frequency:
- Abstract
- Introduction
- Social–ecological resilience, from theory to implementation
- Communication indicators in the literature on resilience assessment techniques
- Assessing the impact of communication on urban resilience to extreme weather
- The RainGain project: experiences in communication assessment for an urban resilience project
- Conclusions and perspectives
- Data availability
- Author contributions
- Competing interests
- Acknowledgements
- References
- Supplement
resilience communication indicators.
- Abstract
- Introduction
- Social–ecological resilience, from theory to implementation
- Communication indicators in the literature on resilience assessment techniques
- Assessing the impact of communication on urban resilience to extreme weather
- The RainGain project: experiences in communication assessment for an urban resilience project
- Conclusions and perspectives
- Data availability
- Author contributions
- Competing interests
- Acknowledgements
- References
- Supplement