the Creative Commons Attribution 4.0 License.
the Creative Commons Attribution 4.0 License.
 | 12 Jan 2026
The effect of advocacy on perceived credibility of climate scientists in a Dutch text on greening of gardens
Celine Weel
Rens Vliegenthart
Many climate scientists refrain from advocacy and activism because they worry it decreases their credibility. Through a survey of almost 1000 Dutch respondents, we compare responses to a text written in a neutral tone to those of a text written in an advocating tone on perceived credibility of the authoring scientist in these texts. Analyses show that the perceived credibility of the scientist who authored the text increases by advocacy overall, and that the advocating scientist is considered more credible than the neutral scientist specifically in their perceived sensitivity and care for society. We also analyse the effect of the type of visual element in the text, to test whether a visual element that is more science-based can increase the perceived credibility of the scientist in the knowledge domain. However, we do not find any significant differences between a scientific bar chart and a stock photo. Based on these results, we conclude that advocacy can increase the climate scientist's average perceived credibility. However, we find that the fraction of respondents that feels called to action is not higher for those who read the advocacy text, suggesting that advocacy does not stimulate behavioural change in this case.
- Article
(4851 KB) - Full-text XML
- BibTeX
- EndNote


Given the urgency of the climate crisis, climate scientists are increasingly called upon to engage in advocacy as they may play a role in encouraging and inspiring the public to contribute to climate action, or to influence policymaking (Besley and Dudo, 2017; Capstick et al., 2022; Gundersen et al., 2022; Wijnen et al., 2024). A recent global study (Cologna et al., 2025) showed that indeed, in almost all countries included in the sample, a majority of people want scientists to be involved in policymaking. In addition, a recent survey (Dablander et al., 2024) indicated that 29 % of scientists engage in advocacy, and 58 % of scientists are willing to do so. However, fear of negative consequences of engaging in advocacy, such as a fear of repercussions or reprimands from their institutes or peers, stops many scientists from speaking out. Some scientists fear that advocacy undermines their credibility in the eyes of the public (Cologna et al., 2021; Dablander et al., 2024; Messling et al., 2025) because it is not the scientist's place to engage in advocacy, and they need to “let the science speak for itself” (Fischhoff, 2007). Moreover, scientists might fear that advocacy by one individual scientist may influence how the public appreciates the scientific community as a whole (Kotcher et al., 2017). Yet, multiple studies among citizens in various countries revealed that the credibility of climate scientist as perceived by the public are not negatively affected by openly supporting climate policies (Cologna et al., 2021) or only in cases in which a scientist advocates for a very specific or highly controversial policy (Beall et al., 2017; Kotcher et al., 2017).
Previous research on reception of advocacy among scientists by the public has been either very general – in the sense of: “How do you feel about climate scientists advocating for specific policies?” (Cologna et al., 2021) – or focused on hypothetical social media content presented to the participants (Kotcher et al., 2017). There has thus been little research on platforms on which scientists and the public interact, such as question-and-answer (Q&A) platforms. Interaction on these platforms may be initiated by either party, instead of only providing “downstream” communication from the scientific community to the public. For example, a member of the public might post a question related to climate change that a scientist may respond to, opening a dialogue between scientists and the public, which experts argue is the way forward to promote trust in scientists (Cologna et al., 2025; Gundersen et al., 2022). Furthermore, the questions and answers on these websites often pertain to very practical solutions that readers can take themselves, in their own daily lives.
The aim of this study is to explore how readers experience advocacy in a text on climate change impacts and solutions of the greening of gardens taken from such a Q&A-website, and to investigate whether advocacy affects how credible the readers consider the authoring scientist to be. We focus on a text about the urban climate effects of greenery in gardens as opposed to stone/tiled gardens (e.g., Heusinkveld et al., 2014; Klok et al., 2019), because the topic is relatively uncontroversial and because it facilitates discussion of both individual behaviour change (you should include more greenery in your garden) as well as policy-change (the government should oblige people to include more greenery in their gardens).
Learning more about the extent to which advocacy influences scientists' credibility as perceived by their readers may help scientists communicating climate change to determine which role they should take in terms of advocacy to promote sustainable behaviour while still being considered credible. Empirical findings from this study may serve as endorsement for the many climate scientists who are willing to take a more advocacy-driven approach in their communications but are unsure of the consequences (Dablander et al., 2024).
2.1 Credibility in texts
The extent to which climate scientists should get involved in public engagement is discussed elaborately (Nelson and Vucetich, 2009; Besley and Dudo, 2017; Capstick et al., 2022; Gundersen et al., 2022; Büntgen, 2024; van Eck et al., 2024). In his framework, Pielke. (2007) defined four roles scientists may take in the context of policy: Pure Scientist, Science Arbiter, Issue Advocate, and Honest Broker of Policy Alternatives. In the context of this study, the roles of the Science Arbiter and the Issue Advocate will be the focus: one in which a scientist is asked a question and answers with only facts (Science Arbiter) and one in which a scientist advocates for specific choices (Issue Advocate).
An argument that is often used against advocacy by scientists is that it may hurt public trust in science (Büntgen, 2024; Fischhoff, 2007) or the perceived credibility of science in general or individual scientists (Cologna et al., 2021; Dablander et al., 2024). This would be problematic, as credibility has been found to be a strong mediator between information intake and intended climate action (Attari et al., 2016; Dong et al., 2018). Scientists' credibility, reflected in characteristics such as competence, goodwill and integrity are perceived to be high (Cologna et al., 2025; Van den Broek-Honingh et al., 2021), giving them some “leeway” in terms of credibility in these times of polarizing trust (Edelman Trust Institute, 2024). This creates a strange contrast where scientists may be willing to engage in advocacy while, as yet, less than half do so globally because of intellectual (e.g., not the role of researcher or lack of knowledge) or practical (e.g., lack of time or skills) barriers (Dablander et al., 2024).
Previous studies have revealed that, indeed, public trust in scientists can be affected negatively when scientists adopt a persuasive tone of voice as opposed to an informative one, but that this decline in trust can be explained by a mismatch between the expectations the public has of the communicating scientist or organization and the actual communication (Rabinovich et al., 2012). In other words, when the scientist is transparent about their motivations, this decline in trust is not observed.
Adding to this, Cologna et al. (2021) found that 74 % of members of the general public in the US and 70 % in Germany believe climate scientists should actively advocate for specific climate-related policies. The researchers found that such active advocacy decreases a hypothetical scientist's perceived objectivity, but not their trustworthiness or honesty, and increases the public's perception of them acting in the interest of society. Cologna et al. (2021) concluded that their “results suggest that scientists' anxieties about loss of credibility from engagement may be misplaced” (p. 8) and that scientists should not abstain from public engagement based on fears of jeopardized credibility.
Investigating the applicability of this conclusion in a Dutch context, we will focus on answering the following question (see also our pre-registration at https://aspredicted.org/w3cf-qgf9.pdf, last access: 6 January 2026):
-
RQ1: How does a text written in the Issue Advocate role versus the Science Arbiter role affect the credibility of the writing scientist?
Based on outcomes of previous research (Beall et al., 2017; Kotcher et al., 2017; Cologna et al., 2021), the hypothesis to this question is as follows:
-
H1: Readers of a text on climate change impacts and solutions of greening gardens will perceive an authoring scientist taking either the Issue Advocate or the Science Arbiter role as equally credible.
2.2 Credibility in visual elements
Furthermore, we will investigate whether the type of visual element that is included with the article has an impact on the credibility. In past research there has been a lot of attention for written science communication, but less for the role of visuals (Murchie and Diomede, 2020). There are indications that visuals used to communicate science in general and climate change specifically are important (León et al., 2022; McCabe and Castel, 2008). Visuals play a critical role in environmental communication, influencing both cognitive and affective responses (Borah, 2009; Rodriguez and Dimitrova, 2011; Williams et al., 2023).
Visuals are perceived in an associative and quick manner and are better at attracting attention than text (Mooseder et al., 2023). Moreover, they have the ability to quickly convey the general gist of a message (Ware, 2008). Therefore, visuals are considered highly relevant and influential message features that can be expected to play a role in the reach and impact of messages (Li and Xie, 2020).
In the context of climate change specifically, research has shown that specific visuals, such as visuals that tell stories, include local connections, and show “real” people, affect the levels of concern and that they may play a role in promoting public engagement with the issue (León et al., 2022; Metag, 2020). Indeed, Smith and Leiserowitz (2014) argued that environmental campaigns can leverage the power of visuals to raise awareness, evoke affective responses, and motivate people to take action. Visuals have the potential to emphasize the severity of the issue and make climate change feel more concrete (Wang et al., 2018). More recently, Li et al. (2023) showed more artistic visualizations, when compared to data graphs, elicited stronger positive emotions but did not differ in perceived credibility or effectiveness.
However, the precise effects of visuals in a setting with texts remain obscure. Leerink et al. (2024) suggest that the limited effect of personalization on the credibility of an author that they found in their experiment could be because the visual element (a graph) was unchanged, “giving the overall look of the article a more expository feel”. In an academic context, Pferschy-Wenzig et al. (2016), for example, showed that the mere presence of a graphical abstract in a paper does not automatically lead to more engagement with that paper (higher rates of article downloads, abstract views, or citations). Ibrahim et al. (2017), however, showed that graphical abstracts in social media posts were related to higher engagement with these posts. And in the context of pro-environment communication, Lazard and Atkinson (2015) also showed that visuals such as infographics are effective tools to communicate messages intended to change attitude and behavior and recommend the evaluation of the use of visuals in other contexts.
There are many examples of visual communication in science, but these mostly focus on graphs and figures in academic interactions (Rodríguez Estrada and Davis, 2015). And while data visualizations such as graphs can be effective, they can also be misleading (Szafir, 2018; Wijnker et al., 2022). This duality is the result of our natural and intuitive mode of information processing, e.g., bigger means more, closer means related, etc. (van den Broek, 2012; Cairo, 2019). As León et al. (2022) argued, in these screen-based and graphics-heavy times, understanding the role visuals play in science communication is especially important.
To explore to what extent a scientific visual will increase credibility of the scientist, especially in the competence domain, we will also research the following secondary research question:
-
RQ2: How does a visual element that shows scientific data affect the credibility of the authoring scientist, compared to a more general stock photo?
As we expect that visual elements that show scientific data increase the credibility of the author, our associated hypothesis is:
-
H2: Readers of a text on climate change impacts and solutions of greening gardens will perceive authors as more credible when the visual element shows scientific data.
3.1 Context
This research uses an original text from the Q&A platform KlimaatHelpdesk, which is a Dutch website on which visitors submit questions that are answered and peer-checked by scientists or experts, as identified by the topic of their PhD (Stichting KlimaatHelpdesk, 2023a). Questions and answers are published on the platform, and all visitors can access the previously asked and answered questions. The pool of experts who provide answers includes over 400 Dutch speaking contributors, representing a wide array of disciplines; similarly, questions on KlimaatHelpdesk include a wide range, from individual behaviour (“Which is better for the climate: a paper book or an e-book?”) to geographical explanations (“What is the impact of extreme weather, caused by climate change, on nature?”) to societal impact (“How do we get politics in motion to combat the climate crisis?”) to name a few. KlimaatHelpdesk's objectives are to provide “high-level scientific findings in a simple language that is accessible for the general public” and “answers based on scholarly standards of scientific integrity and objectivity” (Stichting KlimaatHelpdesk, 2023a). In 2023, KlimaatHelpdesk attracted 98 000 visitors and answered 32 questions (Stichting KlimaatHelpdesk, 2023b). Note that KlimaatHelpdesk provides limited possibility for interaction; a visitor poses a question, which is answered by an expert. There is no room for interaction after this on the Q&A platform itself. However, the Q&A characteristic of KlimaatHelpdesk makes it possible to distinguish Pielke's roles of Science Arbiter and Issue Advocate.
3.2 Text conversion
We select an existing Dutch text from KlimaatHelpdesk with the (translated) title: “What are the climate effects of a tiled or green garden?” The original Dutch text is shortened for the Science Arbiter condition, from 1369 words to 331 words, and the title is changed to “Removing all tiles from Dutch gardens is good for climate”. To make the original author unrecognisable, the byline of the original text is changed to the non-existing “Prof Ben van Weel”, with an affiliation as professor of ecology and climate at Utrecht University. A translated version of this text is available in Appendix A.
Then, the text is adjusted by adding advocacy elements to form the Issue Advocate condition text. Concrete guidelines on writing as an Issue Advocate are sparse. Multiple experts agree that stating what one “should” do or prefer is a key characteristic for advocacy (Pielke, 2007; Donner, 2014) and that scientists should only address issues that are within their scientific expertise (Gundersen et al., 2022; Pierson, 2012; Steneck, 2011). Additionally, Pierson (2012) and Steneck (2011) agree that advocating scientists should point out limitations, address opposing scientific views when relevant, and explaining the scientific process. Moreover, scientists should make clear when they are addressing an issue from: (a) an individual standpoint as a scientist, (b) an individual standpoint as a civilian, and (c) when they are representing a scientific community (Post and Bienzeisler, 2024; Steneck, 2011). These adjustments are highlighted as italic and underlined text in Appendix A. Based on literature, the following advocacy guidelines are included as elements in the converted advocacy text (N.B. not all alterations are included in this list, but one or two examples per guideline):
-
Addressing the issue from the individual scientist perspective: “As a scientist, I believe that…”
-
Stating what should be done: “So my message to everyone is: get rid of those garden tiles!”
-
Uncertainty in science: “Calculating the precise impact of climate policy is difficult. But all in all…”
-
Addressing the issue from a scientific community perspective: “While other research shows that…”
-
Addressing the issue from individual civilian perspective (personalization): “I recently removed all the tiles from my garden” and “That is why I also built a wadi myself”
These five types of additions result in the Dutch Issue Advocate text being 425 words; see Appendix A for a translated version of the text. The title of the Issue Advocate text is the same as that of the Science Arbiter text.
3.3 Visual element conversion
To assess the effect of the visual on the credibility of the text and the author (as hypothesised by Leerink et al., 2024), we add two types of visual elements: an Excel bar chart providing data on the temperature effect when everyone in a list of five Dutch cities would make their garden green (Fig. B1 in Appendix B); and a stock photo of a wadi (taken from the website of a garden designer), intentionally without any people in the photo to make it as general as possible (Fig. B2 in Appendix B). The bar chart is a slight adaptation of one of the visual elements in the original KlimaatHelpdesk article and is intended as a “scientific” visual that we (following Hypothesis 2) expect would increase the credibility of the article and thereby the author.
3.4 Respondents and survey design
Differences in effects between the condition texts and visual elements are measured with a survey. Questions to assess whether respondents pick up on advocacy in the text, as well as the credibility measure, are adapted from Kotcher et al. (2017) and Leerink et al. (2024). Data has been collected through Ipsos I&O, one of the largest public survey panels in the Netherlands, from 7 to 21 January 2025. In total, 1002 respondents filled out the survey. The respondents were recruited from the national Ipsos I&O panel, and were representative of the wider Dutch adult population so had a similar distribution of education levels as the Dutch public as a whole.
At the start of the survey, respondents read and agree to a consent statement, after which they answer questions to assess their Science Capital and Trust and their level of Climate Change Concern. The respondents are then randomly assigned to either the Science Arbiter or the Issue Advocate text condition (Appendix A) and the Bar chart or Photo condition (Appendix B), which determine the corresponding combination of text and visual element they read. All subsequent questions are the same, irrespective of condition.
After reading the text-with-visual, respondents are asked to reflect in one or two sentences of open text on their reading or opt not to provide feedback. They cannot navigate back to the text, so must answer all questions from their memory. Six respondents report they don't know what the text is about because they hadn't read it, so these respondents are removed from the analysis. This means that the analysis is done with 996 respondents: 251 in the condition “Science Arbiter with Bar chart”, 254 in the condition “Science Arbiter with Photo”, 242 in the condition “Issue Advocate with Bar chart” and 249 in the condition “Issue Advocate with Photo”.
3.5 Measures
As demographic information was readily available as respondents were part of an existing Ipsos I&O panel, these were not measured (see Appendix C for an overview). In order to assess the science capital and trust of our respondents, we posed five questions derived from IMPACTLAB (Peeters et al., 2022; Leerink et al., 2024). They are “I am generally aware of new scientific discoveries and developments”, “I generally find scientists to be trustworthy”, “I am interested in the scientific process and the results it yields”, “I regularly talk about science with other people in my study, work or free time”, and “I think it's important that scientists communicate about their research”. All these questions are assessed using a seven-point Likert scale.
We also assessed the respondent's level of climate concern, with three questions (again on a seven-point Likert scale): “I think human influence on climate change is an important issue”, “I want to know more about climate change”, and “The influence of humans on climate change is exaggerated”. Note that, because the framing of the third question (on the exaggeration of human influence on climate) is opposite to that of the first two, the Likert score for that question is negated in the calculation of the average Climate Change Concern score.
3.6 Perceived Credibility of the authoring scientist
To assess the credibility of the authoring scientist, we ask respondents to fill out nine statements about his characteristics. The scores for these nine statements (on a seven-point Likert scale) are averaged into one construct that we call “Perceived Credibility”, following Kotcher et al. (2017) who in turn based their credibility measure on McCroskey and Teven (1999). Their original credibility measure consists of 18 statements, grouped in three factors of six statements, measuring perceived competence, integrity and goodwill of the scientist. Kotcher et al. (2017) took three statements from each factor as an adapted version of the survey: the competence of the author (whether the author is expert, competent and intelligent), the integrity of the author (whether the author is trustworthy, honest and sincere), and the goodwill of the author (whether the author is sensitive, concerned about society and cares about society).
4.1 Measures
4.1.1 Science Capital and Trust
The average Science Capital and Trust of the respondents is relatively high (Fig. 1; M=4.8; SD = 1.1), with an acceptable internal consistency (Heo et al., 2015) between the five questions (Cronbach's α=0.80). Digging a bit deeper into the demographical background of the respondents (Appendix Fig. C1), there is a strong difference (p≪0.001) in the mean score for Science Capital and Trust between education level (with respondents with a high education level scoring much higher), gender (with men scoring much higher), age group (with 25–39 scoring highest) and the political party the respondents voted on at the last election (with trust highest for left- and liberal-leaning parties).
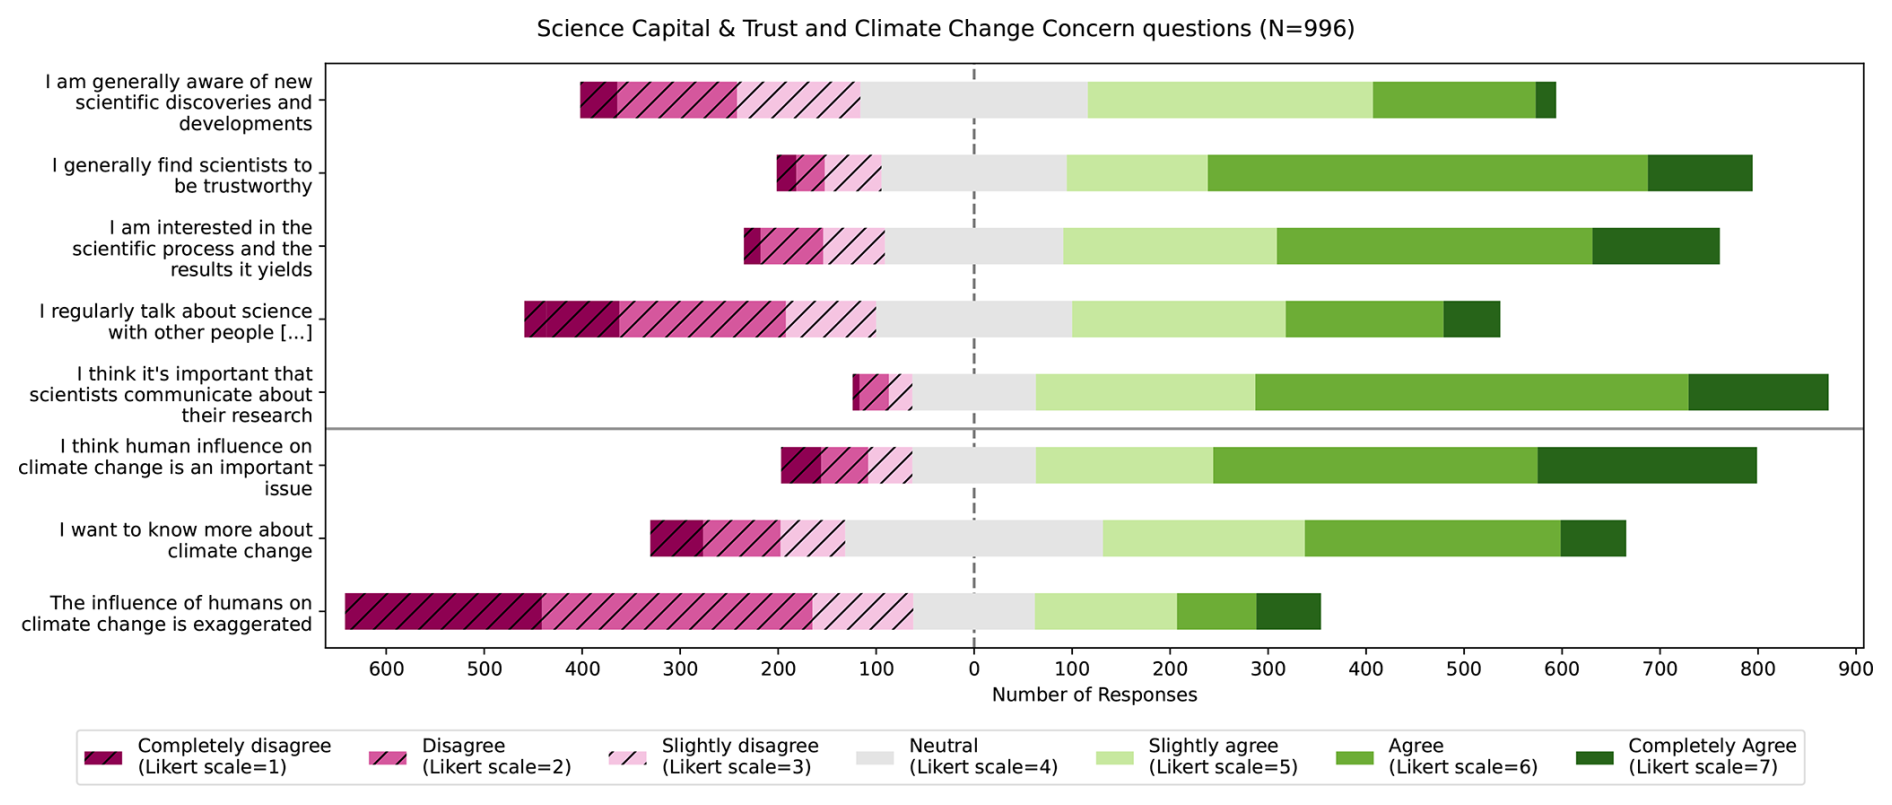
Figure 1The responses to statements on the Science Capital and Trust (top five questions) and Climate Change Concern (bottom three questions) of the respondents, assessed using a seven-point Likert scale. The responses are highly skewed towards high Science Capital and Trust and high Climate Change Concern.
4.1.2 Climate Change Concern
The average Climate Change Concern score is also high (Fig. 1; M=4.9; SD = 1.4), again with an acceptable internal consistency (Cronbach's α=0.82). Categorising the mean Climate Change Concern score by different demographic variables (Appendix Fig. C2) highlights that again there is a strong difference between education levels. The difference between gender is not significant, and there is a relatively small (but significant) difference between age groups. As expected, the difference between political party is extremely strong, with the average Climate Change Concern score for respondents who voted for right-leaning parties much lower than that score for people who voted for left-leaning parties.
4.2 Assessment of differences between conditions
To assess the degree to which our four conditions are perceived differently with respect to personalisation, the respondents are asked – immediately after reading the text – to rate the degree to which they experienced the text as professional versus personal and formal versus informal. Figure 2 shows that the Issue Advocate text is perceived as much more personal and much more informal than the Science Arbiter text; but that the difference between the Bar chart and the Photo is much smaller. The average score was relatively neutral, between 3.75 and 4.35, in the four conditions.
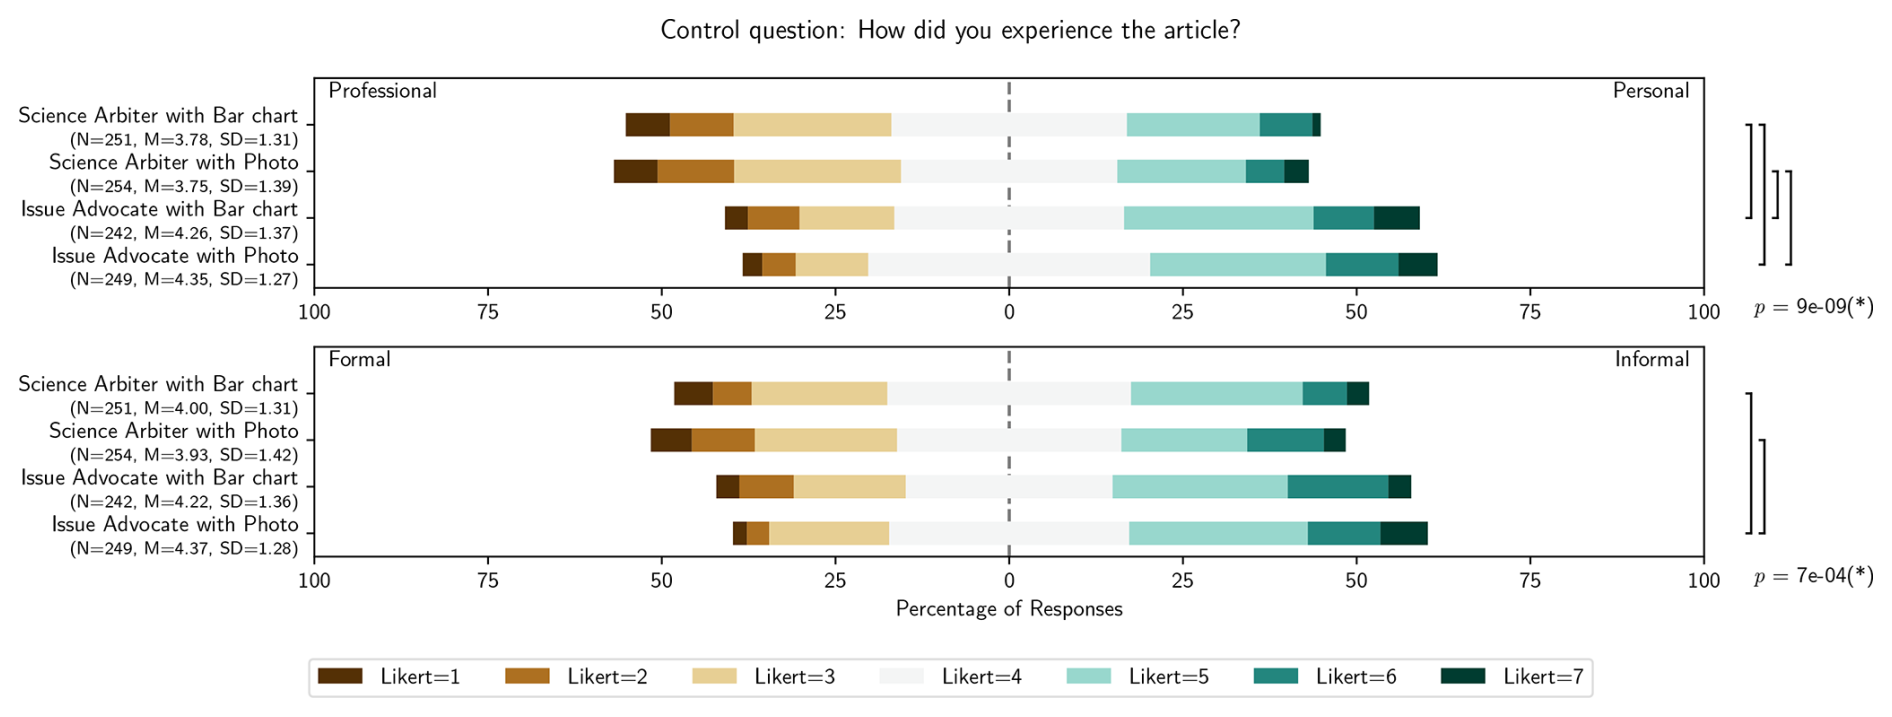
Figure 2The results of the control question: the degree to which the respondents evaluate the text as professional versus personal and formal versus informal; both on a seven-point Likert scale. ANOVA p-values are indicated on the right when p<0.05, and brackets denote categories between which post hoc tests (using the Holm correction to adjust p; Holm, 1979) indicated p<0.05.
4.3 Perceived Credibility of the authoring scientist
For all four conditions, the average Perceived Credibility is higher than five out of seven and less than 10 % of the respondents perceive the credibility as lower than three out of seven, indicating that the author is perceived as credible to very credible by a large majority of all respondents. The mean scores are between 5.1 and 5.3, with standard deviations between 0.9 and 1.0. The internal consistency of the Perceived Credibility construct in our data is high, with a Cronbach's α of 0.91.
While the mean scores for the two Issue Advocate conditions are slightly higher than those for the two Science Arbiter conditions and the overall ANOVA-test yields a significant difference (p=0.036), the differences between the four conditions are not statistically significant after using the Holm (1979) correction to adjust p. We can therefore not conclude that any of the four conditions yields a higher (or lower) Perceived Credibility than the others. However, when we combine all respondents into two groups only based on the text condition (so ignoring the visual element condition), the scores for the Issue Advocate are significantly higher than scores for the Science Arbiter texts (p=0.005). Combining the respondents into two groups based only on the visual element, on the other hand, does not yield statistically different results between the Bar chart and Photo conditions (p=0.521).
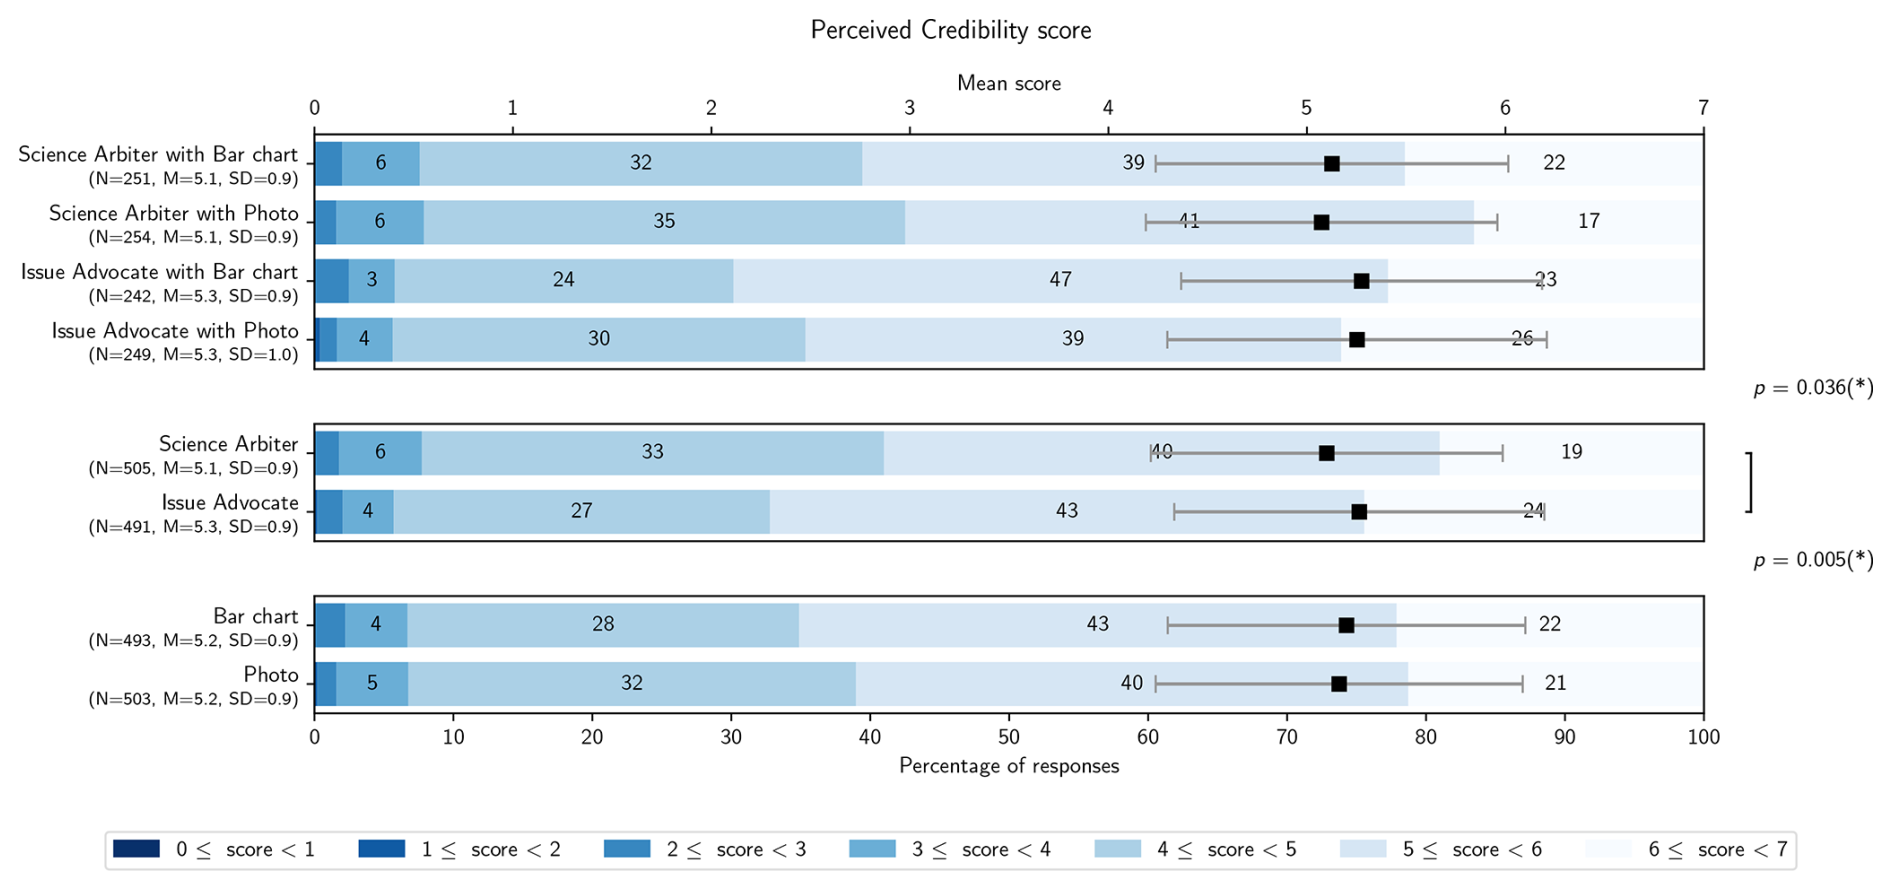
Figure 3The Perceived Credibility scores, as the average of nine statements about the author on a seven-point Likert score, for all four conditions (top), the two text conditions (middle) and the two visual conditions (bottom). The black squares give the means, with the whiskers indicating the standard deviations. The coloured sections in the bars indicate the fraction of respondents that gave a Perceived Credibility score in each of seven ranges (note that because of the averaging, the scores are not integers anymore), with the text indicating the percentages in each range. While the ANOVA p-value comparing all four conditions is significant (p<0.05), none of post hoc tests between conditions (using the Holm correction to adjust p; Holm, 1979) indicates p<0.05. The ANOVA p-value comparing only the text conditions is significant (p=0.005), but the ANOVA p-value comparing only the visual condition is not significant.
To explore the construct of the Perceived Credibility further, Fig. 4 shows the responses to the nine questions that together make up the Perceived Credibility. The respondents rate the author overwhelmingly positive on all characteristics – except perhaps for sensitivity. For five of the characteristics (sincerity, expertise, trustworthiness, competence, and care about society), there is no significant difference between the four conditions. For the other four (and especially for sensitivity) there are significant differences, and in each case the Issue Advocate texts get higher scores than the Science Arbiter texts. The effect of the visual element is much less pronounced, with no statistically significant differences between the two visual conditions within a text condition.
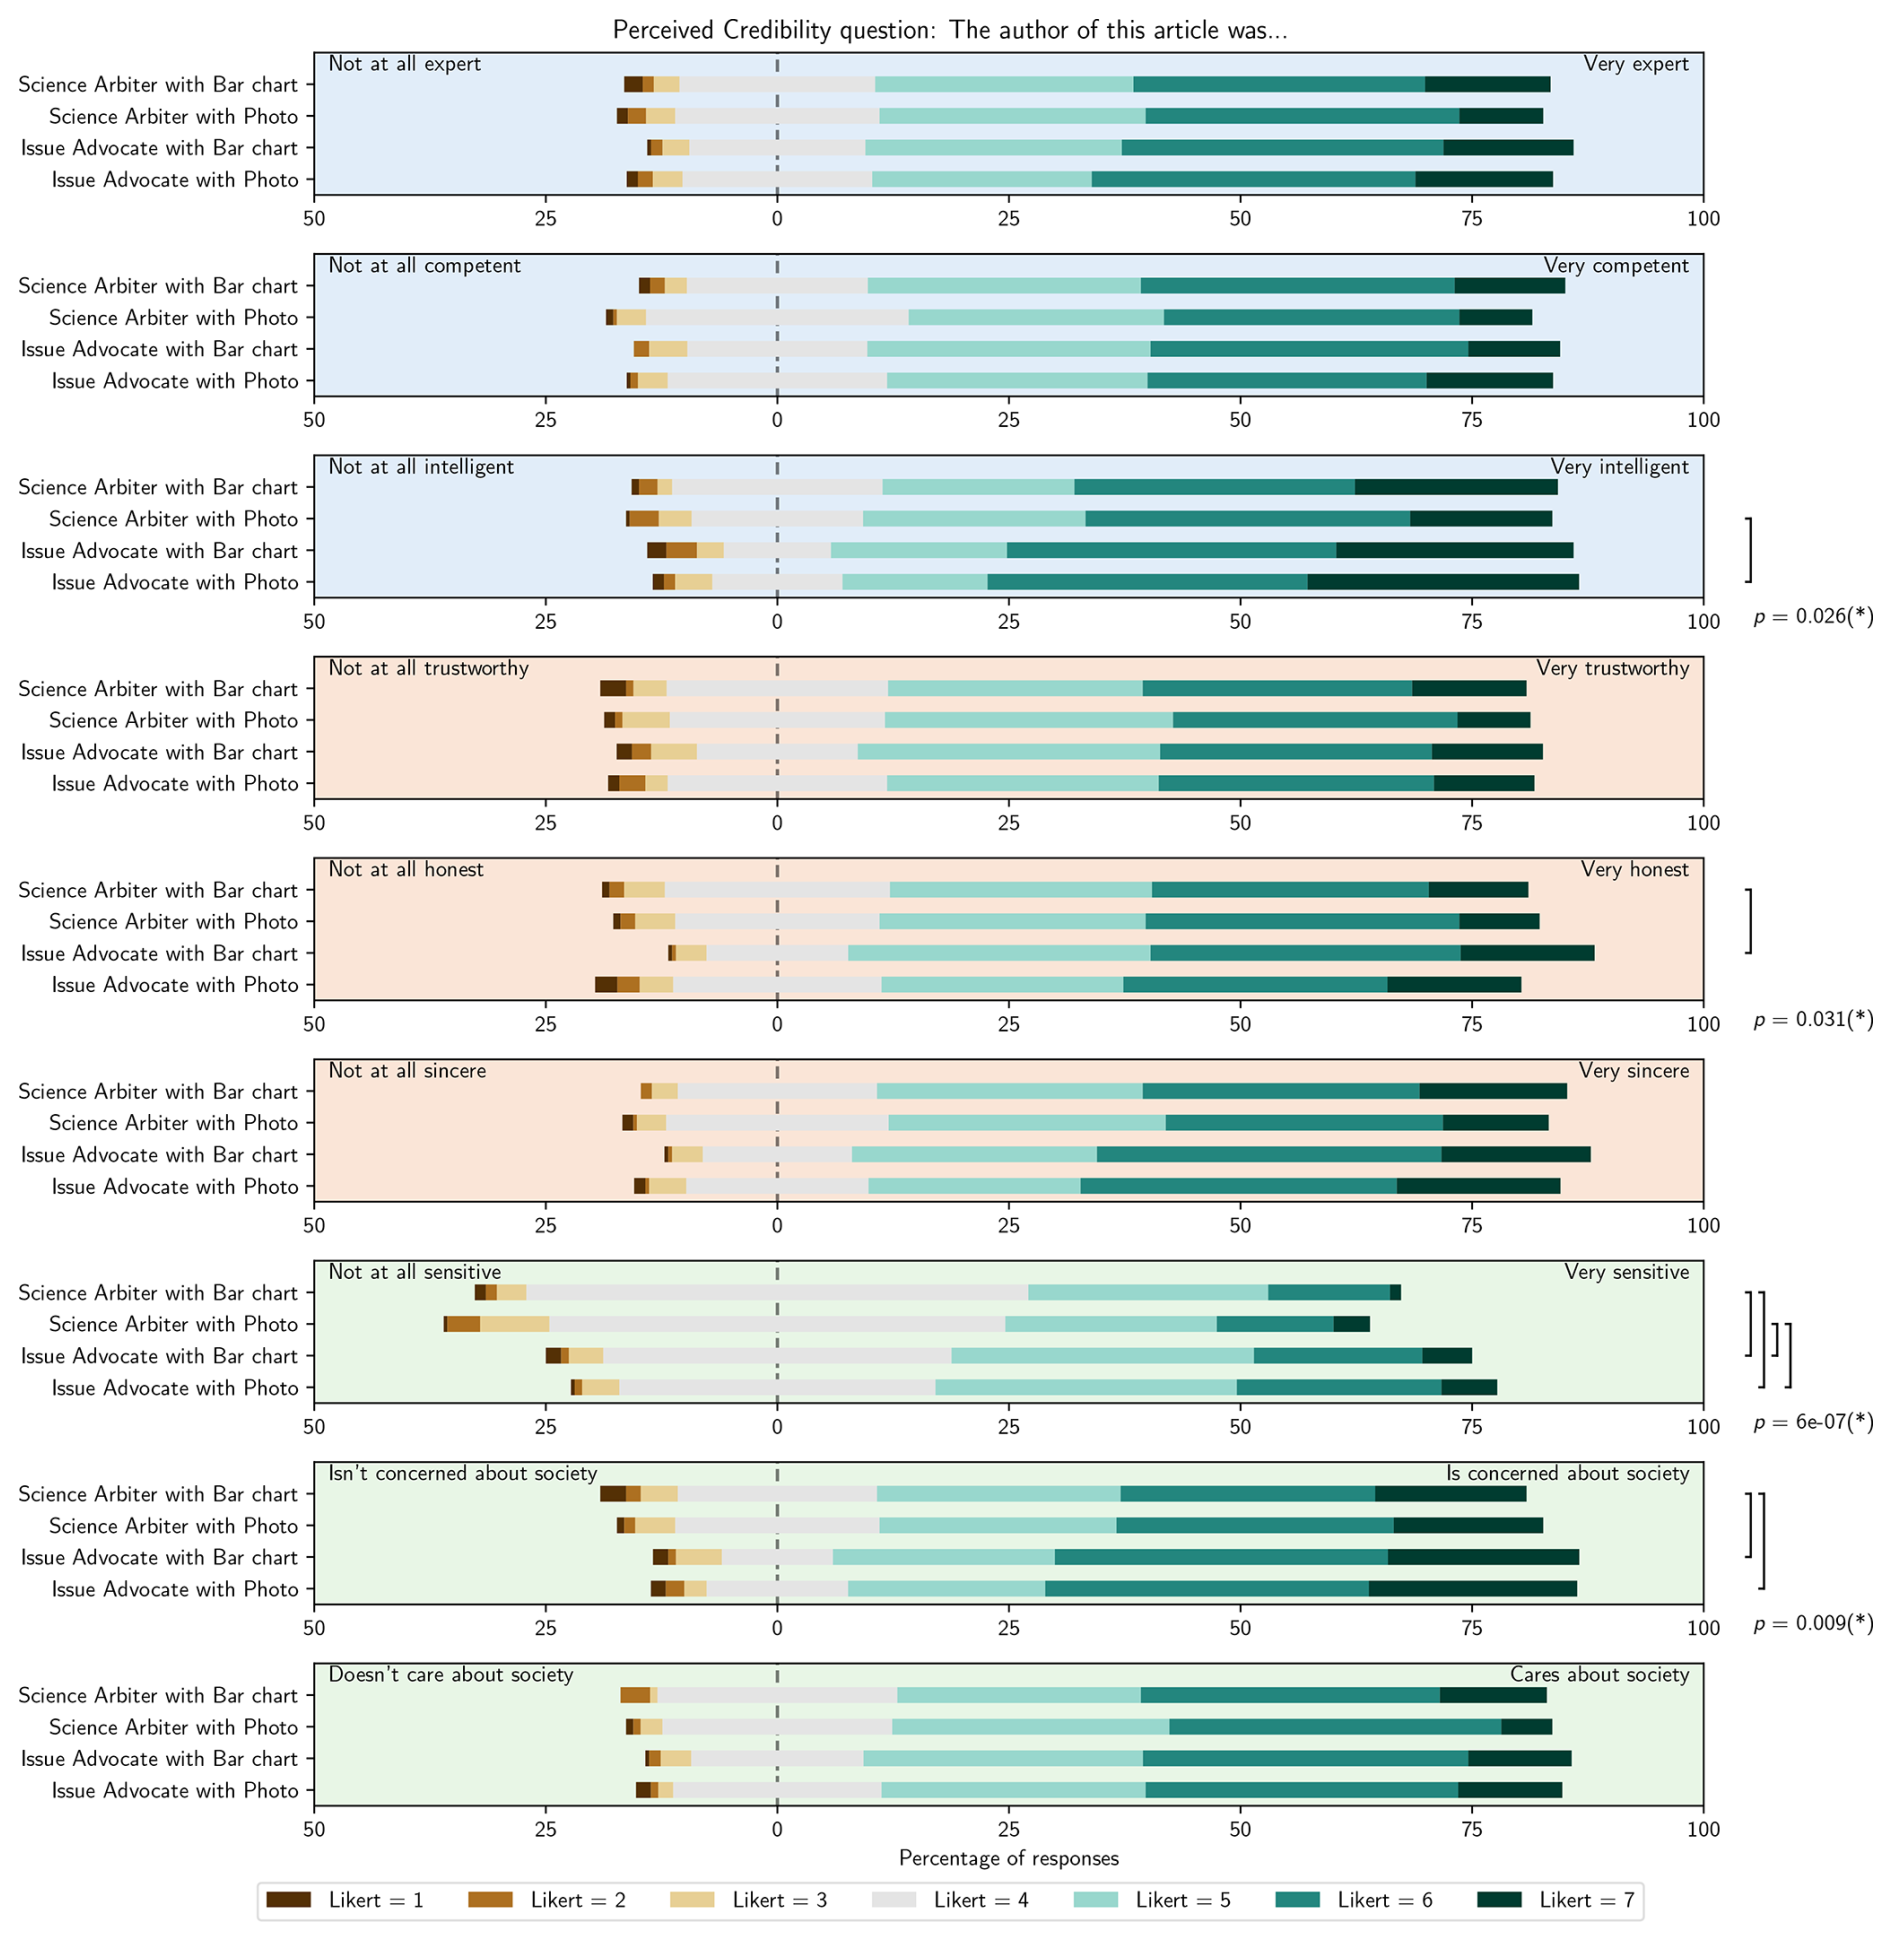
Figure 4The results of the nine statements that combine to Perceived Credibility; all on a seven-point Likert scale. The statements are grouped by the three dimensions of credibility: Competence (blue backgrounds), integrity (orange backgrounds) and goodwill (green backgrounds). ANOVA p-values are indicated on the right when p<0.05, and brackets denote categories between which post hoc tests (using the Holm correction to adjust p; Holm, 1979) indicates p<0.05.
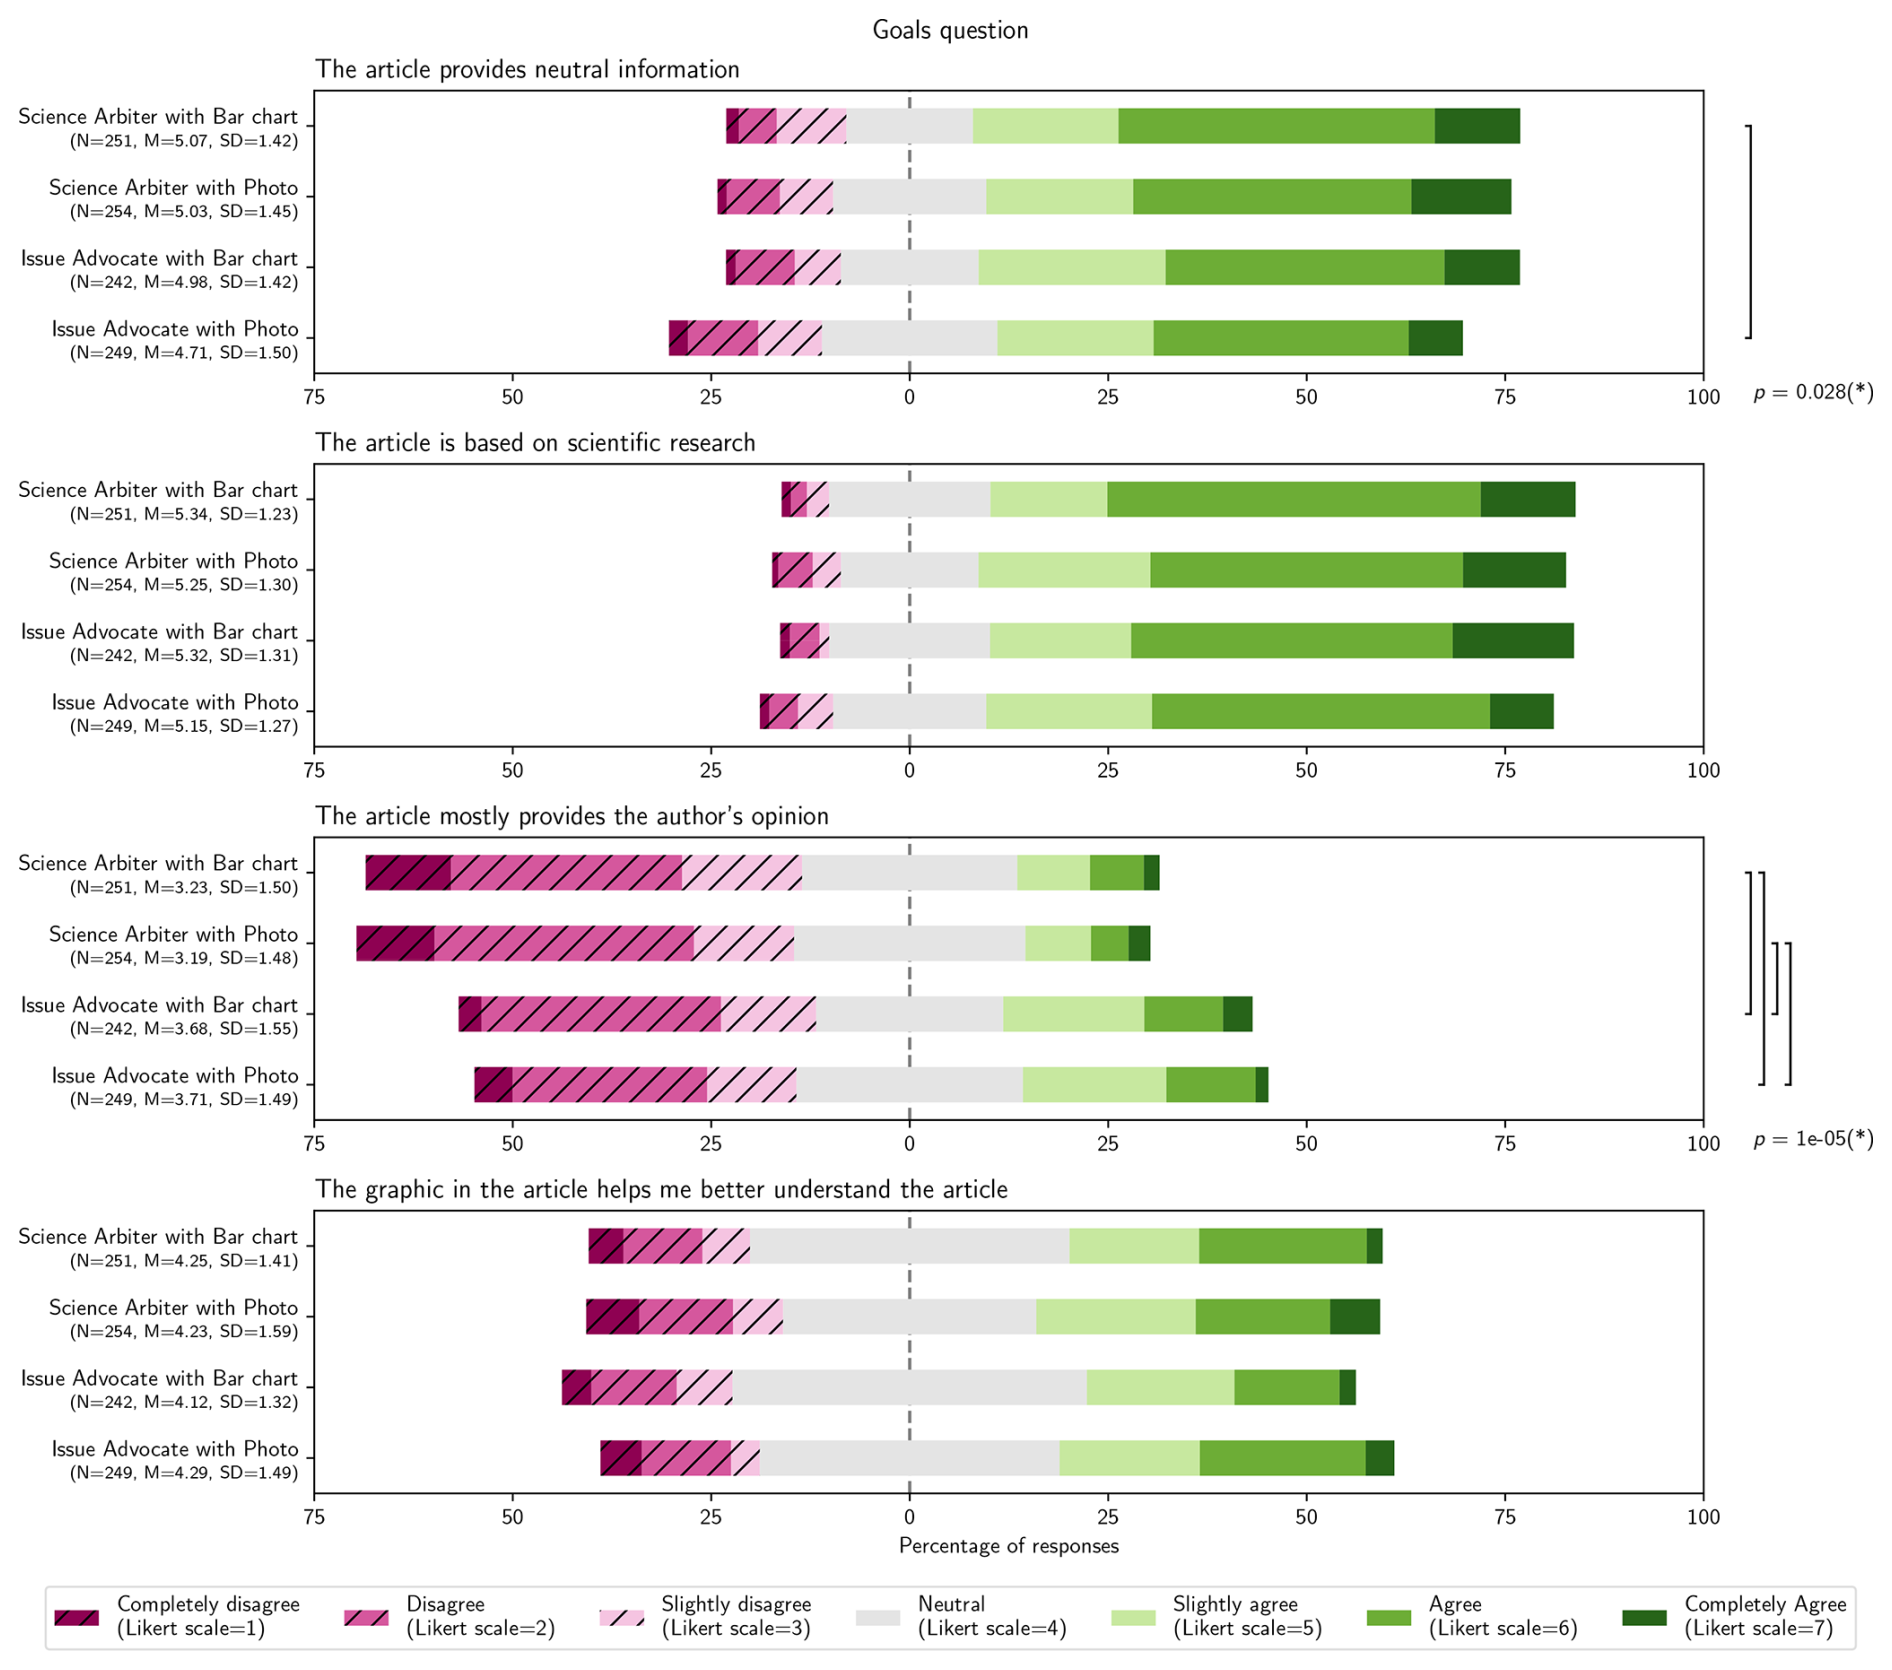
Figure 5The results of the four goals questions; all on a seven-point Likert scale. ANOVA p-values are indicated on the right when p<0.05, and brackets denote categories between which post hoc tests (using the Holm correction to adjust p; Holm, 1979) indicated p<0.05.
4.4 Goals and effect of the text
After answering the question about the credibility of the authoring scientist, respondents are asked to answer a set of four questions about the goals of the text. Figure 5 shows that most respondents find that the text provides neutral information, although the fraction of respondents that give a relatively low score for this item is significantly higher in the group that has read the condition of the Issue Advocate with Photo than in the group that has read the Science Arbiter with Bar chart condition. The second item reveals that almost all respondents feel the text is based on scientific research, and that there is no significant difference between the four conditions. There is a clear difference in the third item though, about whether the article mostly provides the author's opinion: while most respondents were neutral or did not agree with the statement, the fraction of respondent that agree with that statement is much higher in the two Issue Advocate conditions. Finally, slightly more respondents indicate that the visual element fosters understanding of the text, but this does not differ significantly between the groups that have seen the Bar chart or the Photo.
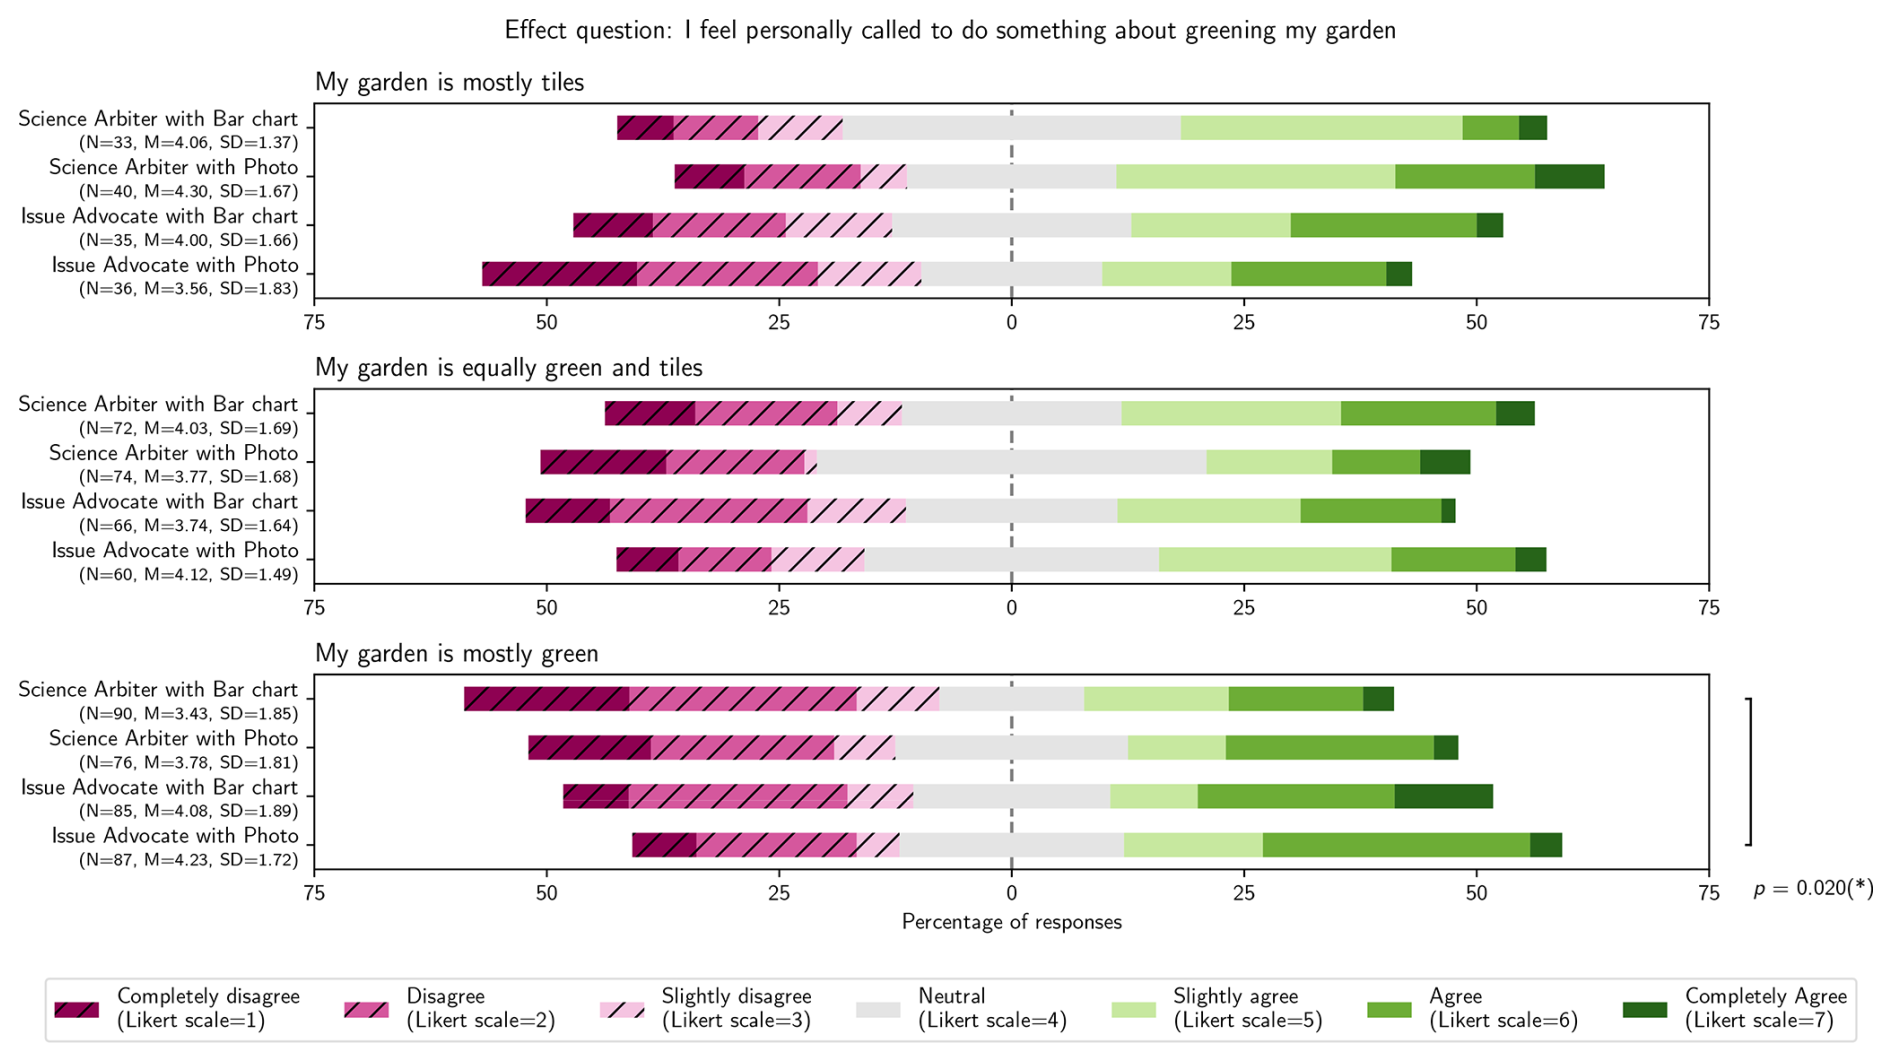
Figure 6The results of the action question; on a seven-point Likert scale. Only respondents that indicate they have a garden are asked to fill out this question, and only after we ask them to what extent their garden is green (the three categories of the subplots). ANOVA p-values are indicated on the right when p<0.05, and brackets denote categories between which post hoc tests (using the Holm correction to adjust p; Holm, 1979) indicate p<0.05.
Finally, we ask the respondents to what extent they now feel called to do something about greening their garden. Because we want to include only respondents for whom greening their garden is a realistic option, we first ask them whether they have a garden at all and, if so, to what extent that is green. This means that the number of respondents in each of these categories is much lower than the approximately 250 for the other questions. The statistical power is hence also lower, and this explains why the only (small) statistically significant difference is between respondents that have seen the Issue Advocate with Photo and the Science Arbiter with Bar chart conditions, but only for those that indicate they already have a mostly-green garden. The extent to which they can therefore further green their garden is limited.
There is also some indication that respondents with a garden that is mostly tiled (upper panel in Fig. 6) feel more called to green their garden when they read the Science Arbiter text, but the difference between the conditions is not statistically significant, even when the two types of visual elements are lumped together.
The goal of this study is to evaluate whether advocacy in texts about climate change impacts and solutions influences the credibility of the authoring scientist as perceived by the public. We evaluate possible differences between two conditions, based on Pielke's (2007) Science Arbiter and Issue Advocate roles, using an online survey.
5.1 Validity of text conversion and credibility measure
Our results indicate that adding advocating elements does not undermine the (perceived) scientific underpinning of the text, which is a core objective for KlimaatHelpdesk (Stichting KlimaatHelpdesk, 2023a). These results also show that whether a text is perceived to be shaped by personal views of the author, and whether it is perceived to be based on scientific evidence, are not mutually exclusive in the sense that a text can be both scientifically underpinned and shaped by personal views.
As an alternate view, the distribution of answers to the statement about the text being shaped by personal views (third panel of Fig. 5) is notably more widespread than the distribution of answers to the statements about the article providing neutral information and being based on scientific research (first two panels of Fig. 5). Although the difference between the conditions is perceived as intended, less than 40 % of the respondents agree that the text is shaped on personal views even in the Issue Advocate condition. Similar results were found by Leerink et al. (2024), who included a condition with a “highly personalized” text, which was considered to be based on personal views by only around 50 % of respondents in that condition. This means that either the converted text could have been manipulated even more strongly to have respondents perceive it as shaped by personal views more strongly, or that a text that is perceived as being very much based on scientific evidence is inherently not seen as very much based on personal views. In that sense, maybe the two are mutually exclusive. Future research may investigate this dynamic by experimenting with extremer manipulations in the levels of scientific underpinning and shaping by personal views and testing different combinations.
5.2 Findings
The first research question in this project is as follows: How does a text written in the Issue Advocate role versus the Science Arbiter role affect the credibility of the writing scientist? Looking at the credibility measure, Perceived Credibility of the author increases by including a level of advocacy (Issue Advocate) as opposed to a text written in a neutral tone (Science Arbiter) when we neglect the visual element condition. These outcomes are in line with previous research (Cologna et al., 2021; Kotcher et al., 2017).
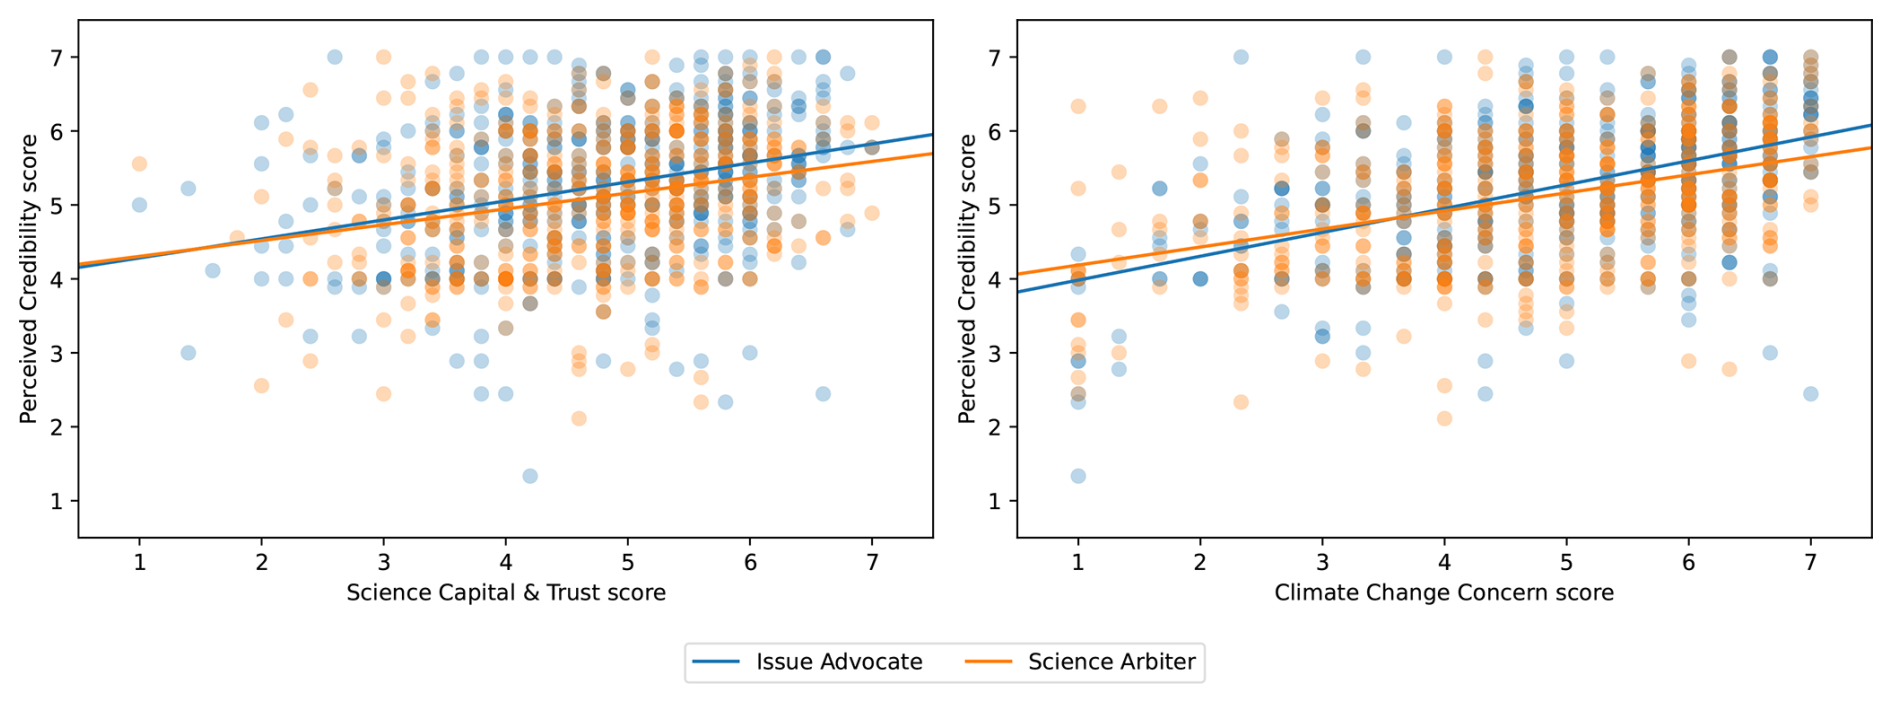
Figure 7Scatter plots of the relation between the Science Capital and Trust (left) and Climate Change Concern (right) scores and the Perceived Credibility score, for each of the respondents, coloured by the text condition that they read (orange for Science Arbiter and blue for Issue Advocate). Lines give best fits through each of the data sets for the two text conditions.
Notably, the confidence interval on the mean credibility is quite large (SD = 0.89 for Science Arbiter and SD = 0.93 for Issue Advocate), which might reflect polarization in the climate change debate (Donner, 2014; Post and Bienzeisler, 2024). To confirm whether this polarization appears in our data, we combined the pretest scores of Fig. 1 with the Perceived Credibility scores of Fig. 3. As shown in Fig. 7, the best-line fits are steeper for the Issue advocate texts than for the Science Arbiter texts.
Performing an Ordinary Least Squares regression fit on the data in Figure 7 reveals that the interaction term between Perceived Credibility and Science Capital and Trust are not significant (p=0.401) but that the interaction term between Perceived Credibility and Climate Change Concern is significant (p=0.029), indicating that the steepness of the two lines in the right panel are significantly different. This suggests a (small) polarising effect of the Issue Advocate condition, where respondents with a relatively low Climate Change Concern score perceive the credibility of the author relatively lower in the Issue Advocate text than in the Science Arbiter text, while respondents with a relatively high Climate Change Concern score perceive the credibility of the author relatively higher in the Issue Advocate text than in the Science Arbiter text. Note that this small effect does not necessarily imply a causal relation between level of activism and polarisation; it could for example also be that the response is reactionary to the theme. Furthermore, there could also be some confirmation bias where respondents with high Climate Change Concern would rate the advocating author as more credible, and vice versa.
In line with the results we find here, previous studies found that credibility of scientists is increased when they are perceived to promote the well-being of others (Capstick et al., 2022) and when they are perceived to act in the interest of society (Cologna et al., 2021). Higher scores on the goodwill domain may also indicate that the Perceived Credibility of the author can increase when readers are convinced that the author has a personal passion for the topic and therefore acts sustainably themself. Such results were found by Attari et al. (2016), who showed that a scientist's perceived credibility is greatly reduced when the carbon footprint of the scientist themselves is (allegedly) high. They furthermore found that such a high footprint can strongly affect both the readers' intentions in changing personal energy consumption (Attari et al., 2016) as well as the readers' support for policies that the scientist advocates (Attari et al., 2019) in negative ways. Attari et al. (2016) conclude that scientists receive support when they “practice what they preach”. In our Issue Advocacy text, this is the acknowledgement of the authoring scientist that he had removed the tiles from his own garden. This effect of personal behaviours of the scientist on their credibility is also found to be something that some scientists themselves worry about and which keeps them from engaging in advocacy, because they feel their own carbon footprint is too high (Dablander et al., 2024).
Furthermore, the changes in the Issue Advocate version of text have also increased the narrativity of the text, which may also have helped increase the Perceived Credibility. Yang and Hobbs (2020) showed that a text about gene editing was found more credible when it had a higher degree of narrativity. Figure 2 shows that the Issue Advocate texts are much more personal, and following Leerink et al. (2024), a text with more personalisation is more interesting to read.
The effect of visual element on the Perceived Credibility is low. The answer to our second Research Question (“How does a visual element that shows scientific data affect the credibility of the author, compared to a more general stock photo”) is that there is no statistical difference between the two. Our second hypothesis is therefore rejected. Although past research showed potentially beneficial effects of various types of visuals in both science communication in general and climate communication specifically, we did not find big effects, nor differences between the two types of visuals.
It may be that our photograph was not of sufficient quality (see Zhu et al., 2021, on the importance of high-quality photographs to affect affective and cognitive aspects of communication), or that our source attribution for the visuals was not sufficiently clear (see Li et al., 2018, on how source attribution may serve as a peripheral cue). It may also be that both types of visuals used in our experiment were missing people (see León et al., 2022, on the importance of showing “real” people or impacts or actions by people who are directly affected). Although we purposefully did not include people in our visuals to prevent potential indirect effects due cultural, political, or stereotypical effects, this may have invertedly also limited their effectiveness. It may also be that perceived credibility did not differ across the types of visuals because both types can be congruent with the central message conveyed in the text. Recent research on text-visual congruency shows mixed results (see for example Mosallaei and Feldman (2024) and O'Neill et al. (2023) on how perceived congruency may affect information processing).
5.3 Limitations
The data on the Perceived Credibility measure reveals a ceiling effect, especially in the distribution plots of the individual statements (Fig. 4): nearly all statements show a strong left-skewness, with a substantial number of answers in the extreme on the right (positive characteristics of the scientist) and close to none on the left (negative characteristics). The same dynamic shows in the distribution of the average perceived credibility for each respondent (Fig. 3). This ceiling effect may be partly due to the non-controversial nature of greening of gardens, or that mostly people enthusiastic about gardening accepted the invitation to the survey. As also found by Kotcher et al. (2017), advocacy on more controversial topics – such as nuclear energy in their case – may decrease the perceived credibility of a scientist. It would thus be interesting to repeat our study with a text on a more controversial topic.
On the other hand, the authoring scientist offers a recommendation in the Issue Advocate text outside their immediate field of expertise (“I think that financial aid, for example, can persuade people who want to green their gardens but have not yet done so”), which in hindsight might reduce the credibility of the author. Furthermore, we cannot directly link the authoring scientist's perceived credibility to that of scientists in general. Even though all texts started with a byline stating that the author of the text was “Prof. Ben van Weel (Utrecht University) – Professor of Ecology and Climate”, we did not explicitly ask whether the author was perceived as a scientist, so do not know to what extent the respondents have appreciated that the author himself was a scientist.
Since we didn't track the respondents over longer times, we do not know what the longer-term effects of our text has been. Given that the immediate effect of our intervention was already relatively small, we can imagine that the long-term effects (weeks to years) of one such intervention would be very small. On the other hand, many in the public are repeatedly exposed to climate scientist's advice or insight on society, so it could be that a continuously increased level of activism by all climate scientists would increase the perceived credibility of climate change on the long term; something to be further explored in follow-up studies.
Finally, the survey done here is an isolated event, performed within a panel that does regular surveys, and is in that sense a lab setting, even though we used realistic stimulus material based on an existing website. The results in such lab settings may not necessarily be translated to real-world situations, which means that additional field studies would be valuable (Grzyb and Dolinski, 2021).
5.4 Implications and future research
The results of this study are in line with previous research (Cologna et al., 2021; Kotcher et al., 2017), indicating that scientists can engage in advocacy without losing credibility and may even experience an increase in Perceived Credibility in the goodwill domain. Given the large number of scientists willing to advocate, but one of the concerns being this possible loss of credibility (Dablander et al., 2024), our results may empower willing scientists to take the next step and start speaking out on issues they find important. Advocacy could thus provide scientists with an outlet for what they are passionate about or feel strong urgency about. If advocacy can indeed inspire both individual behaviour change as well as influence policy making, their speaking out may also contribute to the dealing with climate change on a grander scale.
However, whether scientists' advocacy indeed has such effects is still an understudied topic (Wijnen et al., 2024), although some previous research can give a direction for future research. Still, these studies focused more on the effect of the (perceived) behaviour of the author than the implications of advocacy by the author. This highlights the need of research into the effect of advocacy on individual intended and actualized behaviour. In particular, one could extend our experiment by exposing participants first to a Science Arbiter-style text, followed by an Issue Advocate-style text, to explore the complementarity of the different approaches to science communication (Pielke, 2007, p. 7). Furthermore, one could investigate whether an Issue Advocate text by a scientist with a feminine name would have the same response, as there are studies that show how the general public associate scientists with men (e.g., Suldovsky et al., 2019). In addition, as advocacy may also aim to influence policy-making, it is also relevant to study to which extent scientists' advocacy can have an influence on governmental or organizational levels.
Below is a translated version of the text used in this study. Lines that were only included in the Issue Advocate version are italic.
Removing all tiles from Dutch gardens is good for climate
By Prof. Ben van Weel (Utrecht University) – Professor of Ecology and Climate
I recently removed all the tiles from my garden. The design of gardens has an effect on the climate in a city. Trees, grass and ponds are all more effective in lowering the temperature than tiles. If all gardens were completely greened, it would be about 0.5 °C cooler in large cities; that is a lot. In addition, green gardens reduce other climate problems such as flooding and drought. So my message to everyone is: get rid of those garden tiles!
Our research shows that it can be about 2 °C warmer in Dutch cities at night than in the surrounding countryside. On very hot days, it can even be 5 °C warmer. We have discovered that 10 % more green surface in the city can lower the air temperature by about 0.5 °C (see figures in Appendix B). Gardens with a lot of greenery and few tiles contribute to this.
At the moment, there is no national policy to green gardens. While other research shows that Dutch city gardens consist of an average of 36 % vegetation. But that percentage varies greatly between cities. Based on the measurements, we can estimate that the temperature in some cities can drop by half a degree if all city gardens are greened.
As a scientist, I believe that the government should use this knowledge to steer more towards greening gardens. I think that financial aid, for example, can persuade people who want to green their gardens but have not yet done so.
Effect on reducing climate problems
A green garden can also contribute to reducing climate problems such as flooding. The soil in greener gardens can retain more rainwater than the tiles in gardens with more stones, which means that less water flows off into the sewer. Research in a district in Utrecht shows that 15 % more green area in the garden can ensure 24 % less water drainage into the sewer.
Green gardens also help to reduce drought. For example, a “wadi” in the garden can collect rainwater for longer, which means that more groundwater is replenished. The garden needs that groundwater during long dry periods to stay alive. That is why I also built a wadi myself.
Calculating the precise impact of climate policy is difficult. But all in all, research shows that greening gardens is an easy way to reduce the effects of the climate crisis in Dutch cities.
Below are the two translated visual elements used (the bar chart and the photo), and their caption.
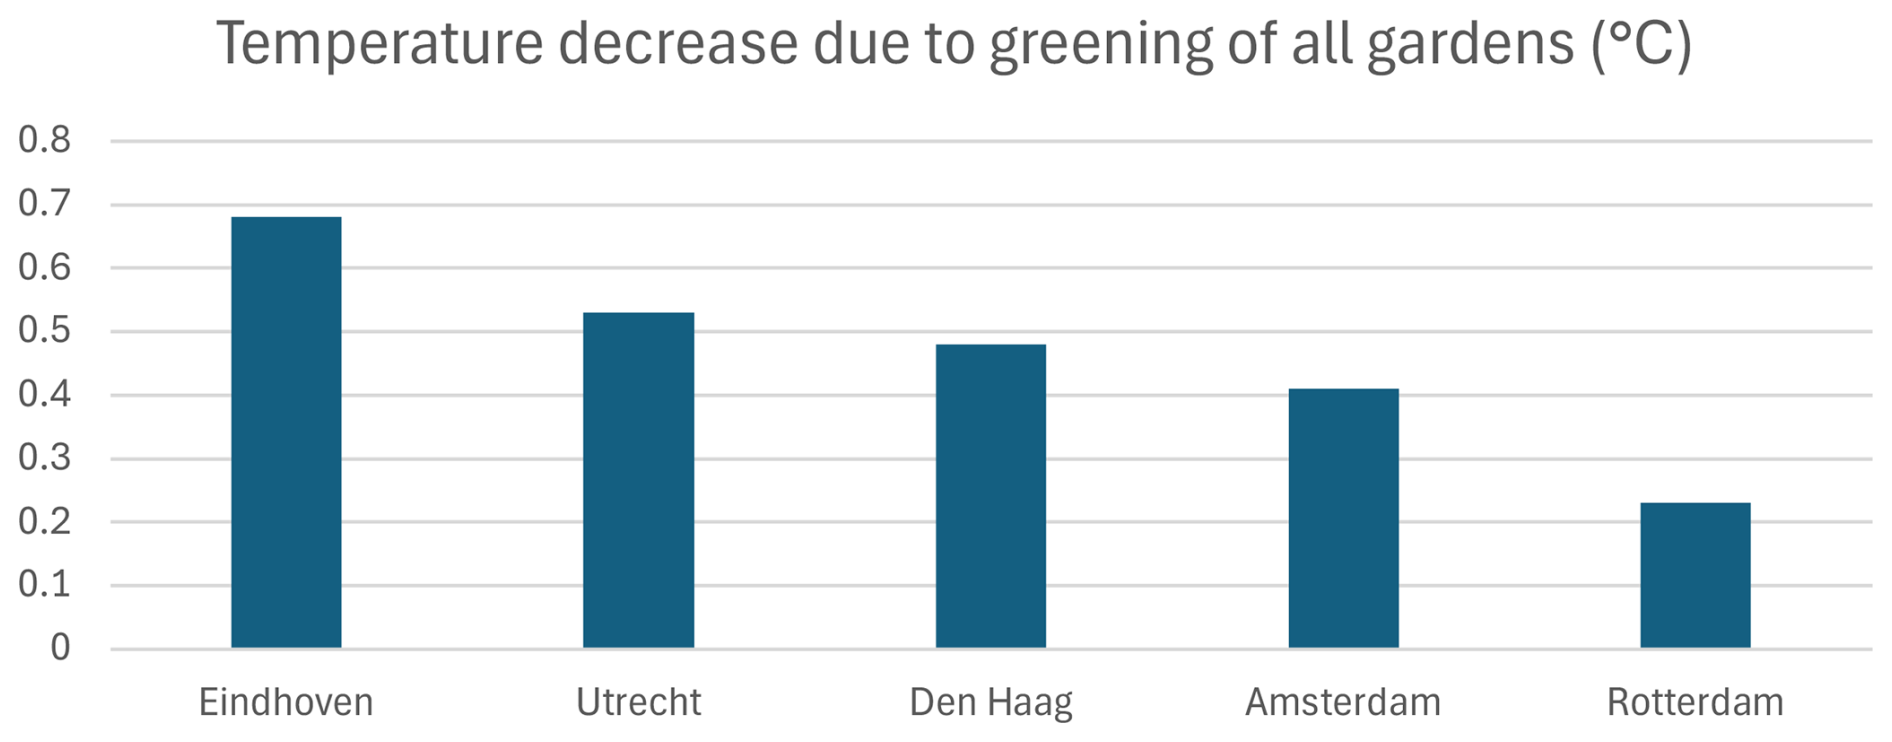
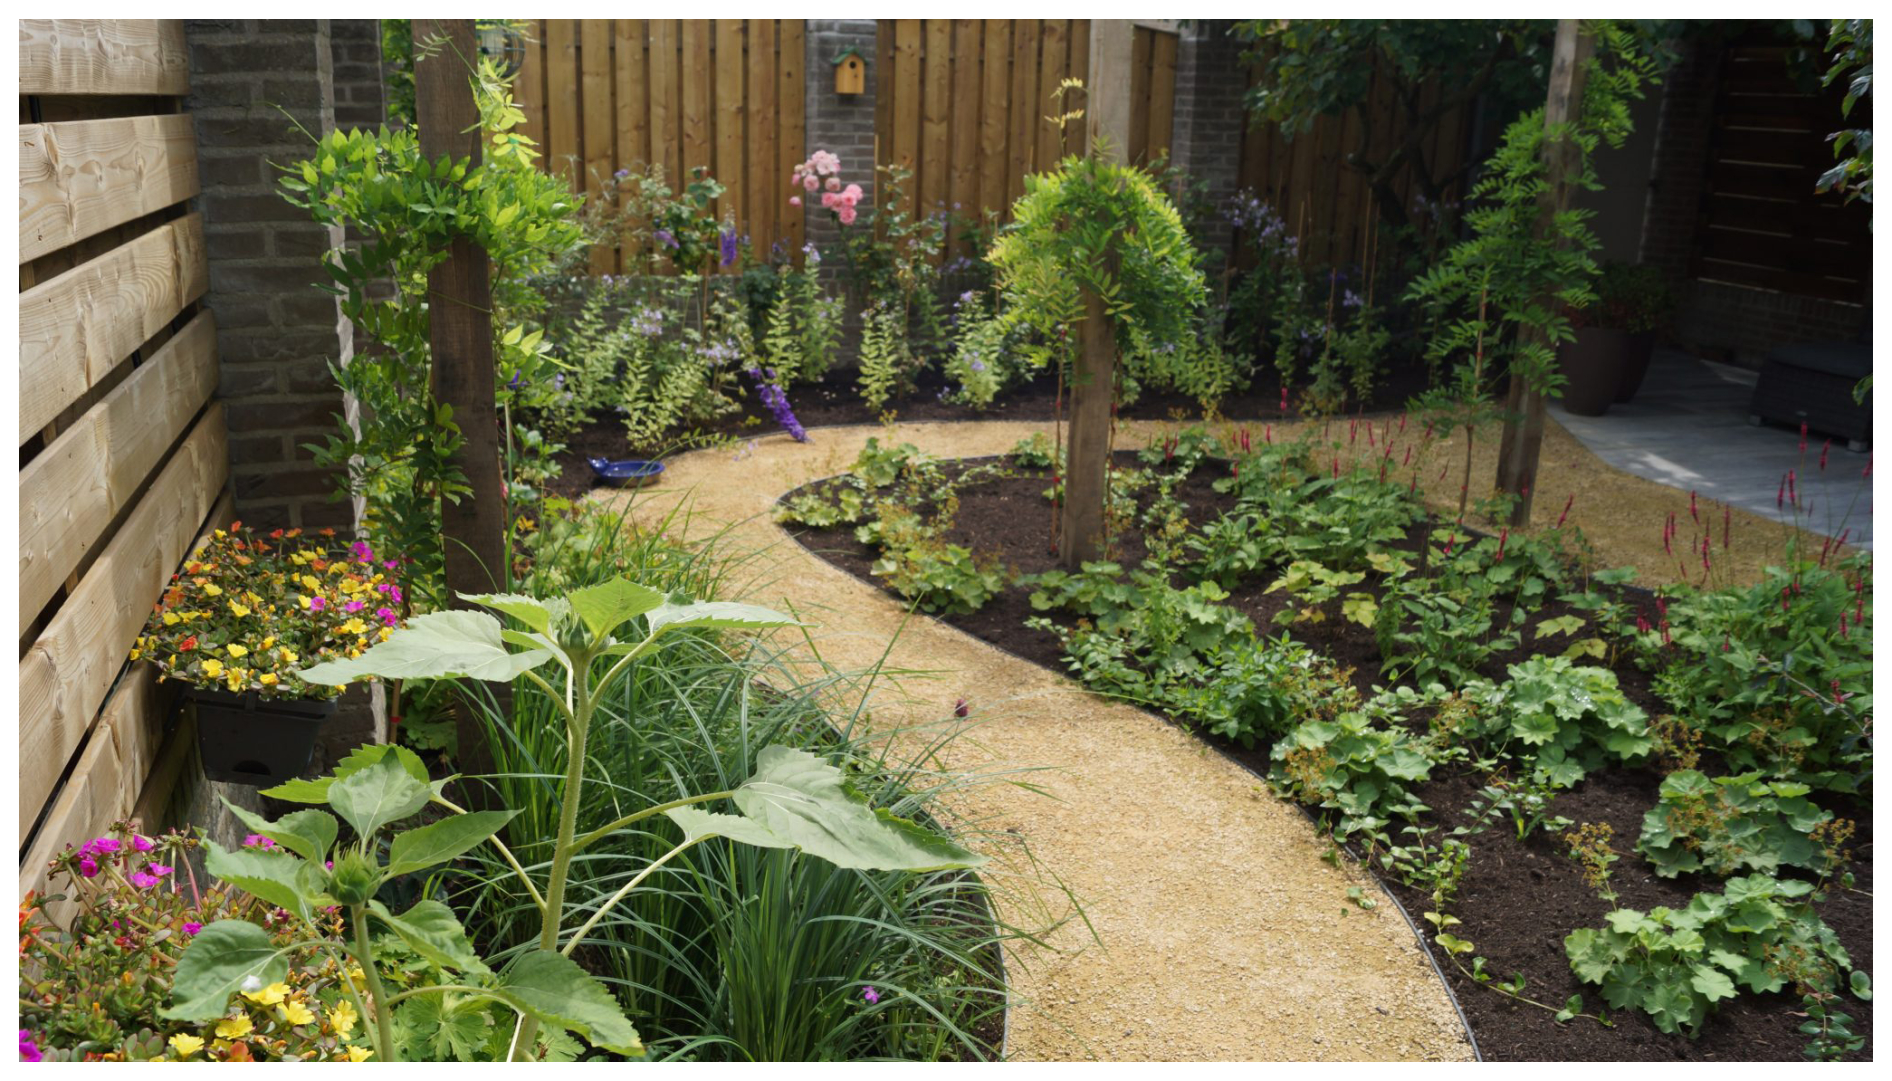
Figure B2A garden with a landscaped wadi.
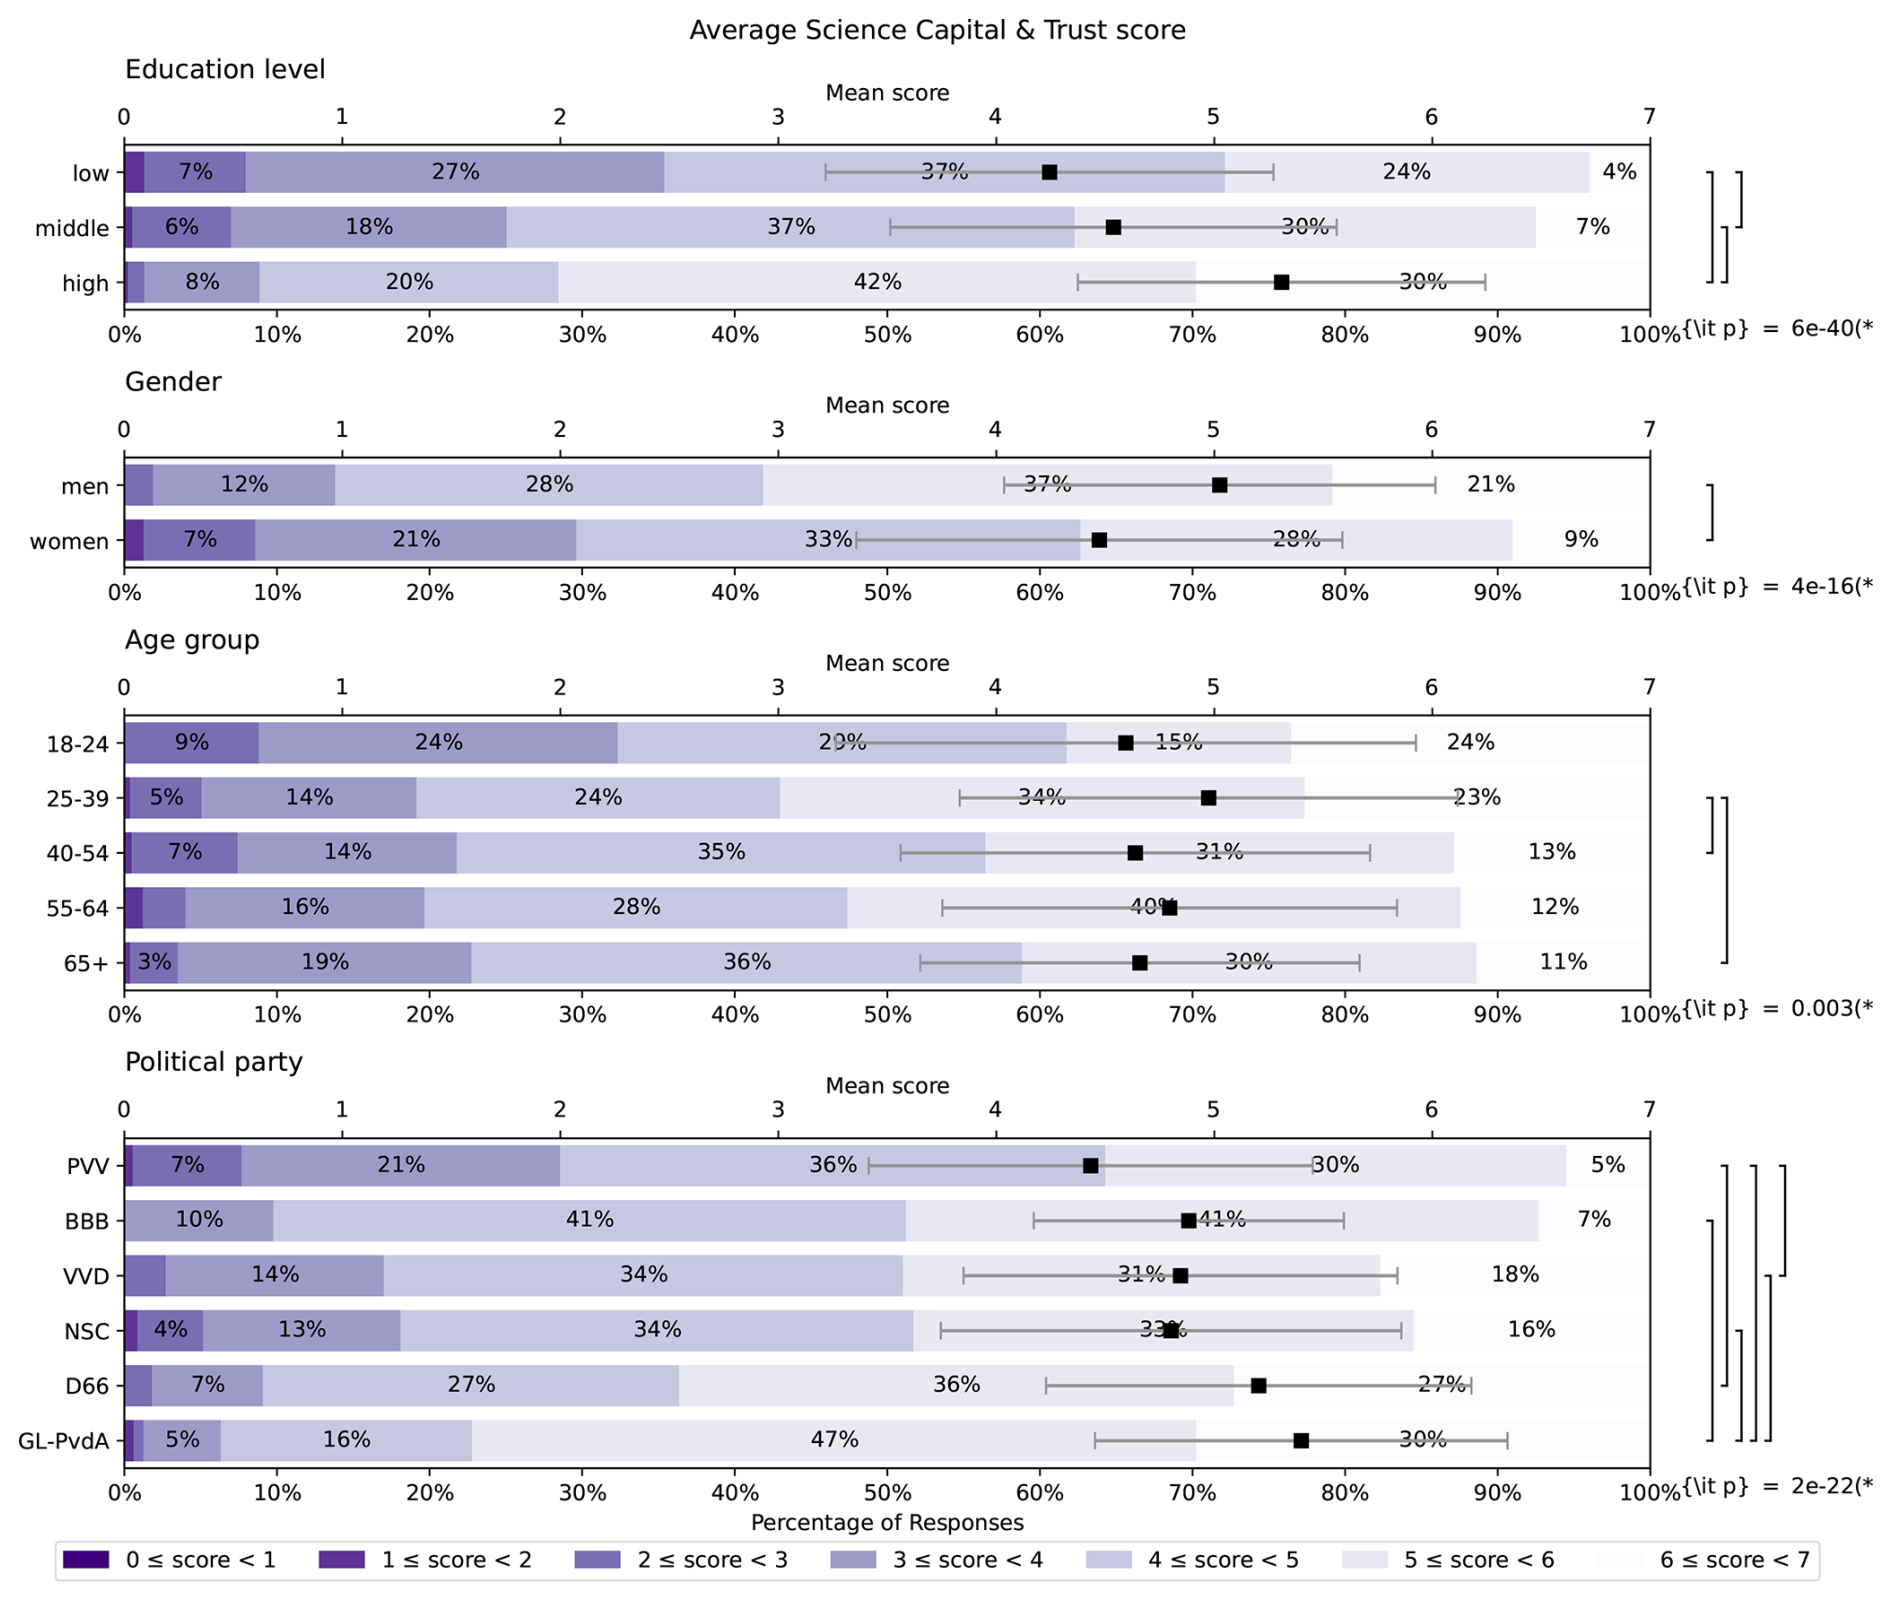
Figure C1The mean Science Capital and Trust score of the respondents, separated by some of their demographic information. The political parties have roughly been ordered from right-leaning (top) to left-leaning (bottom). ANOVA p-values are indicated on the right when p<0.05, and brackets denote categories between which post hoc tests then indicate p<0.05.
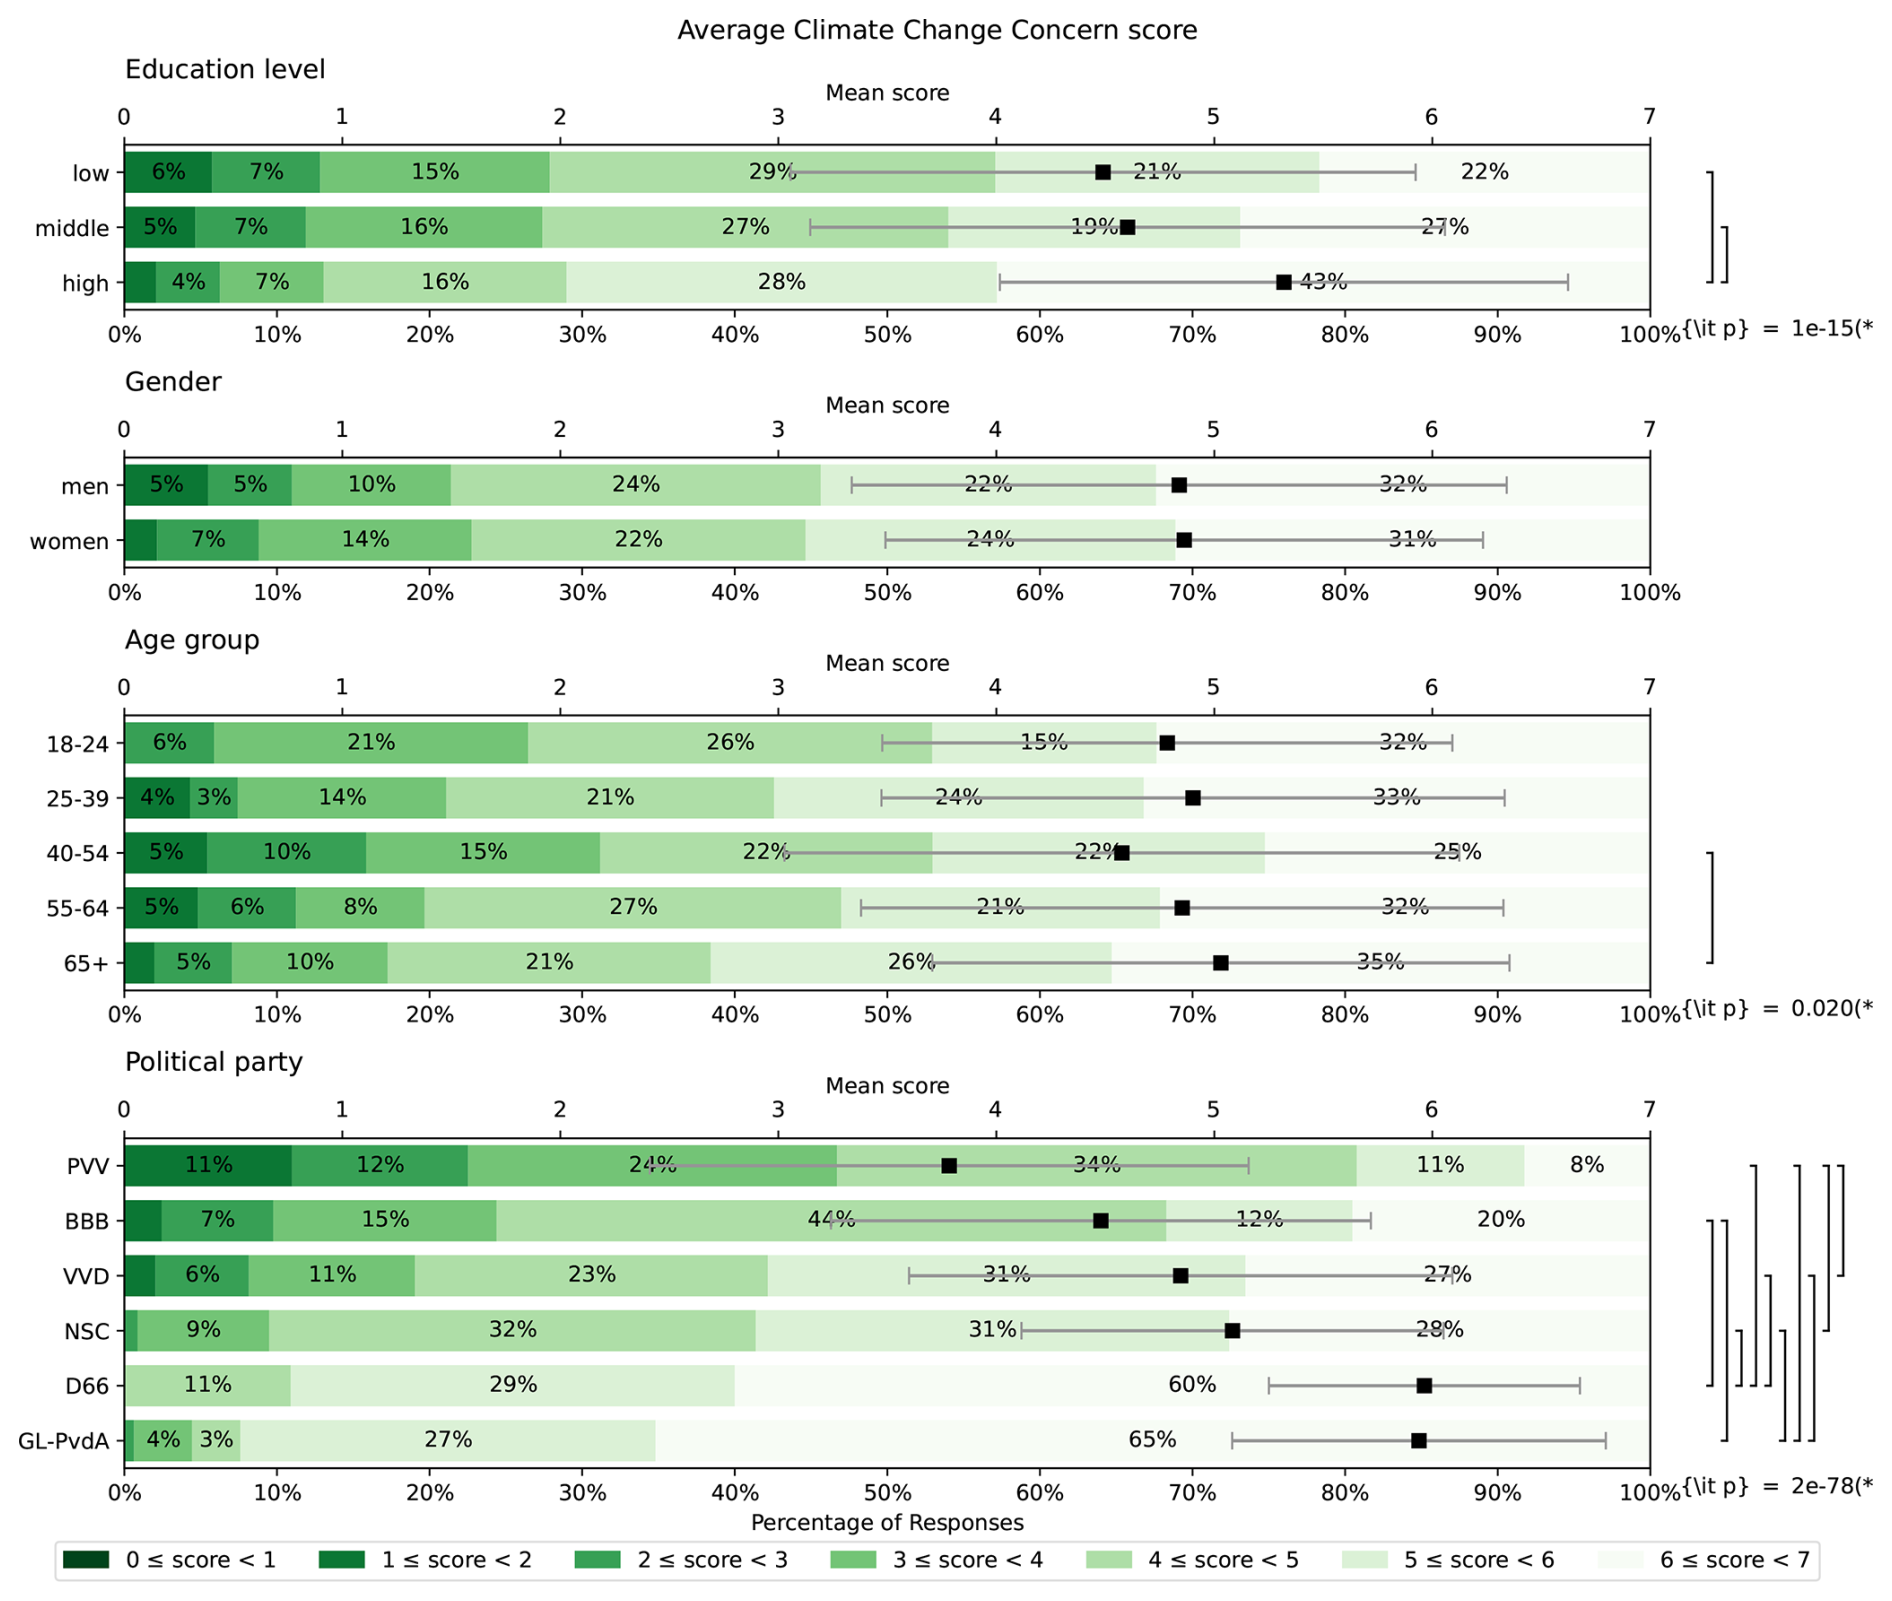
Figure C2The mean Climate Change Concern score of the respondents, separated by some of their demographic information. The political parties have roughly been ordered from right-leaning (top) to left-leaning (bottom). ANOVA p-values are indicated on the right when p<0.05, and brackets denote categories between which post hoc tests (using the Holm correction to adjust p; Holm, 1979) then indicate p<0.05.
The stacked bar graph plots were made using the plot_likert library, distributed under a BSD-3 license at https://github.com/nmalkin/plot-likert/ (nmalkin, 2026). In the spirit of Open Science, all data and scripts used for the manuscript are available at https://doi.org/10.5281/zenodo.15755647 (van Sebille, 2025).
EvS designed the survey, analyzed the data from the survey and wrote the draft of the manuscript. CW designed the first pilot of the survey and wrote a thesis version of the manuscript. All authors designed the study and edited the manuscript.
EvS is an ambassador for the KlimaatHelpdesk.
The research proposal and protocol for this study was approved by Utrecht University's Science-Geo Ethics Review Board (ERB Review Science-24-0139) on 20 December 2024.
Publisher's note: Copernicus Publications remains neutral with regard to jurisdictional claims made in the text, published maps, institutional affiliations, or any other geographical representation in this paper. The authors bear the ultimate responsibility for providing appropriate place names. Views expressed in the text are those of the authors and do not necessarily reflect the views of the publisher.
Funding for this project was provided through an Agnites Vrolik Award by the Utrecht University Fund. We thank Thijs Beirnaert from De Knoest Tuinen in Tilburg for permission to use his photograph of the wadi.
This research has been supported by the Universiteit Utrecht (Agnites Vrolik Award). EvS was supported by the SUMMIT program of the Dutch Research Council (NWO) through the EMBRACER program, the Earth System Feedback Research Centre.
This paper was edited by Stephany Mazon and reviewed by two anonymous referees.
Attari, S. Z., Krantz, D. H., and Weber, E. U.: Statements about climate researchers' carbon footprints affect their credibility and the impact of their advice, Climatic Change, 138, 325–338, https://doi.org/10.1007/s10584-016-1713-2, 2016.
Attari, S. Z., Krantz, D. H., and Weber, E. U.: Climate change communicators' carbon footprints affect their audience's policy support, Climatic Change, 154, 529–545, https://doi.org/10.1007/s10584-019-02463-0, 2019.
Beall, L., Myers, T. A., Kotcher, J. E., Vraga, E. K., and Maibach, E. W.: Controversy matters: Impacts of topic and solution controversy on the perceived credibility of a scientist who advocates, PLOS ONE, 12, e0187511, https://doi.org/10.1371/journal.pone.0187511, 2017.
Besley, J. and Dudo, A.: Scientists' Views about Public Engagement and Science Communication in the Context of Climate Change, in: Oxford Research Encyclopedia of Climate Science, Oxford University Press, https://doi.org/10.1093/acrefore/9780190228620.013.380, 2017.
Borah, P.: Comparing Visual Framing in Newspapers: Hurricane Katrina versus Tsunami, Newspaper Research Journal, 30, 50–57, https://doi.org/10.1177/073953290903000106, 2009.
Büntgen, U.: The importance of distinguishing climate science from climate activism, npj Clim. Action, 3, 1–2, https://doi.org/10.1038/s44168-024-00126-0, 2024.
Cairo, A.: How charts lie: getting smarter about visual information, F1st Edn., W. W. Norton & Company, New York, ISBN 9780393358421, 2019.
Capstick, S., Thierry, A., Cox, E., Berglund, O., Westlake, S., and Steinberger, J. K.: Civil disobedience by scientists helps press for urgent climate action, Nat. Clim. Chang., 12, 773–774, https://doi.org/10.1038/s41558-022-01461-y, 2022.
Cologna, V., Knutti, R., Oreskes, N., and Siegrist, M.: Majority of German citizens, US citizens and climate scientists support policy advocacy by climate researchers and expect greater political engagement, Environ. Res. Lett., 16, 024011, https://doi.org/10.1088/1748-9326/abd4ac, 2021.
Cologna, V., Mede, N. G., Berger, S., Besley, J., Brick, C., Joubert, M., Maibach, E. W., Mihelj, S., Oreskes, N., Schäfer, M. S., van der Linden, S., Abdul Aziz, N. I., Abdulsalam, S., Shamsi, N. A., Aczel, B., Adinugroho, I., Alabrese, E., Aldoh, A., Alfano, M., Ali, I. M., Alsobay, M., Altenmüller, M., Alvarez, R. M., Amoako, R., Amollo, T., Ansah, P., Apriliawati, D., Azevedo, F., Bajrami, A., Bardhan, R., Bati, K., Bertsou, E., Betsch, C., Bhatiya, A. Y., Bhui, R., Białobrzeska, O., Bilewicz, M., Bouguettaya, A., Breeden, K., Bret, A., Buchel, O., Cabrera-Álvarez, P., Cagnoli, F., Calero Valdez, A., Callaghan, T., Cases, R. K., Çoksan, S., Czarnek, G., De Peuter, S., Debnath, R., Delouvée, S., Di Stefano, L., Díaz-Catalán, C., Doell, K. C., Dohle, S., Douglas, K. M., Dries, C., Dubrov, D., Dzimińska, M., Ecker, U. K. H., Elbaek, C. T., Elsherif, M., Enke, B., Etienne, T. W., Facciani, M., Fage-Butler, A., Faisal, M. Z., Fan, X., Farhart, C., Feldhaus, C., Ferreira, M., Feuerriegel, S., Fischer, H., Freundt, J., Friese, M., Fuglsang, S., Gallyamova, A., Garrido-Vásquez, P., Garrido Vásquez, M. E., Gatua, W., Genschow, O., Ghasemi, O., Gkinopoulos, T., Gloor, J. L., Goddard, E., Gollwitzer, M., González-Brambila, C., Gordon, H., Grigoryev, D., Grimshaw, G. M., Guenther, L., Haarstad, H., Harari, D., Hawkins, L. N., Hensel, P., Hernández-Mondragón, A. C., Herziger, A., Huang, G., Huff, M., et al.: Trust in scientists and their role in society across 68 countries, Nat. Hum. Behav., 9, 713–730, https://doi.org/10.1038/s41562-024-02090-5, 2025.
Dablander, F., Sachisthal, M. S. M., Cologna, V., Strahm, N., Bosshard, A., Grüning, N.-M., Green, A. J. K., Brick, C., Aron, A. R., and Haslbeck, J. M. B.: Climate change engagement of scientists, Nat. Clim. Chang., 14, 1033–1039, https://doi.org/10.1038/s41558-024-02091-2, 2024.
Dong, Y., Hu, S., and Zhu, J.: From source credibility to risk perception: How and when climate information matters to action, Resources, Conservation and Recycling, 136, 410–417, https://doi.org/10.1016/j.resconrec.2018.05.012, 2018.
Donner, S. D.: Finding your place on the science – advocacy continuum: an editorial essay, Climatic Change, 124, 1–8, https://doi.org/10.1007/s10584-014-1108-1, 2014.
Edelman Trust Institute: 2024 Edelman Trust Barometer, https://www.edelman.com/trust/2024/trust-barometer (last access: 6 January 2026), 2024.
Fischhoff, B.: Nonpersuasive Communication about Matters of Greatest Urgency: Climate Change, Environ. Sci. Technol., 41, 7204–7208, https://doi.org/10.1021/es0726411, 2007.
Grzyb, T. and Dolinski, D.: The Field Study in Social Psychology: How to Conduct Research Outside of a Laboratory Setting?, Routledge, London, 216 pp., https://doi.org/10.4324/9781003092995, 2021.
Gundersen, T., Alinejad, D., Branch, T. Y., Duffy, B., Hewlett, K., Holst, C., Owens, S., Panizza, F., Tellmann, S. M., van Dijck, J., and Baghramian, M.: A New Dark Age? Truth, Trust, and Environmental Science, Annual Review of Environment and Resources, 47, 5–29, https://doi.org/10.1146/annurev-environ-120920-015909, 2022.
Heo, M., Kim, N., and Faith, M. S.: Statistical power as a function of Cronbach alpha of instrument questionnaire items, BMC Med. Res. Methodol., 15, 86, https://doi.org/10.1186/s12874-015-0070-6, 2015.
Heusinkveld, B. G., Steeneveld, G. J., van Hove, L. W. A., Jacobs, C. M. J., and Holtslag, A. A. M.: Spatial variability of the Rotterdam urban heat island as influenced by urban land use, Journal of Geophysical Research: Atmospheres, 119, 677–692, https://doi.org/10.1002/2012JD019399, 2014.
Holm, S.: A Simple Sequentially Rejective Multiple Test Procedure, Scandinavian Journal of Statistics, 6, 65–70, 1979.
Ibrahim, A. M., Lillemoe, K. D., Klingensmith, M. E., and Dimick, J. B.: Visual Abstracts to Disseminate Research on Social Media: A Prospective, Case-control Crossover Study, Annals of Surgery, 266, e46, https://doi.org/10.1097/SLA.0000000000002277, 2017.
Klok, L., Rood, N., Kluck, J., and Kleerekoper, L.: Assessment of thermally comfortable urban spaces in Amsterdam during hot summer days, Int. J. Biometeorol., 63, 129–141, https://doi.org/10.1007/s00484-018-1644-x, 2019.
Kotcher, J. E., Myers, T. A., Vraga, E. K., Stenhouse, N., and Maibach, E. W.: Does Engagement in Advocacy Hurt the Credibility of Scientists? Results from a Randomized National Survey Experiment, Environmental Communication, 11, 415–429, https://doi.org/10.1080/17524032.2016.1275736, 2017.
Lazard, A. and Atkinson, L.: Putting Environmental Infographics Center Stage: The Role of Visuals at the Elaboration Likelihood Model's Critical Point of Persuasion, Science Communication, 37, 6–33, https://doi.org/10.1177/1075547014555997, 2015.
Leerink, A., Bos, M., Reijnders, D., and van Sebille, E.: The (non)effect of personalization in climate texts on the credibility of climate scientists: a case study on sustainable travel, Geosci. Commun., 7, 201–214, https://doi.org/10.5194/gc-7-201-2024, 2024.
León, B., Negredo, S., and Erviti, M. C.: Social Engagement with climate change: principles for effective visual representation on social media, Climate Policy, 22, 976–992, https://doi.org/10.1080/14693062.2022.2077292, 2022.
Li, N., Brossard, D., Scheufele, D. A., Wilson, P. H., and Rose, K. M.: Communicating data: interactive infographics, scientific data and credibility, JCOM, 17, A06, https://doi.org/10.22323/2.17020206, 2018.
Li, N., Villanueva, I. I., Jilk, T., Van Matre, B. R., and Brossard, D.: Artistic representations of data can help bridge the US political divide over climate change, Commun. Earth Environ., 4, 1–9, https://doi.org/10.1038/s43247-023-00856-9, 2023.
Li, Y. and Xie, Y.: Is a Picture Worth a Thousand Words? An Empirical Study of Image Content and Social Media Engagement, Journal of Marketing Research, 57, 1–19, https://doi.org/10.1177/0022243719881113, 2020.
McCabe, D. P. and Castel, A. D.: Seeing is believing: The effect of brain images on judgments of scientific reasoning, Cognition, 107, 343–352, https://doi.org/10.1016/j.cognition.2007.07.017, 2008.
McCroskey, J. C. and Teven, J. J.: Goodwill: A reexamination of the construct and its measurement, Communication Monographs, 66, 90–103, https://doi.org/10.1080/03637759909376464, 1999.
Messling, L., Lu, Y., and van Eck, C. W.: Advocacy – defending science or destroying it? Interviews with 47 climate scientists about their fundamental concerns, Public Underst. Sci., 09636625251314164, https://doi.org/10.1177/09636625251314164, 2025.
Metag, J.: Climate change visuals: a review of their effects on cognition, emotion and behaviour, in: Research Handbook on Communicating Climate Change, edited by: Holmes, D. C. and Richardson, L. M., Edward Elgar Publishing, https://doi.org/10.4337/9781789900408.00025, 2020.
Mooseder, A., Brantner, C., Zamith, R., and Pfeffer, J.: (Social) Media Logics and Visualizing Climate Change: 10 Years of #climatechange Images on Twitter, Social Media + Society, 9, 20563051231164310, https://doi.org/10.1177/20563051231164310, 2023.
Mosallaei, A. and Feldman, L.: Do You See What I See? Perceptions and Effects of Image–Text Congruency in Online Climate Change News, Journalism & Mass Communication Quarterly, https://doi.org/10.1177/10776990241284596, 2024.
Murchie, K. J. and Diomede, D.: Fundamentals of graphic design – essential tools for effective visual science communication, FACETS, 5, 409–422, https://doi.org/10.1139/facets-2018-0049, 2020.
Nelson, M. P. and Vucetich, J. A.: On Advocacy by Environmental Scientists: What, Whether, Why, and How, Conservation Biology, 23, 1090–1101, https://doi.org/10.1111/j.1523-1739.2009.01250.x, 2009.
nmalkin: plot-likert, Github [code], https://github.com/nmalkin/plot-likert/, last access: 6 January 2026.
O'Neill, S., Hayes, S., Strauß, N., Doutreix, M., Steentjes, K., Ettinger, J., Westwood, N., and Painter, J.: Visual portrayals of fun in the sun in European news outlets misrepresent heatwave risks, Geographical Journal, 189, 90–103, https://doi.org/10.1111/geoj.12487, 2023.
Peeters, W., Land-Zandstra, A., and Strick, M.: Een nieuwe aanpak voor het meten van impact in de wetenschapscommunicatie: theoretisch kader en praktische uitwerking, Tijdschrift voor Communicatiewetenschap, 50, 231–250, https://doi.org/10.5117/TCW2022.3.006.PEET, 2022.
Pferschy-Wenzig, E.-M., Pferschy, U., Wang, D., Mocan, A., and Atanasov, A. G.: Does a Graphical Abstract Bring More Visibility to Your Paper?, Molecules, 21, 1247, https://doi.org/10.3390/molecules21091247, 2016.
Pielke Jr., R. A.: The Honest Broker: Making Sense of Science in Policy and Politics, Cambridge University Press, https://doi.org/10.1017/CBO9780511818110, 2007.
Pierson, S.: Science Advocacy: What Is It and What Is the Role of Professional Societies?, Amstat News, https://magazine.amstat.org/blog/2012/01/01/science-advocacy/ (last access: 6 January 2026), 2012.
Post, S. and Bienzeisler, N.: The Honest Broker versus the Epistocrat: Attenuating Distrust in Science by Disentangling Science from Politics, Political Communication, 41, 763–785, https://doi.org/10.1080/10584609.2024.2317274, 2024.
Rabinovich, A., Morton, T. A., and Birney, M. E.: Communicating climate science: The role of perceived communicator's motives, Journal of Environmental Psychology, 32, 11–18, https://doi.org/10.1016/j.jenvp.2011.09.002, 2012.
Rodriguez, L. and Dimitrova, D. V.: The levels of visual framing, Journal of Visual Literacy, 30, 48–65, https://doi.org/10.1080/23796529.2011.11674684, 2011.
Rodríguez Estrada, F. C. and Davis, L. S.: Improving Visual Communication of Science Through the Incorporation of Graphic Design Theories and Practices Into Science Communication, Science Communication, 37, 140–148, https://doi.org/10.1177/1075547014562914, 2015.
Smith, N. and Leiserowitz, A.: The Role of Emotion in Global Warming Policy Support and Opposition, Risk Analysis, 34, 937–948, https://doi.org/10.1111/risa.12140, 2014.
Steneck, N. H.: Responsible Advocacy in Science: Standards, Benefits, and Risks, AAAS Workshop on Advocacy in Science, https://www.aaas.org/resources/report-responsible-advocacy-science-standards-benefits-and-risks (last access: 6 January 2026), 1–16, 2011.
Stichting KlimaatHelpdesk: Beleidsplan Stichting KlimaatHelpdesk 2023, https://fd-cdn.nl/12602-klimaathelpdesk-prd/media/documents/Beleidsplan_Stichting_KlimaatHelpdesk_2023.pdf (last access: 6 January 2026), 2023a.
Stichting KlimaatHelpdesk: KlimaatHelpdesk Yearbook 2023, https://anyflip.com/wmevr/eqgz/ (last access: 6 January 2026), 2023b.
Suldovsky, B., Landrum, A., and Stroud, N. J.: Public perceptions of who counts as a scientist for controversial science, Public Underst. Sci., 28, 797–811, https://doi.org/10.1177/0963662519856768, 2019.
Szafir, D. A.: The good, the bad, and the biased: five ways visualizations can mislead (and how to fix them), Interactions, 25, 26–33, https://doi.org/10.1145/3231772, 2018.
van den Broek, J. (Ed.): Visual language: perspectives for both makers and users, Eleven International Pub., Distributed in USA by International Specialized Book Services, Hague, Porland, OR, 320 pp., ISBN 9789490947729, 2012.
Van den Broek-Honingh, N., Glas, I., and Vennekens, A.: Vertrouwen van Nederlanders in wetenschap (enquête 2021), Rathenau Institute, The Hague, https://www.rathenau.nl/sites/default/files/2021-07/Vertrouwen_van_Nederlanders_wetenschap_enquête_2021_Rathenau_Instituut.pdf (last access: 6 January 2026), 2021.
van Eck, C. W., Messling, L., and Hayhoe, K.: Challenging the neutrality myth in climate science and activism, npj Clim. Action, 3, 1–3, https://doi.org/10.1038/s44168-024-00171-9, 2024.
van Sebille, E.: erikvansebille/ActivismCredibilityArticle: First release of Activism Credibility Article (v0.1.0), Zenodo [code and data set], https://doi.org/10.5281/zenodo.15755647, 2025.
Wang, S., Corner, A., Chapman, D., and Markowitz, E.: Public engagement with climate imagery in a changing digital landscape, WIREs Climate Change, 9, e509, https://doi.org/10.1002/wcc.509, 2018.
Ware, C.: Visual thinking for design, Morgan Kaufmann Elsevier Science & Technology, Burlington, Mass. Amsterdam, ISBN 9780123708960, 2008.
Wijnen, F., Strick, M., Bos, M., and van Sebille, E.: Evaluating the impact of climate communication activities by scientists: what is known and necessary?, Geosci. Commun., 7, 91–100, https://doi.org/10.5194/gc-7-91-2024, 2024.
Wijnker, W., Smeets, I., Burger, P., and Willems, S.: Debunking strategies for misleading bar charts, JCOM, 21, A07, https://doi.org/10.22323/2.21070207, 2022.
Williams, L., Mulder, K. J., Charlton-Perez, A., Lickiss, M., Black, A., McCloy, R., McSorley, E., and Young, J.: Understanding representations of uncertainty, an eye-tracking study – Part 2: The effect of expertise, Geosci. Commun., 6, 111–123, https://doi.org/10.5194/gc-6-111-2023, 2023.
Yang, Y. and Hobbs, J. E.: The Power of Stories: Narratives and Information Framing Effects in Science Communication, American Journal of Agricultural Economics, 102, 1271–1296, https://doi.org/10.1002/ajae.12078, 2020.
Zhu, L., Davis, L. S., and Carr, A.: A picture is not always worth a thousand words: The visual quality of photographs affects the effectiveness of interpretive signage for science communication, Public Underst. Sci., 30, 258–273, https://doi.org/10.1177/0963662520982535, 2021.
neutral. This is because personalization increases the goodwill of readers for the academic who writes a text.