the Creative Commons Attribution 4.0 License.
the Creative Commons Attribution 4.0 License.
 | 18 Feb 2021
Demonstrating change from a drop-in space soundscape exhibit by using graffiti walls both before and after
Martin O. Archer
Natt Day
Sarah Barnes
Impact evaluation in public engagement necessarily requires measuring change. However, this is extremely challenging for drop-in activities due to their very nature. We present a novel method of impact evaluation which integrates graffiti walls into the experience both before and after the main drop-in activity. The activity in question was a soundscape exhibit, where young families experienced the usually inaudible sounds of near-Earth space in an immersive and accessible way. We apply two analysis techniques to the captured before and after data – quantitative linguistics and thematic analysis. These analyses reveal significant changes in participants' responses after the activity compared to before, namely an increased diversity in language used to describe space and altered conceptions of what space is like. The results demonstrate that the soundscape was surprisingly effective at innately communicating key aspects of the underlying science simply through the act of listening. The impacts also highlight the power of sonification in stimulating public engagement, which, through reflection, can lead to altered associations, perceptions, and understanding. Therefore, we show that this novel approach to drop-in activity evaluation, using graffiti walls both before and after the activity and applying rigorous analysis to this data, has the power to capture change and, thus, have a short-term impact. We suggest that commonly used evaluation tools suitable for drop-in activities, such as graffiti walls, should be integrated both before and after the main activity in general, rather than only using them afterwards as is typically the case.
- Article
(6221 KB) - Full-text XML
-
Supplement
(384 KB) - BibTeX
- EndNote


Drop-in activities – short, interactive, two-way engagements – tend to form a significant fraction of all non-school public engagement, e.g. 31±3 % of all public activities across the UK's South East Physics Network in 2017–2018 were less than 30 min in duration per individual (Galliano, 2018). Such activities, however, are difficult to effectively evaluate the impact of, since this necessitates a measure of change in the participants (King et al., 2015). While surveys both before and after may be one of the most robust methods of impact evaluation in general (Jensen, 2014), these are neither appropriate for, nor commensurate with, drop-in activities. This is because participants are arriving all the time, the engagement duration is so short, and surveys risk affecting the participants' experience (Grand and Sardo, 2017). A number of evaluation tools more suitable for drop-in activities have been reported including feedback cards, rating cards, snapshot interviews, and graffiti walls (e.g. Grand and Sardo, 2017; Public Engagement with Research team, 2019). Graffiti walls are large areas (often a wall, whiteboard, or large piece of paper) on which participants are free to write or draw responses in reaction to the engagement activity or some prompt question, either directly on the area itself or by sticking responses to it. All of these evaluation methods for drop-ins are particularly useful in process evaluation, i.e. assessing the implementation of the activity. Under typical usages (post-activity only), however, they are limited in their ability to routinely demonstrate a change caused by, and thus the impact of, the engagement activity on participants in general.
This paper presents a novel implementation of graffiti walls for impact evaluation, integrating them into both the start and end of a drop-in activity. The activity was a soundscape experience surrounding current space science research that used geostationary satellite data converted into audible sound. We show that this evaluation method (through its design, data collection, and analysis) can indeed capture immediate impact – in this case, it was changed language and conceptions of space. The Appendices include details of the statistical and qualitative coding techniques employed throughout.
A common misconception is that space is a true vacuum completely devoid of matter, and thus, there is no activity other than that of the celestial bodies, e.g. planets or asteroids. However, the universe is permeated by tenuous plasmas – gases formed from electrically charged ions and electrons that generate and interact with electromagnetic fields (e.g. Baumjohann and Treumann, 2012). One such example is the solar wind streaming at several hundreds of kilometres a second from the Sun to the edge of the heliosphere, something of which only 58±2 % of the UK adult population is aware (3KQ and Collingwood Environmental Planning, 2015). Space plasmas are not just limited to our solar system, with other stars also having their own stellar winds (e.g. Lamers and Cassinelli, 1999), and the interstellar medium bridges the gap between these plasma bubbles in outer space (Gurnett et al., 2013).
The presence of a medium in space allows for plasma wave analogues to ordinary sound (pressure waves) that occur at ultra-low frequencies – fractions of millihertz up to 1 Hz. They are routinely measured by many space missions and can have perturbations that are significant fractions of the background values. For a further discussion of the equivalence of these plasma waves to sound, see Archer (2020a). One way in which ultra-low frequency waves are generated is through the highly dynamic solar wind buffeting against Earth's magnetic field. This process plays a key role within space weather and, thus, how phenomena from space can affect our everyday lives (e.g. Keiling et al., 2016). However, the belief by the public that space is completely empty in turn leads many to incorrectly think that there is absolutely no sound in space, and this is reinforced by school science demonstrations such as the bell jar experiment (see Caleon et al., 2013 for a nuanced discussion of this experiment and sound in near-vacuum conditions) or even popular culture like in the marketing for the movie Alien (which stated “in space no one can hear you scream”). Public engagement with this research area may help correct this fallacy.
Sonification – the use of non-speech audio to convey information or perceptualise data (Kramer, 1994) – can be used to convert satellite measurements of these usually inaudible space sounds into audible signals simply by dramatically speeding up their playback (Alexander et al., 2011, 2014). This has already been leveraged in public engagement projects for both scientific and artistic outputs (Archer et al., 2018; Archer, 2020b). Sonification in general has been applied to various scientific data sets (Feder, 2012). Supper (2014) posits that, through the public experiencing data in this way, it can grip their imagination and produce sublime experiences because of sound's immersive and emotional nature. These arguments, however, are mostly based on reflections from researchers and artists rather than being based on the evaluation of the participants' own thoughts and feelings. This paper evaluates the short-term impact on participants who experienced the sounds of space by using graffiti walls both before and after a soundscape.
The space soundscape exhibit was held at the free Science Museum in London (United Kingdom), whose informal learning adopts an inclusive, accessible science capital approach that attracts a diverse range of audiences (Science Museum Group, 2017, 2020). Science capital is defined as the total science-related knowledge, attitudes, experiences, and resources that a person has built up over their life (Archer and DeWitt, 2017). This includes what science they know about, what they think and feel about science, the people they know and their relation to science, and the day-to-day engagement they have with science. The exhibit formed part of the museum's “Summer of Space Season”, held in celebration of the 50th anniversary of the Apollo moon landings, for which the museum both solicited and subsequently hosted drop-in space-themed activities aimed at young families. It ran between the hours 12:00–16:00 local time, during the May 2019 half-term school holiday, over the course of 4 d.
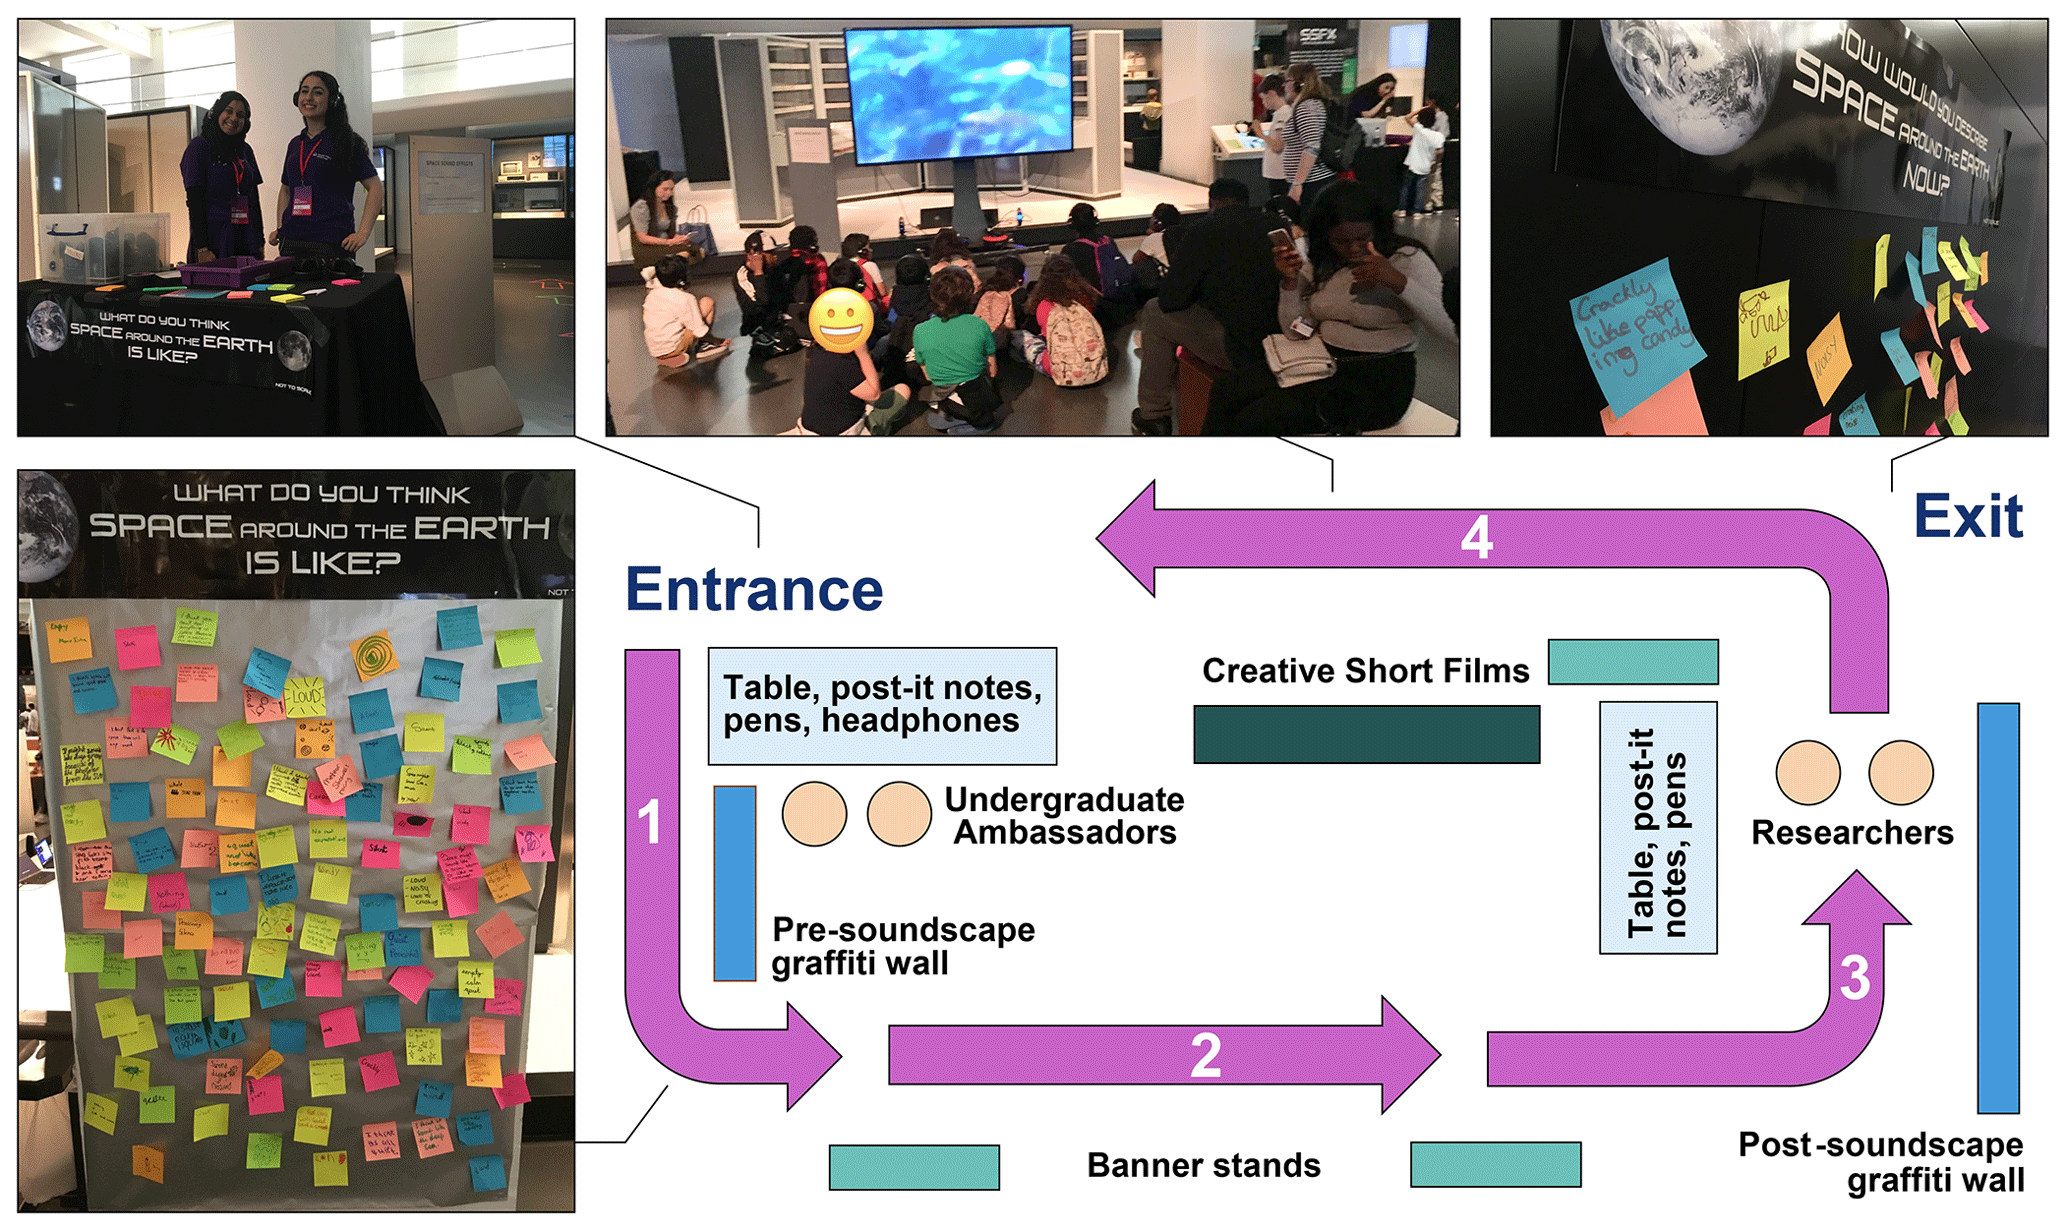
The purpose of the space soundscape was primarily to provide young children and their parents/carers (as key influences upon them) with an accessible and immersive experience of space research that would enable participation and spark discussion. Such experiences may, when taken in conjunction with all the other formal and informal interactions with science afforded to a young person, contribute towards developing their science identity and, hence, help build their science capital. Using a generic learning outcomes framework (Hooper-Green, 2004), the main intentions of the activity fell within the realms of “enjoyment, inspiration, creativity” and “attitudes and values”, with the explicit enhancement of “knowledge and understanding” being only a secondary aim. Figure 1 shows the layout of the exhibit, which was integrated amongst the museum's usual collections, along with accompanying photos. The activity worked as follows:
-
Museum visitors were invited to participate in the activity at the entrance by undergraduate ambassadors. They were first asked to write or draw on a post-it note what they thought space around our planet is like. Some younger children required further prompting beyond this broad question, however, with ambassadors often asking “what do you think space sounds like?” The participants placed their responses on the pre-soundscape graffiti wall and were handed Bluetooth wireless headphones that played the sounds of space.
-
Participants went on a journey while listening to the sounds, following a set of coloured arrows marked out on the floor. A number of banner stands with further information about the sounds were placed along this path, though it was observed that few people read these. This may be either because participants preferred to listen to the sounds or because it was not clear the stands were part of the experience, given the exhibit's location amongst other collections.
-
Near the end of the journey, researchers took back the participants' headphones and asked them to reflect on what they think about space after having listened to the sounds. Participants then recorded their thoughts on post-it notes again and placed these on the post-soundscape graffiti wall. The researchers would use what they had written or drawn to prompt a short dialogue about aspects of the space environment around Earth and space weather research. This method was informed by the science capital research (Archer and DeWitt, 2017), which recommends scientists use and value participants' own experiences within their engagement practice to help enable lower science capital audiences to feel included in science and feel that science is for “people like me”. These discussions provided an opportunity to solidify, or in some cases clarify, the associations that participants made from the soundscape experience in a tailored and audience-focused way (e.g. only going into an appropriate level of detail, depending on the individual or group).
-
Finally, researchers would change the channel on the headphones so that the participants could watch a series of creative short films inspired by and incorporating the sounds on a large TV screen (Archer, 2020b). The films also featured epilogue text that reinforced the importance and relevance of space weather research. Surprisingly, these artistic films proved much more popular than anticipated.
The graffiti walls were used as an open opportunity for participants to reflect upon their perceptions and associations with space both before and after the soundscape, with this being intentionally left broad to elicit a wide range of possible responses and, thus, potential impacts. This method was chosen specifically due to its suitability for evaluating drop-in activities, its ability to be integrated within the activity itself, and its alignment with our intended overall experience for participants. While graffiti walls are a common evaluation tool, we are unaware of any published public engagement activity that has used them to capture and analyse data both before and after a drop-in activity. This makes our evaluation approach for the exhibit novel.
Ethical considerations in the design of the exhibit and its evaluation followed the British Educational Research Association (BERA, 2018) guidelines and were discussed with institutional funders and the Science Museum before the activity occurred. All respondents consented to providing graffiti wall responses as these were not mandatory for participation in the soundscape exhibit. Children only participated in any of the activities when accompanied by their appropriate adult. All data collected were anonymous and no characteristics about participants were solicited. Overall, it was determined that (due to the nature of the exhibit, its design, and the types of responses being collected) there was very little risk of harm arising from participation.
The space soundscape was experienced by 1003 people, which was recorded using a tally counter. The majority were in family groups (approximately three-quarters were children, based on observations) with some independent adults too. It was observed that in families typically only the children contributed to the graffiti walls (with no substantive difference in respondents before and after), and in many cases, accompanying adults did not take headphones when offered, perceiving the activity as just for their children. There were 535 and 446 responses (predominantly textual) on the pre- and post-soundscape graffiti walls, respectively, corresponding to rates of 53±2 % and 44±2 %. This is some 3–10 times greater than reported for typical graffiti walls (Public Engagement with Research team, 2019), likely due to their integration into the overall activity here.
The data captured on the pre- and post-soundscape graffiti walls are displayed in Fig. 2. However, simply presenting the data is insufficient to robustly demonstrate any potential changes and, thus, impacts. Instead, analysis is required, and two approaches are taken here, namely quantitative linguistics and thematic analysis.
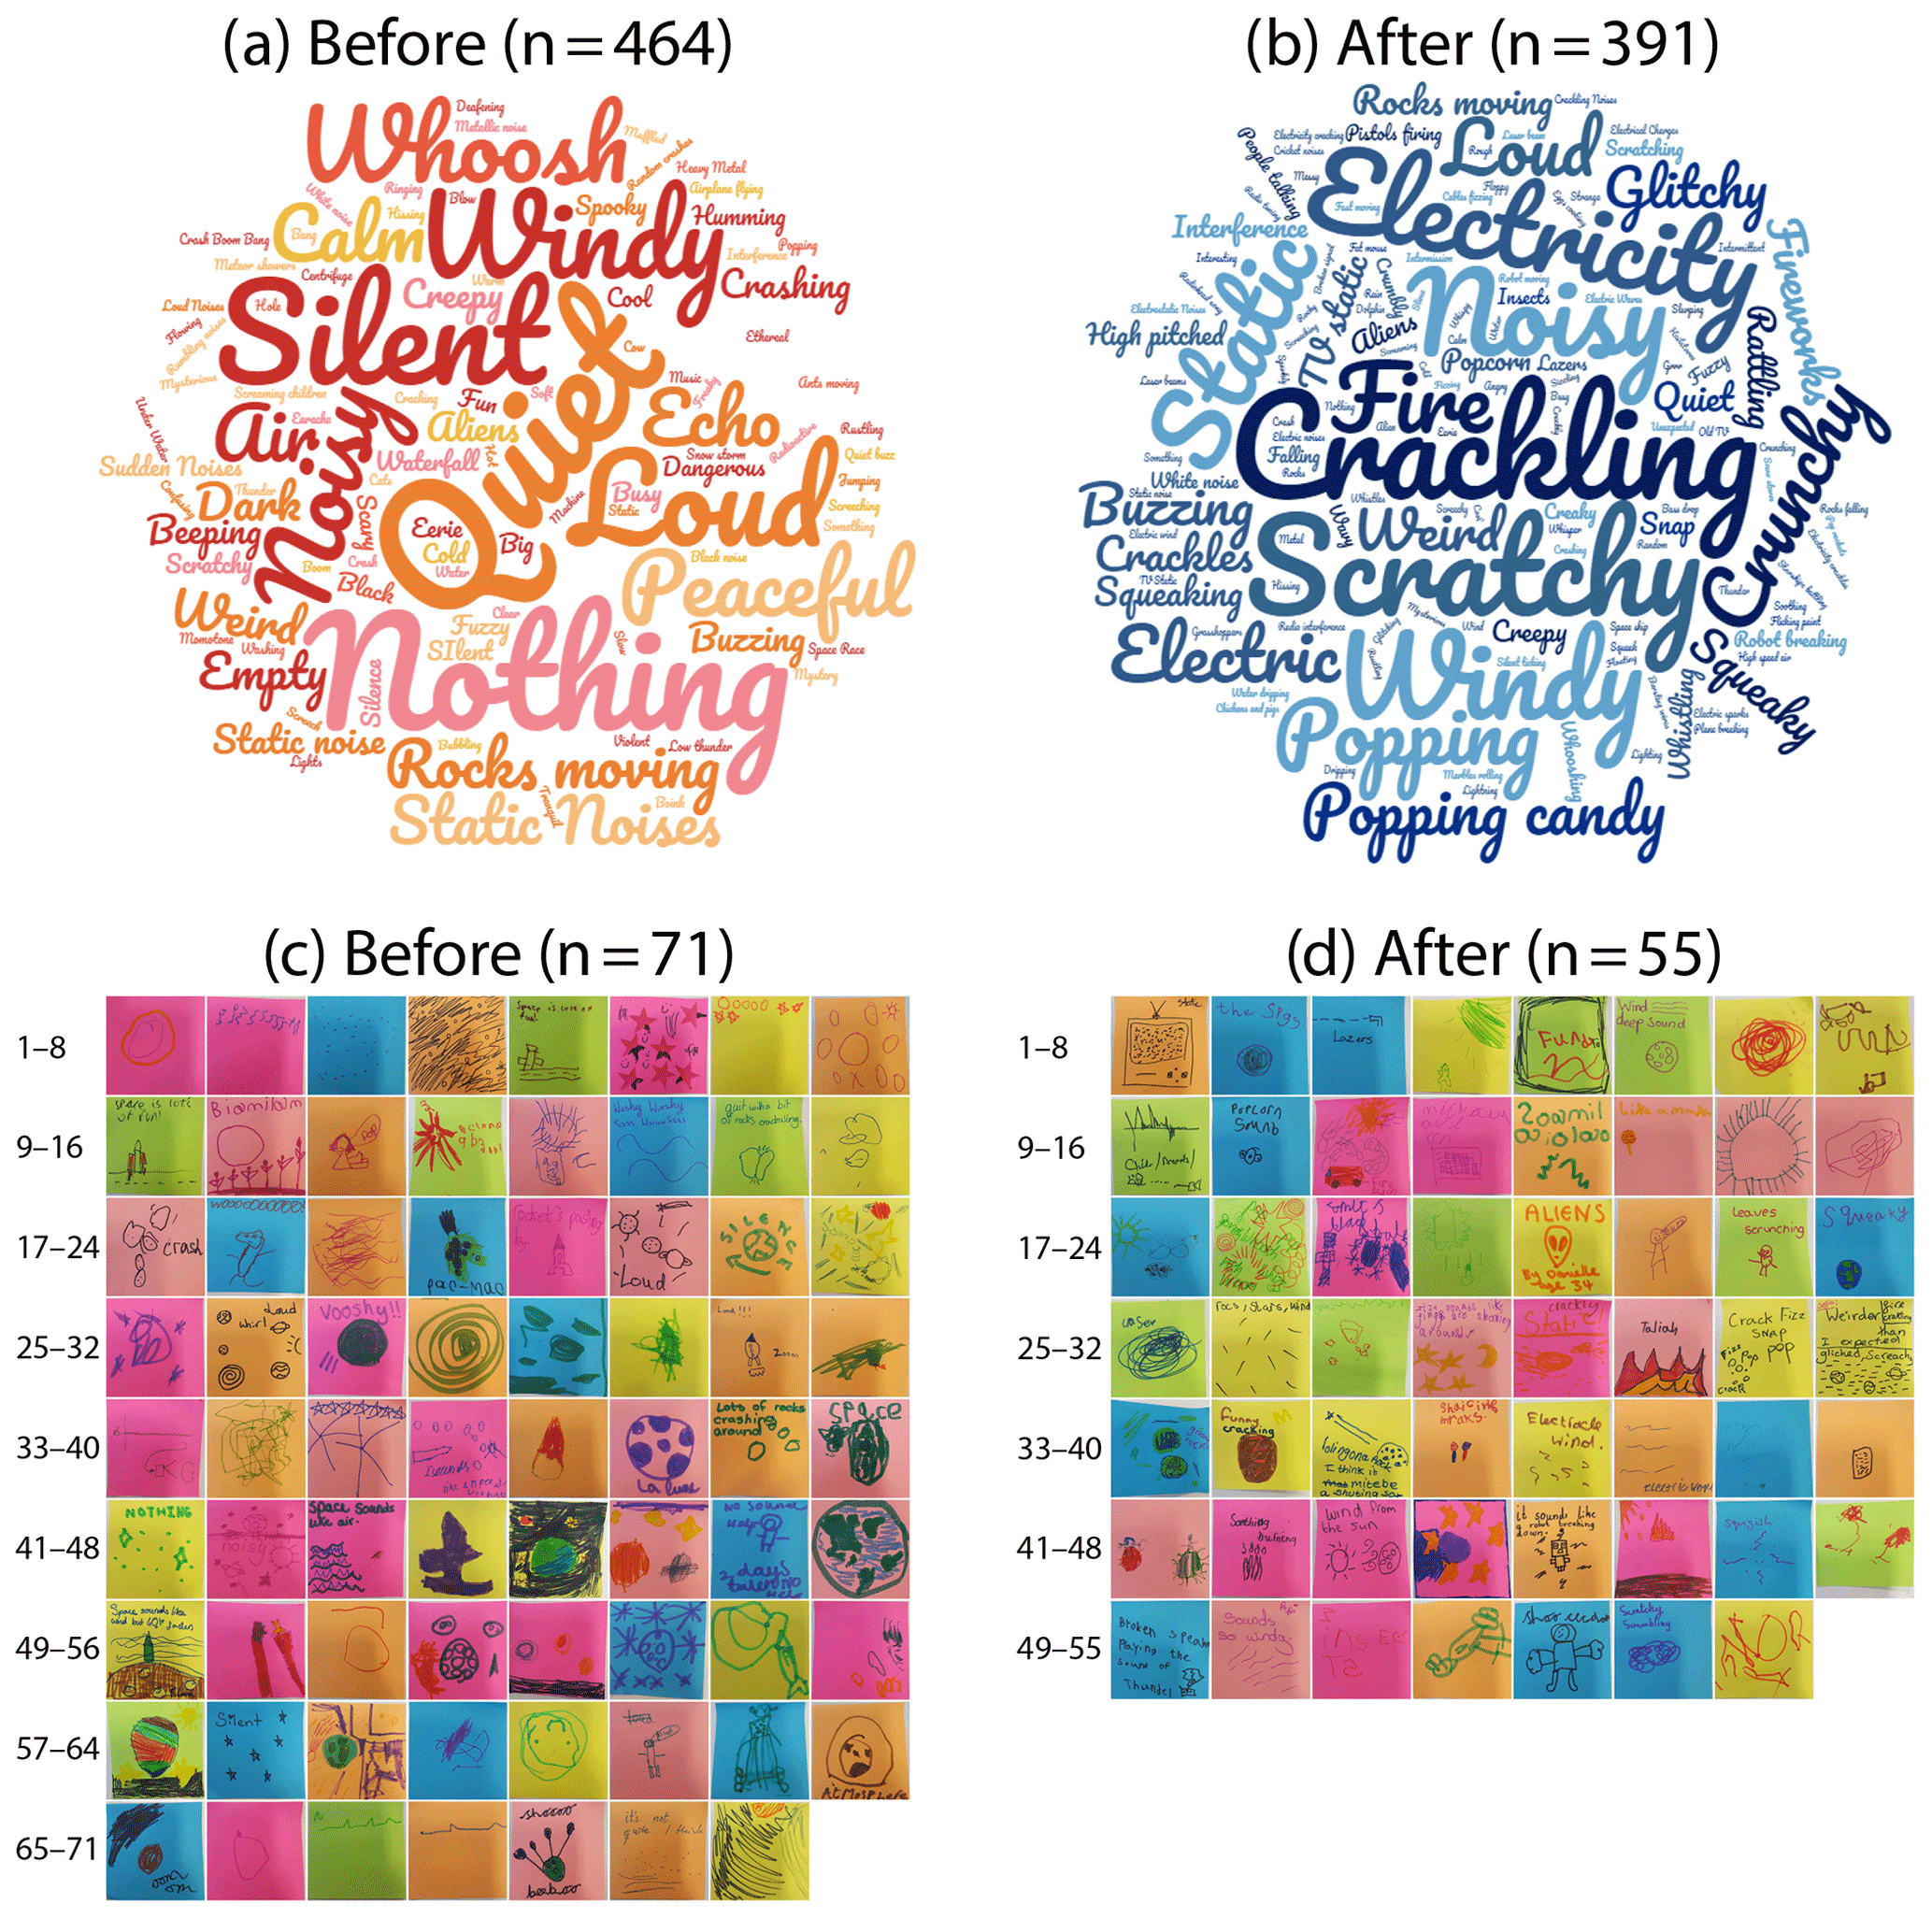
Figure 2Word clouds (a, b) and drawn images (c, d) from both before (a, c) and after (b, d) experiencing the soundscape.
4.1 Quantitative linguistics
Quantitative linguistics investigates language using statistical methods and has uncovered several linguistic laws that mathematically formulate the empirical properties of languages. One of these is Zipf's law, which states that the frequency of words is approximately inversely proportional to their rank (where the more often a word is used, the higher its rank, i.e. closer to 1; Zipf, 1935, 1949). An alternative way in which this law is stated is that the statistical distribution of word ranks follows a power law with an exponent that is typically quoted as −1. Zipf's law holds well for almost all languages and many other human-created systems (Piantadosi, 2014). The Zipf exponent, however, can vary and is a measure of the diversity of words. Baixeries et al. (2013) showed that children's Zipf exponents become less negative/shallower with age, demonstrating an increasing variety of language and, thus, linguistic complexity as they develop. However, we are not aware of Zipf's law being exploited in a public engagement evaluation before.
Figure 3 shows the rank frequency plots of the textual responses to the soundscape before and after the experience. This particular analysis, thus, omits any purely pictorial responses. Ties in ranks have been accounted for by using standard competition ranking (also known as the “1224” ranking, where a gap is left following the tie). It is clear from these plots that the distributions follow broken power laws (apart from the top word which is of similar frequency before and after). Break points and exponents have been ascertained by a piecewise regression (see Appendix A). Interestingly, the breaks in the two data sets occur at similar ranks, namely ∼2–3 and ∼9–10. We are not concerned with the specific values of the Zipf exponents, which could depend on the demographics of the participants, but simply whether they changed from before to after and in what sense. The exponents in the higher rank segments show clear differences – the after data set exhibits a much shallower exponent. The lowest ranked segments are, in contrast, consistent with one another. The top 10 ranks constitute 62±2 % of the words before and 45±3 % after, making the two entire distributions significantly different ( in a two-sample Kolmogorov–Smirnov test; see Appendix A). The overall result is that there was an increased diversity of words resulting following the soundscape. We interpret this positive impact as signifying that the participants engaged with and reflected on the stimulating experience afterwards rather than continuing to draw from common associations concerning space, which they likely did beforehand. We have, therefore, demonstrated language change in participants resulting from a public engagement activity through the novel usage of Zipf's law applied to graffiti wall responses.
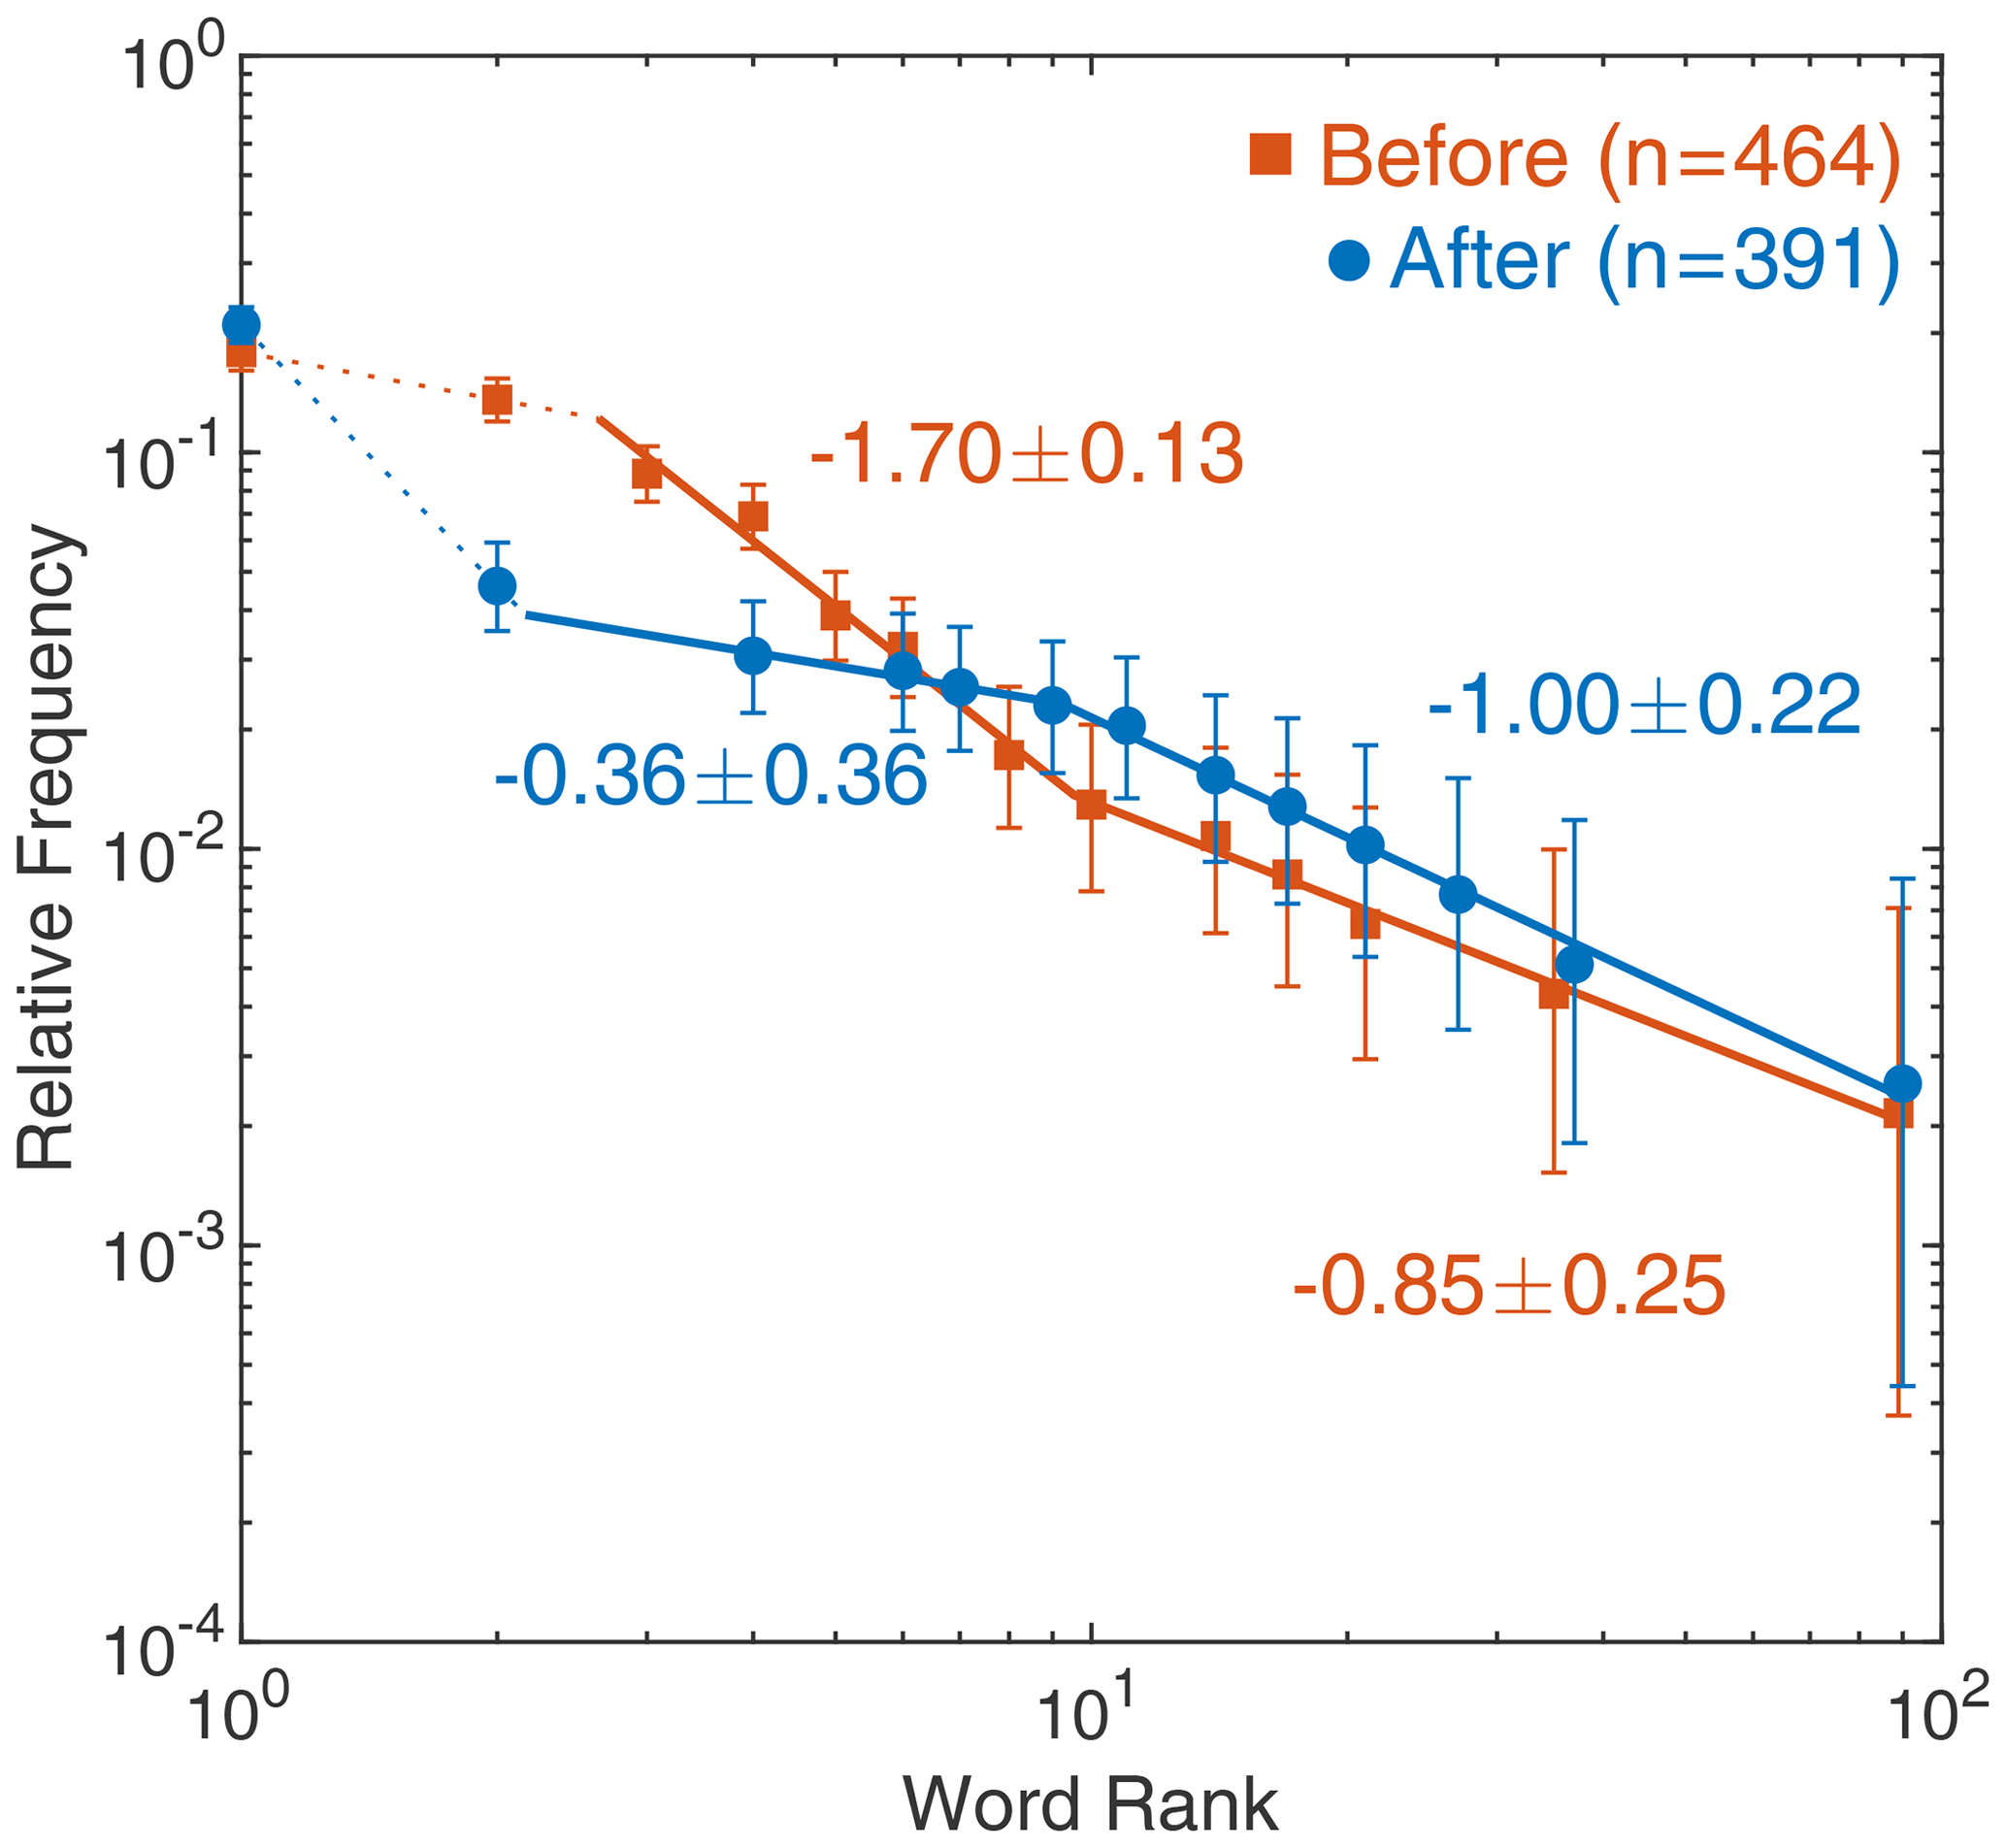
Figure 3Log–log rank frequency plot of words before (orange) and after (blue) the soundscape. Power law exponents from a piecewise linear regression are indicated. Uncertainties refer to standard errors.
4.2 Thematic analysis
Thematic analysis (Braun and Clarke, 2006) was used to analyse the meaning behind both textual and drawn responses. This finds patterns, known as qualitative codes, in the data which are then grouped into broader related themes. Instead of using pre-determined codes, the analysis drew on grounded theory (Robson, 2011; Silverman, 2010), allowing the themes to emerge from the data, as outlined in Appendix B. This more exploratory and data-driven approach enables unexpected outcomes and impacts (whether positive or negative) to come to light, rather than analysing the qualitative data only through a particular lens based on specific intended outcomes. The main themes and underlying (typically antithetical) codes determined by the first author are given in Table 1.
Table 1Themes and underlying qualitative codes in the thematic analysis.
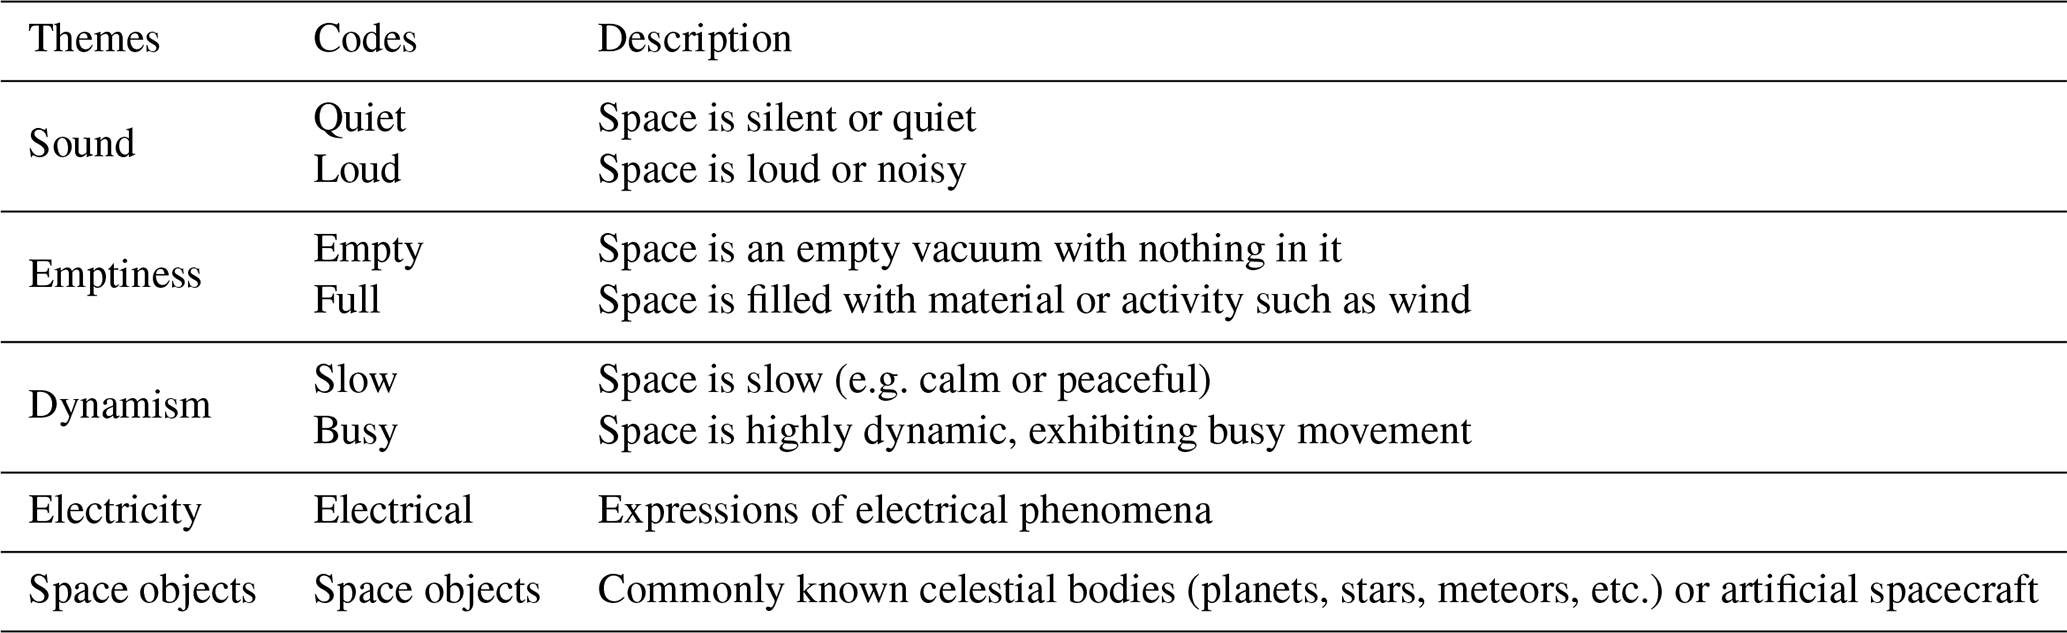
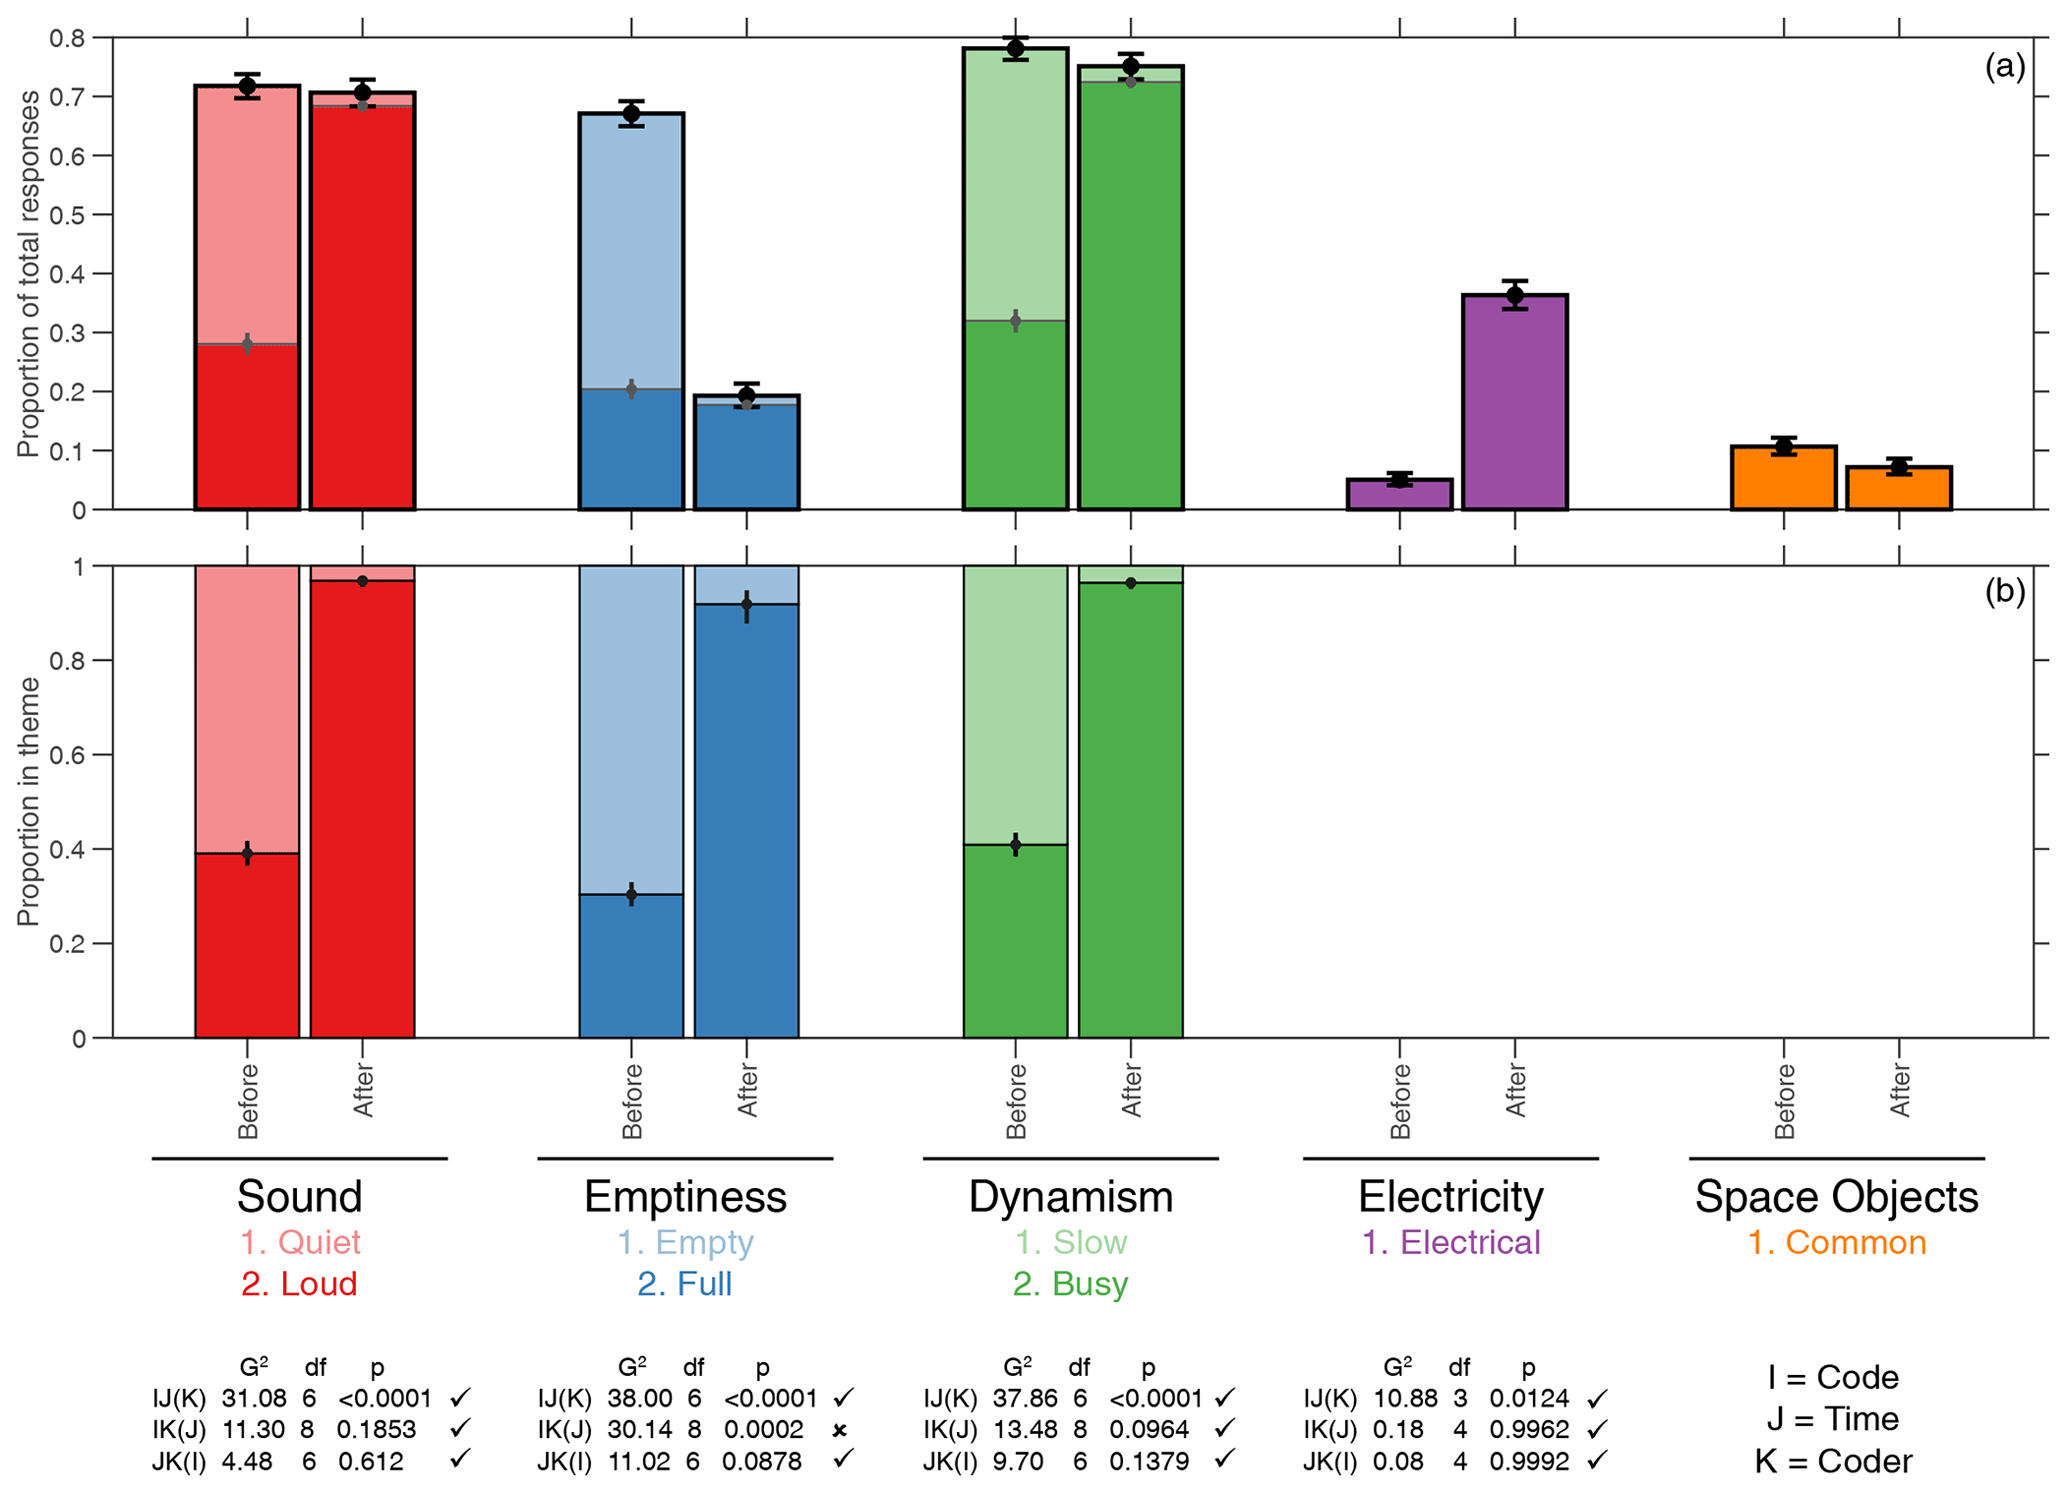
Figure 4Comparison of qualitative themes and codes before (n=535) and after (n=446) the soundscape experience normalised by total responses (a) and totals within each theme (b). Error bars depict the standard error in proportions. Log-linear analysis statistics of the agreement between coders are also shown for each theme.
We quantify the number of responses in each theme and qualitative code (see Sandelowski, 2001; Sandelowski et al., 2009; Maxwell, 2010) to investigate any changes from before to after the soundscape experience. These are shown in Fig. 4 relative to the total responses (Fig. 4a) and within each theme (Fig. 4b).
The theme of sound is highly relevant to the activity and was commonly expressed both before and after. Responses beforehand mostly considered space to be quiet and/or silent (61±3 % within the theme). However, a non-negligible fraction thought it to be loud, which may be due to participants second-guessing the question because of the nature of the activity and/or the phrasing by undergraduate ambassadors. Nonetheless, the overwhelming majority (97±1 % within the theme) of participants expressed that space is a noisy environment after the experience – a considerable change to beforehand. The perceived loudness of sound, both in terms of human hearing and measurement, necessitates logarithmic scales (Robinson and Dadson, 1956). Such scales, like the decibel, therefore require some reference base level. For sound, this is typically set at the threshold pressure for human hearing of 20 µPa (Roeser et al., 2007). One must remember though that pressure fluctuations depend on the background pressure level too (100 000 Pa at sea level). Therefore, while the absolute amplitude of variations in space are clearly small, relative to the background they are large (as was noted in Sect. 2), and thus, one can consider space to be noisy in this sense. Another equally valid perspective is that the process of sonification has revealed the presence of sound that would otherwise not be audible, and thus, participants have discovered, thanks to the exhibit, that space is noisier than they had previously imagined.
We note that the theme of dynamism exhibits quantitatively similar results to that of sound – a clear majority (59±3 % within the theme) thought space to be slow beforehand, whereas the vast majority (96±1 %) considered it to be highly dynamic afterwards. The dynamism of Earth's magnetosphere is relative to the natural timescales of the system. The typical periods of oscillations are of the order of several minutes to tens of minutes, and the properties of the waves (and even their drivers) can significantly change within just a few wave periods (e.g. Keiling et al., 2016). This is unlike most sounds we are used to on Earth, which often remain coherent for many hundreds or even thousands of oscillations. Therefore, just like with sound, space around our planet can be considered dynamic, both relative to the properties of the environment and relative to participants' prior expectations.
The theme of emptiness (including both of its underlying codes) was quite common in responses beforehand, however it was expressed much less often following the soundscape. The prevailing opinion before was that space is empty and this dramatically reduced following the soundscape, both relative to the total responses (from 47±2 % to 2±1 % ) and within the theme (from 70±3 % to 8±4 %). In contrast, the expression of space being full was communicated a similar number of times both before and after. Therefore, participants who had previously thought space was empty typically went on to write words that fell within a different theme, rather than a response signifying space as being filled with material. Since space is not absolutely devoid of material, as it is permeated by tenuous plasmas, the exhibit successfully challenged this common misconception.
There was a clear increase in the proportion of responses relating to electricity following the event, from 5±1 % to 36±2 %. Electricity is of fundamental importance to the plasma state, and thus, the increased realisation of this by participants is a welcome change resulting from the exhibit.
At first glance, common space objects, such as planets, stars, or satellites (typically expressed through drawings), may appear to be more frequent before the soundscape than after in Fig. 2. As a fraction of the total number of responses, though, this difference is small and not strictly statistically significant (p=0.057).
We checked the reliability of all these trends resulting from the qualitative coding by applying a log-linear analysis to a subset of the data additionally coded by the co-authors (see the Appendices for details). Using the notation that I denotes the qualitative codes, J the time (i.e. before or after), and K the different coders for the results to be consistent, one would expect that the IJ(K) test be statistically significant, constituting the reported trends in codes with time, but the IK(J) and JK(I) interactions should not be, indicating independence from individual coders. These statistics are displayed in Fig. 4 for each theme (apart from space objects, which were less common), indicating the expected behaviour – apart from in the case of emptiness. This theme showed some inconsistency between coders for the full code, whereas when only the empty code was considered, the coders were in agreement ( and 2.06 respectively). Therefore, the main results of the paper are robust, and hence, we have demonstrated a change in participants' conceptions of space, well-aligned with the underpinning research, that resulted from this drop-in engagement activity.
A challenge within public engagement is evaluating the impact of drop-in activities, since this necessitates a measure of change using evaluative tools that are appropriate to and commensurate with the engagement (Jensen, 2014; King et al., 2015; Grand and Sardo, 2017). We have presented a novel implementation and analysis stemming from a common evaluation tool, namely graffiti walls (e.g. Public Engagement with Research team, 2019). These were integrated both before and after a soundscape exhibit on space science research using sonified satellite data. The pre- and post-soundscape graffiti walls provided data on participants' conceptions of space and, through their integration into the activity itself, had much higher response rates than is typical. The captured data were analysed in two different ways.
We investigated the statistical properties of the words expressed by using Zipf's law from quantitative linguistics. This states that the frequency of words in languages typically follow power laws for which the exponents give a measure of the diversity of words and where shallower exponents indicate greater variety. The distributions from the graffiti walls showed that the exponent for the top ∼10 words (constituting 62±2 % of the responses before and 45±3 % after) became significantly shallower from before to after, whereas the exponents were consistent for the remaining words. This demonstrates an overall increased linguistic complexity concerning participants' thoughts about space following the activity. This positive result aligns with the exhibit's aims in the realm of “enjoyment, inspiration, creativity” (see Hooper-Green, 2004), since being exposed to the sounds of space led to stimulation, reflection, and, ultimately, a more diverse and creative set of words about space than had been expressed beforehand. We are unaware of Zipf's law being used in impact evaluation for public engagement before.
We also investigated themes present in the responses, which again yielded significant and robust positive changes from before to after. Beforehand, participants typically expressed common misconceptions of space being completely empty, silent, and with little activity. However, after experiencing the space sounds, they felt space was a noisy and dynamic environment with electrical phenomena present. It is astounding that, simply by listening to the sounds, these simple aspects of the underlying space plasma physics were successfully and innately communicated to participants before they even spoke to the researchers. This therefore demonstrates the power of sonification for audiences. While this had been argued by Supper (2014) based on reflections from researchers and artists, here we have shown it from a direct evaluation of the participants' experiences. Therefore, we have shown positive effects in the realms of “knowledge and understanding” and “attitudes and values” (see Hooper-Green, 2004) resulting from the soundscape. The measured changes in associations, conceptions, and perceptions will have been further reinforced by researchers drawing from participants' own reflections in their subsequent dialogues (see Archer and DeWitt, 2017).
Overall, integrating existing evaluation tools suitable for drop-in engagement activities, such as graffiti walls, both before and after a drop-in activity can enable practitioners to demonstrate changes resulting from the engagement and, therefore, its short-term impact. However, such tools are typically only used following activities, which limits the ability to demonstrate some measure of change and, thus, impact. We suggest that our approach, both in terms of data capture and analysis, should be adopted more regularly – not just for soundscape exhibits but for a range of different drop-in activities in general.
Statistical uncertainties in proportions are estimated using the Clopper and Pearson (1934) conservative method based on the binomial distribution, where standard (68 %) errors are shown throughout.
A piecewise linear regression in log–log space was used to minimise the sum of the squared error between the data and a model made up of a specified number of line segments whose break points could be varied iteratively. This was performed for an increasing number of segments, each time calculating the degrees-of-freedom-adjusted R2 which accounts for the number of explanatory variables added to the model as follows:
where R2 is the usual coefficient of determination, n is the number samples, and is the total number of explanatory variables in the piecewise linear model with s segments. The final model was selected as the first peak in with s. Any segments with only two data points are later ignored. The statistical significance of the slopes was determined by an analysis of covariance (ANCOVA), with a multiple comparison procedure (Hochberg and Tamhane, 1987). The standard errors in the slopes quoted are derived from a propagation of uncertainty in the proportions within the linear regression.
A two-sample Kolmogorov–Smirnov test is used to non-parametrically test the equality of two probability distributions. It quantifies the distance between two 1D empirical (cumulative) distribution functions F1,n(x) and F2,m(x) as follows:
where sup is the supremum function (Massey, 1951). The critical value of this statistic is given by for desired significance α.
Finally, log-linear analysis is employed to check the consistency of the changes in coding with time across the different coders. This extension of the χ2 test of independence to higher dimensions uses a similarly distributed statistic, the deviance, given by the following:
for observed Oijk and expected Eijk frequencies (Agresti, 2007). Here we assess conditionally independent models denoted as IJ(K), which tests the two-way IJ interaction with the effects of the IK and JK interactions removed. Computationally, this calculates G2 for each level of K summing the results, with G2 having degrees of freedom.
The qualitative coding process of thematic analysis drawn from grounded theory involved the following steps:
-
Familiarisation – responses (Fig. 2) are studied and initial thoughts noted.
-
Induction – initial codes are generated based on a review of the data.
-
Thematic review – codes are grouped together into themes and applied to the full data set.
-
Reliability – codes are applied to a subset of data by second coders to check reliability of the results.
-
Finalisation – theoretical interpretation and narrative are formulated from final coding.
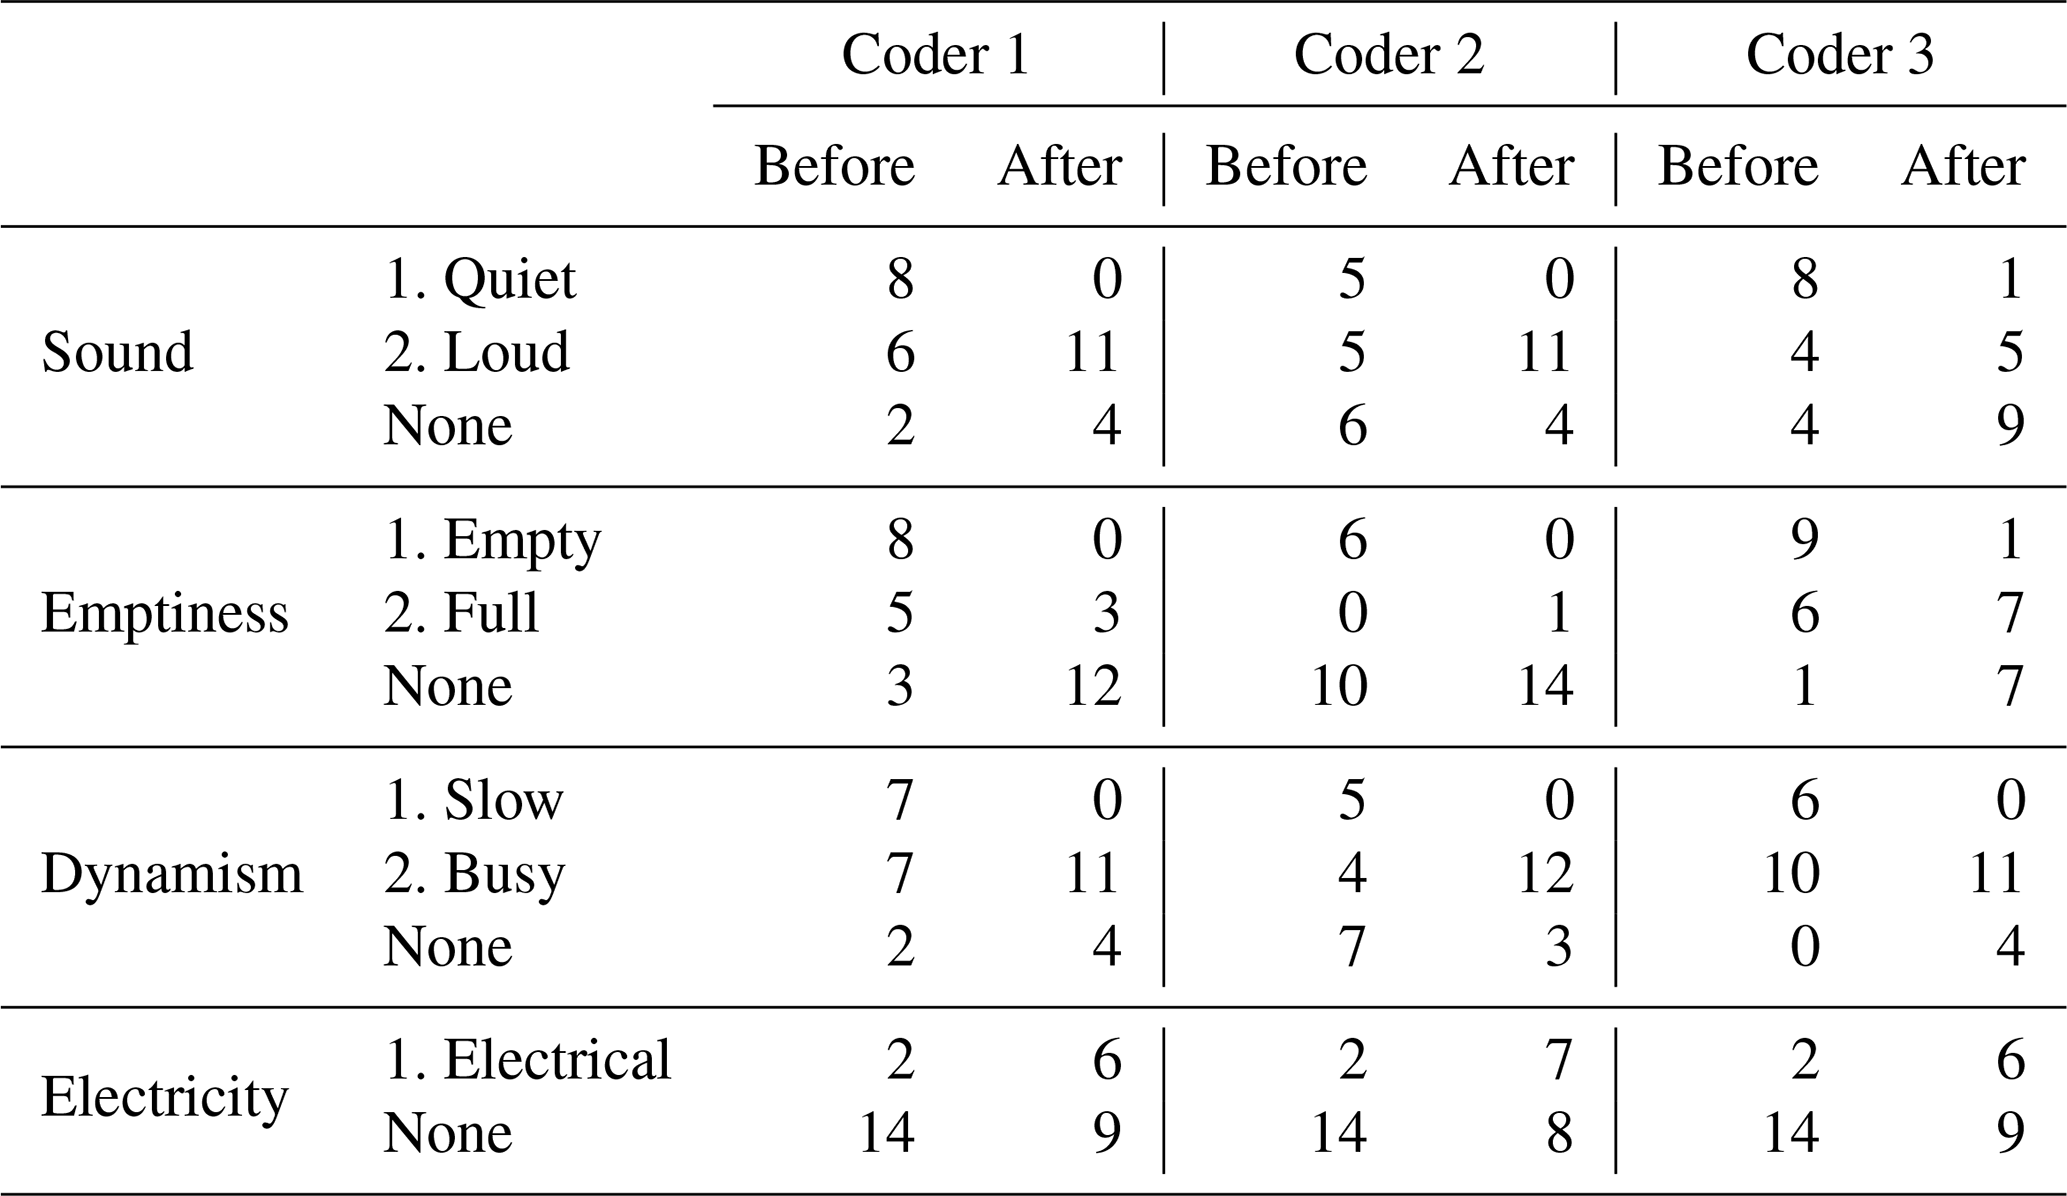
Table B1 shows the number of responses (both unique and total) across words and pictures in each theme and its underlying codes both before and after the soundscape experience. To ensure the reliability of the main qualitative coding of the entire data set, second coders applied the thematic analysis to a subset of the data. This subset constituted the top 16 words before (58 % of total responses) and 15 words after (49 %), with the slightly different number of words used in the two data sets being due to ties in the ranking of words making it impossible to have exactly the same number in both. Table B2 shows the totals of how these unique words were grouped across all three coders. These results are used in the log-linear analysis to test reliability, which we note does not require equally sized data sets. The code's association to the raw data can be found in the Supplement, both for the main and second coders.
Table B1Number of responses (both unique and total) in each theme before and after the soundscape.
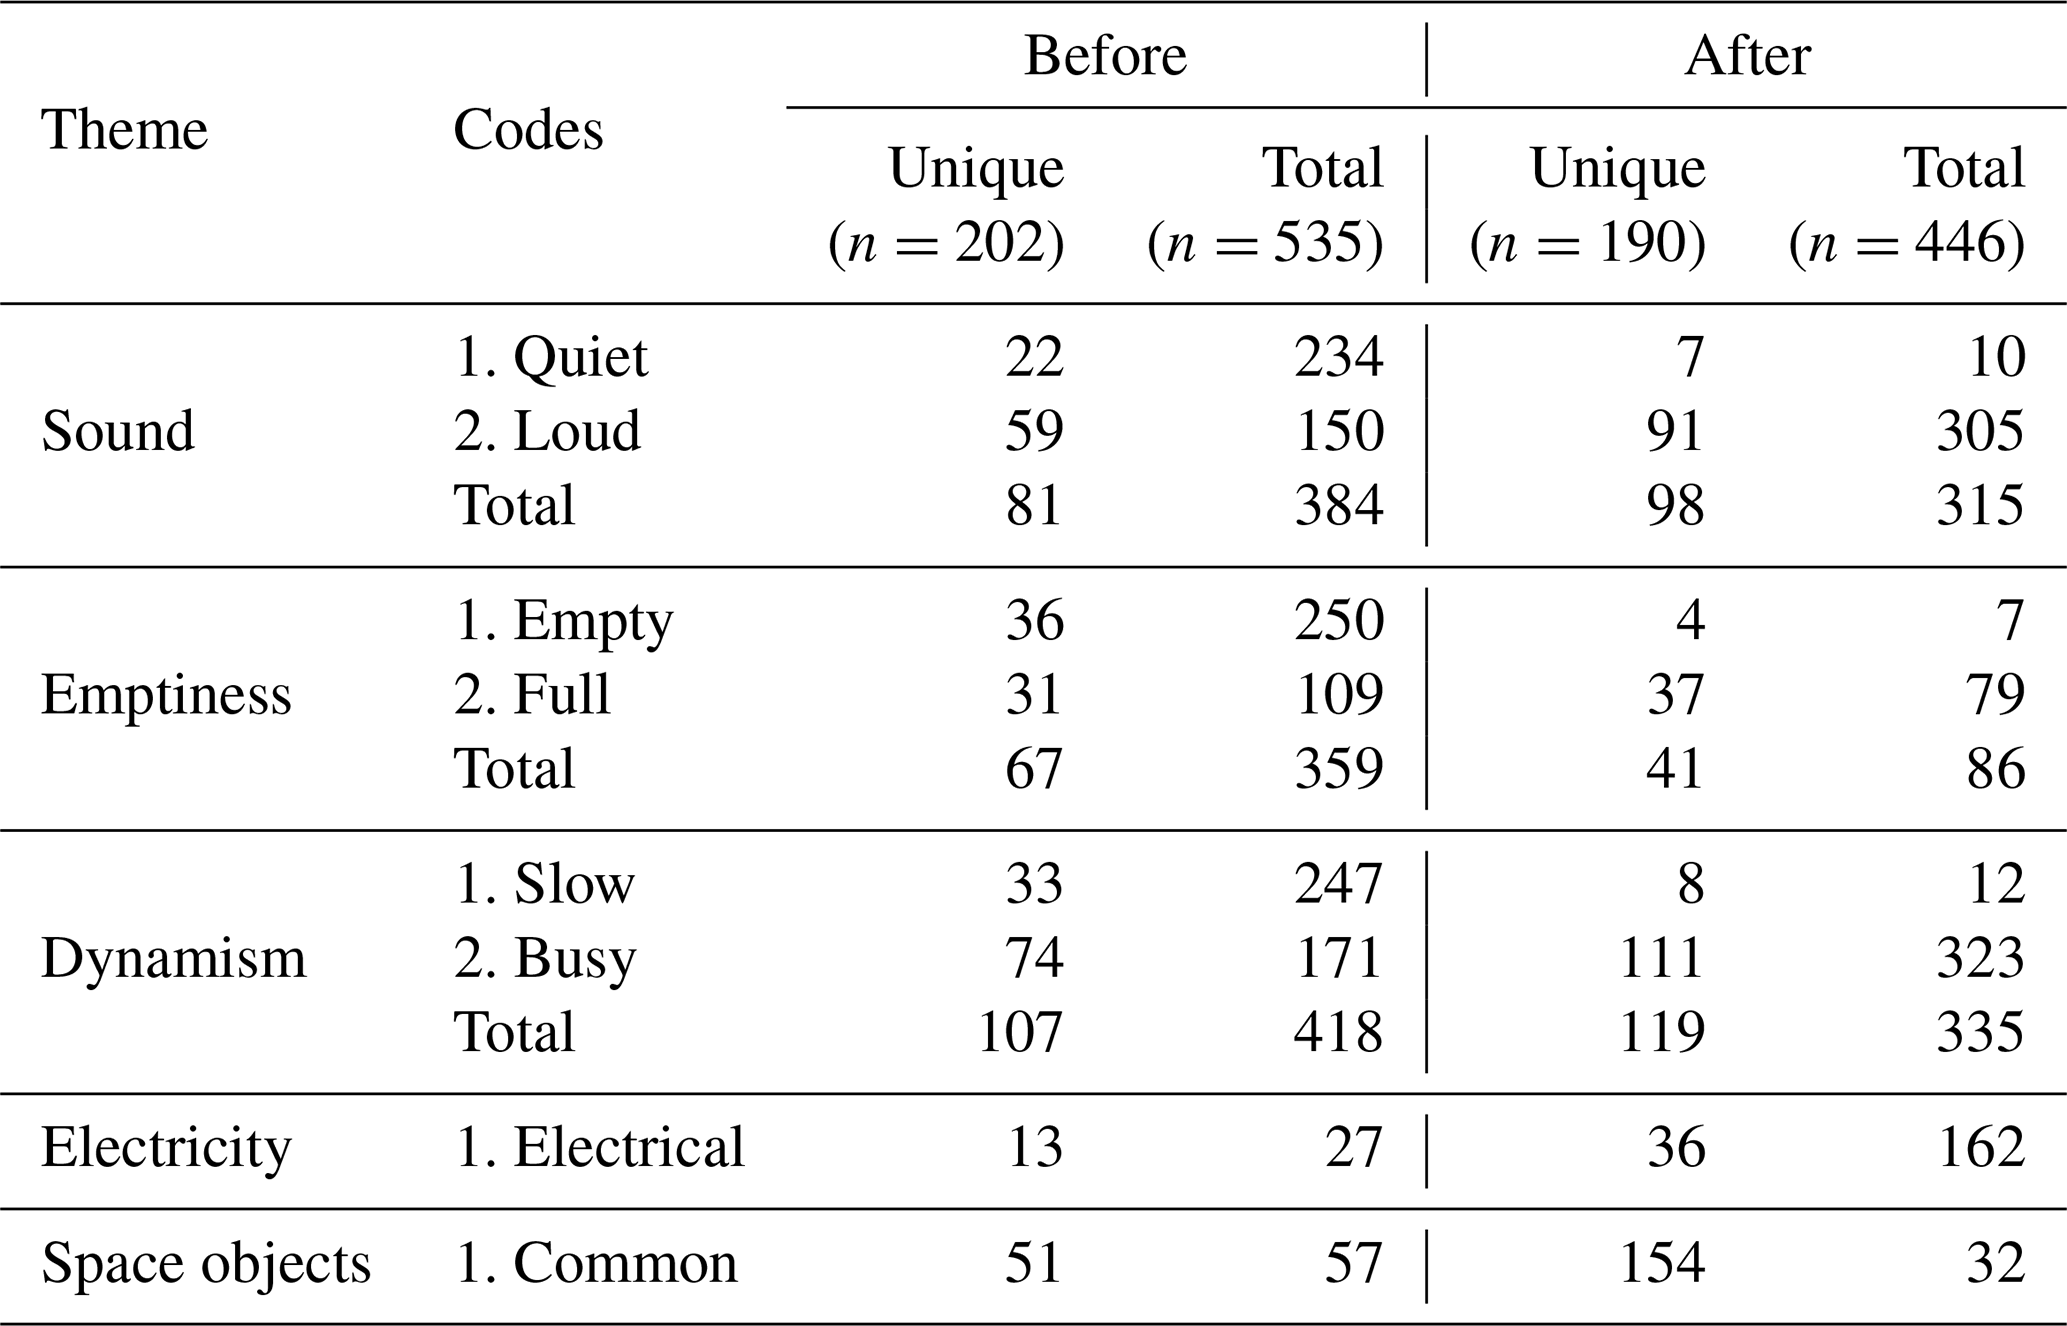
Table B2Statistical comparison of the number of unique words in each qualitative code as judged by different coders across a subset of the data (the top 16 words before and 15 words after).
Data supporting the findings are contained within the article and the Supplement.
The supplement related to this article is available online at: https://doi.org/10.5194/gc-4-57-2021-supplement.
MOA conceived the project and its evaluation, performed the analysis, and wrote the paper. ND and SB assisted with the analysis.
The authors declare that they have no conflict of interest.
We thank the researchers (Alice Giroul, Christopher Chen, Emma Davies, Jesse Coburn, Joe Eggington, Luca Franci, and Oleg Shebanits) and the undergraduate ambassadors (Avishan Shahryari, Cheng Yeen Pak, Christopher Comiskey Erazo, Habibah Khanom, Safiya Merali, and Yinyi Liu), who helped deliver the exhibit, along with all the staff at the Science Museum (including Becky Carlyle, Imogen Small, and Sevinc Kisacik). Martin O. Archer holds a UKRI (STFC/EPSRC) Stephen Hawking Fellowship.
This research has been supported by the Queen Mary University of London (Centre for Public Engagement Large Award 2016 and Centre for Public Engagement Small Award 2019), the European Geosciences Union (Public Engagement Grant 2017), the Science and Technology Facilities Council (grant no. ST/R001456/1), and the UK Research and Innovation (grant no. EP/T01735X/1).
This paper was edited by Mathew Stiller-Reeve and reviewed by John Coxon, Victoria Engelschiøn, and one anonymous referee.
3KQ and Collingwood Environmental Planning: Space weather public dialogue, Tech. rep., Sciencewise, Science and Technology Facilities Council, RAL Space, Natural Environment Research Council, National Grid, Lloyd's of London, available at: https://www.ralspace.stfc.ac.uk/Pages/SWPDFinalReportWEB.pdf (last access: 1 October 2020), 2015. a
Agresti, A.: An Introduction to Categorical Data Analysis (Second Edition), Wiley Series in Probability and Statistics, John Wiley & Sons, Inc., Hoboken, New Jersey, USA, https://doi.org/10.1002/0470114754, 2007. a
Alexander, R. L., Gilbert, J. A., Landi, E., Simoni, M., Zurbuchen, T. H., and Roberts, D. A.: Audification as a diagnostic tool for exploratory heliospheric data analysis, in: The 17th International Conference on Auditory Display, 20–24 June 2011, Budapest, Hungary, 2011. a
Alexander, R. L., O'Modhrain, S., Roberts, D. A., Gilbert, J. A., and Zurbuchen, T. H.: The bird's ear view of space physics: Audification as a tool for the spectral analysis of time series data, J. Geophys. Res.-Space, 119, 5259–5271, https://doi.org/10.1002/2014JA020025, 2014. a
Archer, L. and DeWitt, J.: Understanding Young People's Science Aspirations: How students form ideas about “becoming a scientist”, Routledge, London, UK, https://doi.org/10.4324/9781315761077, 2017. a, b, c
Archer, M. O.: In space no-one can hear you scream... or can they?, ENT and Audiology News, 28, available at: https://www.entandaudiologynews.com/features/audiology-features/post/in-space-no-one-can-hear-you-scream-or-can-they, last access: 30 November 2020a. a
Archer, M. O.: Space Sound Effects Short Film Festival: using the film festival model to inspire creative art–science and reach new audiences, Geosci. Commun., 3, 147–166, https://doi.org/10.5194/gc-3-147-2020, 2020b. a, b
Archer, M. O., Hartinger, M. D., Redmon, R., Angelopoulos, V., Walsh, B. M., and Eltham Hill School Year 12 Physics students: First results from sonification and exploratory citizen science of magnetospheric ULF waves: Long-lasting decreasing-frequency poloidal field line resonances following geomagnetic storms, Adv. Space Res., 16, 1753–1769, https://doi.org/10.1029/2018SW001988, 2018. a
Baixeries, J., Elvevåg, B., and Ferrer-i-Cancho, R.: The Evolution of the Exponent of Zipf's Law in Language Ontogeny, PLOS ONE, 8, e53227, https://doi.org/10.1371/journal.pone.0053227, 2013. a
Baumjohann, W. and Treumann, R.: Basic Space Plasma Physics, Imperial College Press, London, UK, https://doi.org/10.1142/P850, 2012. a
BERA: Ethical Guidelines for Educational Research, Tech. Rep. Fourth Edition, British Educational Research Association, London, available at: https://www.bera.ac.uk/researchers-resources/publications/ethical-guidelines-for-educational-research-2018 (last access: 30 April 2020), 2018. a
Braun, V. and Clarke, V.: Using thematic analysis in psychology, Qual. Res. Psychol., 3, 77–101, https://doi.org/10.1191/1478088706qp063oa, 2006. a
Caleon, I., Subramaniam, R., and Regaya, M. H. P.: Revisiting the bell-jar demonstration, Phys. Educ., 48, 247–251, https://doi.org/10.1088/0031-9120/48/2/247, 2013. a
Clopper, C. and Pearson, E. S.: The use of confidence or fiducial limits illustrated in the case of the binomial, Biometrika, 26, 404–413, https://doi.org/10.1093/biomet/26.4.404, 1934. a
Feder, T.: Shhhh. Listen to the data, Phys. World, 65, 20–22, https://doi.org/10.1063/PT.3.1550, 2012. a
Galliano, D.: SEPnet Outreach & Public Engagement 2017/18 Reporting, Tech. rep., South East Physics Network, unpublished internal document, 2018. a
Grand, A. and Sardo, A. M.: What Works in the Field? Evaluating Informal Science Events, Front. Commun., 2, 22, https://doi.org/10.3389/fcomm.2017.00022, 2017. a, b, c
Gurnett, D. A., Kurth, W. S., Burlaga, L. F., and Ness, N. F.: In Situ Observations of Interstellar Plasma with Voyager 1, Science, 341, 1489–1492, https://doi.org/10.1126/science.1241681, 2013. a
Hochberg, Y. and Tamhane, A. C.: Multiple Comparison Procedures, Wiley Series in Probability and Statistics, John Wiley & Sons, Inc., Hoboken, New Jersey, USA, https://doi.org/10.1002/9780470316672, 1987. a
Hooper-Green, E.: Measuring Learning Outcomes in Museums, Archives and Libraries: The Learning Impact Research Project (LIRP), I J. Heritage Stud., 10, 151–174, https://doi.org/10.1080/13527250410001692877, 2004. a, b, c
Jensen, E.: The problems with science communication evaluation, J. Sci. Commun, 13, C04, https://doi.org/10.22323/2.13010304, 2014. a, b
Keiling, A., Lee, D.-H., and Nakariakov, V. (Eds.): Low-Frequency Waves in Space Plasmas, 1st edn., Geophys. Monogr. Ser., American Geophysical Union, 1–291, https://doi.org/10.1002/9781119055006, 2016. a, b
King, H., Steiner, K., Hobson, M., Robinson, A., and Clipson, H.: Highlighting the value of evidence-based evaluation: pushing back on demands for “impact”, J. Sci. Commun, 14, A02, https://doi.org/10.22323/2.14020202, 2015. a, b
Kramer, G.: An Introduction to Auditory Display, Auditory Display: Sonification, Audification, and Auditory Interfaces, Addison-Wesley, Reading, MA, USA, 1994. a
Lamers, H. J. G. L. M. and Cassinelli, J. P.: Introduction to stellar winds, Cambridge University Press, Cambridge, UK, 1999. a
Massey, Jr., F. J.: The Kolmogorov-Smirnov Test for Goodness of Fit, J. Am. Stat. Assoc., 46, 68–78, https://doi.org/10.1080/01621459.1951.10500769, 1951. a
Maxwell, J. A.: Using numbers in qualitative research, Qual. Inq., 16, 475–482, https://doi.org/10.1177/1077800410364740, 2010. a
Piantadosi, S. T.: Zipf's word frequency law in natural language: A critical review and future directions, Psychon. Bull. Rev., 21, 1112–1130, https://doi.org/10.3758/s13423-014-0585-6, 2014. a
Public Engagement with Research team: Little Book of Evaluation Tools: Curiosity Carnival, Tech. rep., University of Oxford, available at: https://www.mpls.ox.ac.uk/public-engagement/latest/little-book-of-evaluation-tools-curiosity-carnival (last access: 31 August 2020), 2019. a, b, c
Robinson, D. W. and Dadson, R. S.: A re-determination of the equal-loudness relations for pure tones, Br. J. Appl. Phys., 7, 166, https://doi.org/10.1088/0508-3443/7/5/302, 1956. a
Robson, C.: Real World Research, John Wiley and Sons Ltd., Hoboken, New Jersey, USA, 2011. a
Roeser, R., Valente, M., and Hosford-Dunn, H.: Audiology: Diagnosis, Thieme, New York, USA, 2007. a
Sandelowski, M.: Real qualitative researchers do not count: The use of numbers in qualitative research, Res. Nurs. Health, 24, 230–240, https://doi.org/10.1002/nur.1025, 2001. a
Sandelowski, M., Voils, C. I., and Knafl, G.: On quantizing, J. Mix. Methods Res., 3, 208–222, https://doi.org/10.1177/1558689809334210, 2009. a
Science Museum Group: Inspiring futures: Strategic priorities 2017–2030, Tech. rep., Science Museum Group, London, UK, available at: https://www.sciencemuseumgroup.org.uk/wp-content/uploads/2020/05/SMG-Inspiring-Futures-May-2020.pdf (last access: 17 February 2021), 2017. a
Science Museum Group: Engaging all audiences with science: Science capital and informal science learning, Tech. rep., Science Museum Group, London, UK, available at: https://learning.sciencemuseumgroup.org.uk/blog/engaging-all- audiences-with-science-science-capital-and-informal-science-learning/, last access: 31 August 2020. a
Silverman, D.: Doing Qualitative Research: A Practical Handbook,, Sage Publications Ltd., Thousand Oaks, California, USA, 2010. a
Supper, A.: Sublime frequencies: the construction of sublime listening experiences in the sonification of scientific data, Soc. Stud. Sci., 44, 34–58, https://doi.org/10.1177/0306312713496875, 2014. a, b
Zipf, G. K.: The psycho-biology of language, Houghton Mifflin, Boston, MA, USA, 1935. a
Zipf, G. K.: Human behavior and the principle of least effort, Addison-Wesley Press, Boston, MA, USA, 1949. a