the Creative Commons Attribution 4.0 License.
the Creative Commons Attribution 4.0 License.
Ozone measurement practice in the laboratory using Schönbein's method
Ignacio Arturo Ramirez-Gonzalez
Antonio Cid Samamed
We present a laboratory technique to measure tropospheric ozone, following a traditional method developed by Christian Friedrich Schönbein in the 19th century. The aim is to familiarise students with both the scientific method and the concepts of pollution and climate change, taking advantage of the possibilities of a very cheap hands-on approach over other existing theoretical ones. Also, this teaching activity can help the students to understand the differences between objective and subjective analysis. Moreover, they can make effective use of new technologies and photography. We include a description of how to conduct the lesson at two different levels of complexity (advanced and basic) to allow us to adapt it to the capacity of the students. The advanced level includes the production in the lab of paper strips as they were produced in the 19th century, whilst the basic level does not. This practice is suitable for use by both high school and first-year undergraduate students and was presented in high schools during a communication campaign to celebrate the annual Galician Scientist Day. We evaluate the teaching approach used through the results from collected surveys and feedback received from the students and teachers.
- Article
(5398 KB) - Full-text XML
-
Supplement
(416 KB) - BibTeX
- EndNote
Ozone (O3) occurs in gaseous form in the Earth's atmosphere (Fabian and Dameris, 2014; Añel, 2016a). An allotropic form of oxygen (O2) formed by three oxygen atoms, it has a blueish colour, which it is possible to observe when it is in large concentrations. It is well known for its existence in the famous “ozone layer” of the stratosphere (Añel, 2016b), which protects us from ultraviolet radiation, thanks to the fact that its absorption band is in the ultraviolet spectrum (Hartley band: 200–300 nm). However, the work that we introduce here focuses on O3 in the troposphere, the atmospheric layer closest to the Earth's surface in which all living organisms are found. This O3 that surrounds us, and which we breathe, does not offer protection in the same way that it does in the stratosphere. The difference lies in its ability to act as a powerful oxidant. In large concentrations, O3 can affect the respiratory systems of living organisms and alter the coverage and healthiness of vegetation. The confusion among pupils about this different role of O3 has been well documented (Myers et al., 2004).
Tropospheric O3 shows a positive trend since the 19th century because of the proliferation of heavy industry, from average values of 10–15 ppbV in the preindustrial era to values at a minimum near 50 ppbV nowadays (Marenco et al., 1994; Fabian and Dameris, 2014). This trend is well documented because, among other methods, preindustrial measurements were possible using Schönbein's technique. This technique is named after Christian Schönbein, who developed it and also discovered O3. It is a rudimentary method based on paper strips impregnated with a solution of potassium iodide (KI) and starch ((C6H10O5)n–(H2O)) in distilled water. There are several versions of the technique, which vary in the concentrations of starch, KI, and paper used. As a result of these different concentrations, in the 19th century were manufactured several types of paper strips to measure O3, which had varying levels of accuracy. The one produced by Jame de Sedan was traditionally the most widely used because it allowed the highest precision (Bojkov, 1986).
Exposed to open air (but protected from sunlight), the KI on the strip reacts with the O3 and the humidity existing in the environment. The strip is exposed for a given period, usually 12 or 24 h, after which it must be collected, taken to a laboratory, and dipped in distilled water. After this, immediately, the strip turns a shade of purple as a function of the concentration of O3 present (Bojkov, 1986). By comparison against a given scale (similar to that shown in Fig. 1), a numerical value can be obtained and linked to an existing O3 concentration in the environment. These values were generally recorded as O3 in the logbooks of observatories (Linvill et al., 1980; Añel et al., 2012, 2017). The choice of the numerical value from Fig. 1 involves a great deal of subjectivity because it depends on each observer, and each one has different physiological features and different abilities in distinguishing colours (Solomon and Lennie, 2007). Also, the existing ambient light can affect the measurement. Therefore, only with experience can an observer reduce the error associated with the subjectivity.

Figure 1Typical scale used to compare colours using two scales: Schönbein (top line) and Berigny (botton line).
Usually, the study of the atmosphere at educational levels (from 13 to 17 years) is focused at best on the use of cheap and small weather stations that measure physical variables (e.g. temperature, pressure, humidity). These kinds of stations are affordable and convenient because of size and installation. However, the study of the atmosphere and the environment needs knowledge of its chemical composition. The lack of a hands-on approach to complement the theoretical learning of the composition and chemistry of the atmosphere can lead to a knowledge gap. Sometimes, this is hindered by the lack of understanding of some essential words and concepts by pupils (Österlind, 2005). For example, climate change and O3 depletion are issues broadly taught in high school classrooms, but mostly from a theoretical approach (documentaries, lectures, etc.). The misconceptions on these issues among the students are well documented (Boyes and Stanisstreet, 1993; Boyes et al., 2004b; McCaffrey and Buhr, 2013), and they seem to remain through the years. This confusion was manifest also in surveys completed by a group of students to whom we presented the practice here described (see Sect. 2). In line with this, the need to develop specific materials to teach these topics better has been noted (Papadimitriou, 2004).
Moreover, O3 and air quality topics are subjects generally unfamiliar amongst high school students; nevertheless, it is a topic that can arouse their interest due to the potential issues involved (Boyes et al., 2004a; Shepardson et al., 2009; Punter et al., 2011; Hagedorn et al., 2019). Therefore, to address this issue, we introduce here a laboratory practice, a hands-on approach that serves as an additional tool for the study of the chemical composition of the atmosphere, based on the old 19th century Schönbein method of measuring tropospheric ozone. The goal is to enable the students to be much more familiar with this topic, as they can measure O3 directly in a very visual way that helps to understand how “dirty” the surrounding atmosphere is. We present the practice as project-based learning, a technique with proven results (Blumenfeld et al., 1991; Bell, 2010). Using this learning method, students developed their skills through “learning-by-doing”.
To make it more accessible to students, we propose two different levels for this laboratory practice. The first could be used by high school students (age range of 12–16), in which the measurement and its subsequent validation are developed using Schönbein's method. The second is more advanced (from high school onwards) and includes the entire process including manufacture and use of the strip, making use of concepts of inorganic and atmospheric chemistry. The main difference is that during the basic one the students only measure; meanwhile, the advanced level consists of the entire process of creating the strips and explaining the concepts of the chemistry involved and the method itself. The educational objectives are to measure O3, to teach the measurement of environmental pollution to students, and to highlight the difference between subjective and objective analysis. We propose the use of this scientific method to identify these differences.
This practice can be used as experience and demonstration of the development work that underpins all scientific activity. It allows students to become acquainted with the scientists' profession; this method is currently used when dealing with the recovery of old meteorological data. The authors are well aware of the existence of a previous technical report (Fukushima, 1993) on this topic. Nevertheless, we propose to take the work a step further. Our work incorporates photos and graphics, adds the possibility of applying new technologies (a specific free software, helping to understand how science works; Pfaffman, 2008), and lets us achieve objective measurements.
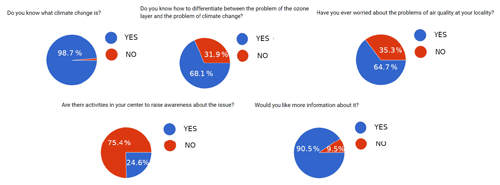
Figure 2The five most relevant questions related to knowledge acquired through practice: “Do you know what climate change is?” received almost universally positive responses; “Do you know how to differentiate between the problem of climate change and the problem of the ozone layer?” resulted in around one-third negative answers; “Have you ever worried about the problems of air quality in your neighbourhood?” received the proportion of responses as the previous question; “Are there activities in your area to raise awareness of this issue?” produced three-quarters negative response; “Would you like more information about it?” received almost universally positive answers.
To better understand the background knowledge of the students and the need for the teaching approach that we developed, we presented the technique to students in 10 Galician high schools (approx. 350 students). From this group, 243 students replied to a survey about their knowledge of general environmental issues, such as climate change, pollution, and ozone, and the steps taken to raise awareness of these issues. The age range of the students who responded to the survey was 12–19, with an approximately equal gender balance (51 % males, 49 % females). The survey (we offered the possibility of completing it in person and delivering it in a printed form or online) consisted of 19 questions (see the Supplement), of which we discuss the five most relevant in terms of the knowledge to be acquired through the use of the technique. By analysing the responses, we obtained the following results (see Fig. 2). Taking each question in turn, “Do you know what climate change is?” received an almost universally positive answer (98.7 %); “Do you know how to differentiate between the problem of climate change and the problem of the ozone layer?” resulted in one-third negative answers (31.9 %); “Have you ever worried about the problems of air quality in your neighbourhood?” produced a very close value to the one of the previous question (35.3 %); “Are there activities in your area to raise awareness of this issue?” produced three-quarters negative responses (75.4 %); and “Would you like more information about it?” received almost universally positive answers (90.5 %). These results reinforce the idea that students have gaps in their knowledge of these subjects and that they know they have them. Also, the need to include more content on these issues in the curriculum was acknowledged in the surveys that we carried out (see Fig. 3). This is in line with what was suggested by Papadimitriou (2004).
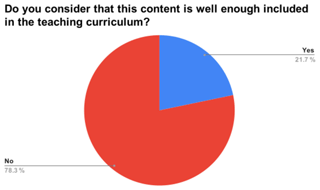
Figure 3Perception of the pupils of the contents included in the curriculum on the topics of climate change and atmospheric pollution.
Therefore, it is necessary to have activities that raise the student's awareness of these issues, responding to the needs expressed by themselves. Hence we present next a practice that meets these requirements by addressing a knowledge gap, using a hands-on approach that allows better visualisation of the concept of atmospheric pollution, and using new technologies. The approach also lets students reflect on concepts of measurement error, the history of science, and the scientific method.
In the following sections, we discuss the ethical considerations relevant for the work here performed and show the teaching approach used and the results obtained with it. Finally, we extract some conclusions on this experience and the result of the laboratory practice.
During this research, we guaranteed the anonymity of the persons answering the surveys and preserved this during the publication of the results. Because of the nature of the experiment, we did not need previous clearance from the commission of ethics of our research centres. We had to follow the rules approved by the Universidade de Vigo, where the project was funded, and the work developed. These rules are available in the document “Ethical Recommendations in Research by the Universidade de Vigo” (https://www.uvigo.gal/sites/uvigo.gal/files/contents/paragraph-file/2019-06/Ethical_Recommendations_1.pdf, last access: 28 April 2020).
Based on the idea of “learning by doing”, project-based learning (PBL) is a student-centred pedagogy that involves a dynamic classroom approach (Blumenfeld et al., 1991). That means students manage all the activities by themselves, gathering information and responding to a complex question, challenge, or problem. In this case, the topic is air quality, focused on ozone. As an introduction to the activity, a theoretical class is proposed to the students. After it, all the information related to the laboratory practice is presented, and the groups of students can distribute the work. In the next section, we explain the laboratory practice itself.
As previously explained, we have created two levels of test, one basic and one more advanced. Both levels serve the purpose of studying the environment, through a better understanding of O3 and atmospheric chemistry in general. Moreover, the advanced level includes a part suitable for teaching inorganic chemistry in the laboratory, through the making of the O3 measurement strips by the students. Next, we explain the more advanced one, which also includes the essential elements of the basic version.
5.1 Advanced level
This level of the practice is designed for high school and first-year college students. The following materials are required (Fig. 4 shows some of them).
Materials
-
potassium iodide (KI)
-
starch ((C6H10O5))
-
drying paper
-
distilled water
-
self-closing bags
Instrumentation
-
beakers
-
balance
-
rods
-
stove
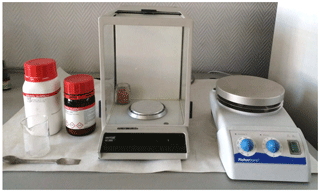
Figure 4Instrumentation and materials (potassium iodide, starch, rods, beakers, balance, and stove).
The next stage consists of two parts: making the strips and using them for the measurements. To make the strips, we follow the instructions of Jame de Sedan (these strips were the most widely used throughout the 19th century) in different studies. We use a solution of KI and starch in distilled water, via the following steps.
-
100 mL of distilled water is poured into a beaker, which is heated up to a temperature of around 80 ∘C (it should be checked with a thermometer submerged).
-
10 g of starch is added to the beaker with stirring until a gelatinous mixture is obtained (taking care not to boil because the resulting chains of polysaccharides could be broken).
-
1 g of KI is added with stirring until homogeneous.
-
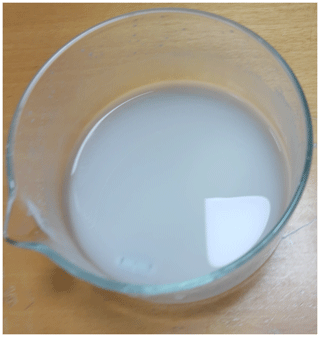
The resulting mixture (see Fig. 5) is allowed to cool in a location shaded from sunlight. When it is cool, the drying paper or filter strips are impregnated with it (for example using a brush or dipping them) for about 6 h and then removed.
-
After this, the strips are removed from the solution and allowed to dry horizontally for 2 h (also protected from sunlight and in an environment without O3 as they are already reactive).
-
When the strips are dry, they are stored in self-closing bags.
To dry the strips, we propose using boxes of any appropriate material, for example, cardboard, in which the strips are allowed to dry for 12 h. Next, they are stored in airtight bags shaded from sunlight until they are used for the measurements. The strips should be protected from inclement weather and sunlight. A faster option that can work under certain conditions is to dry them inside a microwave.
After manufacturing the strips, the measurements can be done. Because the strips must be allowed to dry, which cannot happen in just a few hours with the traditional technique, it is recommended that the laboratory practice is run in this case over 2 d. The procedure for measurement and data collection is straightforward. It consists of exposing the strip outdoors, protected from sunlight, for 12 or 24 h (in this case, 24 h may be preferable due to the timing of the school day). Then, the strip is collected and wetted with distilled water. Doing this, it turns from white to blueish purple. The degree of colouration is compared with the given scale (see Fig. 1). Then the pupils can measure the value and enter it on a blank sheet, which we also provide (see Table 1).
If possible, part of the experiment could involve the students making a series of measurements over a while (e.g. 2 weeks) to measure different atmospheric conditions. This would help to highlight the changes in O3 concentration and colouration of the collected strips. Also, it would be desirable to compare the values obtained with data from the nearest state-of-the-art ozonometer (usually available on the Internet from official air quality monitoring networks), to gain a better understanding of the procedure and O3 measurement in general. This part would enable students to understand that although O3 mixes locally in a very homogeneous manner, there can exist considerable differences between different places in the same neighbourhood due to the various factors that affect it. It would also allow the assessment of the reliability and validity of the Schönbein method. Furthermore, to measure in situ, it is possible to buy a hand-held ozonometer, much cheaper than a fixed one. For example, the S200, S300, and S500 models from Aeroqual (https://www.aeroqual.com/, last access: 28 April 2020) have been shown to be useful (Lin et al., 2015).
5.2 Basic level
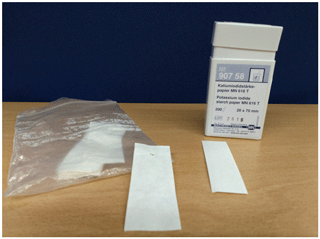
This level differs from the advanced one in the making of the strips. It avoids the potential difficulty in accessing all the materials and the necessary laboratory work behind this. There is an option to buy the strips from a supplier (for example, Sigma-Aldrich “Potassium Iodide Starch Paper ref.37215”) and to perform the measurements using them. In this way, even students in the first year of secondary school could carry out the experiments (Fig. 6 compares strips made by ourselves with commercially available strips to highlight the differences). The remainder of the technique is the same as it is for the advanced level.
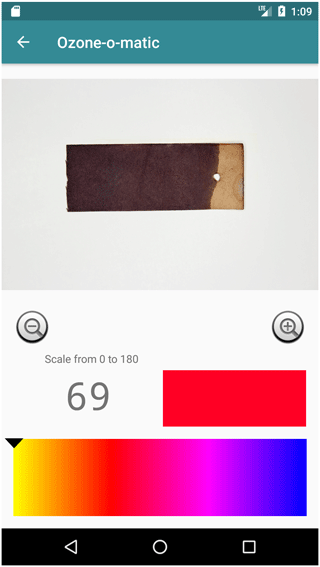
Our own experience suggests that it takes some time to acquire the necessary degree of consistency and accuracy in the measurements. The availability of photographic and computational tools means that it is possible to eliminate all human error in terms of colour choice, and a method free from human subjectivity is thus possible. To this end, our setup consists of a camera assembly, under controlled light and focal length conditions, and a software package developed to ensure the precision of the result according to the correct shade of colour. The software (O3Meter) is available from Google Play (https://play.google.com, last access: 28 April 2020) or a Github repository (https://github.com/EPhysLab-UVigo/O3METER, last access: 28 April 2020) and works on Android devices or a personal computer. It uses a graduated scale of the whole colour spectrum that the strip can take. From this, a pixel-by-pixel scaled comparison algorithm provides an output with a numerical value within that scale (Ramírez-González et al., 2020). This application (see Fig. 7) facilitates the use of the technique by students. In essence, all they need is a mobile phone with a camera, a shoebox and a light from a mobile phone, or possibly a torch or some other device with a light bulb (e.g. a second mobile phone with a lamp). Everything is assembled by placing the strip inside the box, and photographs can be taken through an opening in the box (a second hole is required to allow illumination of the strip by the light source). It is understood that errors of measurement are possible, and there could be some variability in the controlled lighting conditions. Still, for educational purposes, it is also useful and entirely acceptable to discuss these errors. The image obtained is then processed using the software, and an objective ozone measurement is achieved.
5.3 Discussing the results with the students
After obtaining the results, the students must debate the subjectivity of the measurements. As mentioned earlier in this paper, the measurement depends very much on the capacity of the observer. For this reason, we propose the following activity after the first 24 h of the experiment. Different students should evaluate the colour of the strips and write down the results without discussing them with anyone. These results would then be shared and the difference between the measurements debated. The observation conditions could be altered (more or less lighting, less observation time, differences when comparing using the given scale, etc.) to expand on the possibility of different measurements. All this information would be noted and would form part of the debate allowing different points of view to be discussed. It is in this ensuing debate that we would wish students to become familiar with the scientific method (Añel, 2019). The differences would help them to be aware that all experiments to be compared must be carried out under the same conditions and with some understanding of the bias that accompanies each measurement.
As previously discussed, we presented the technique in 10 Galician high schools (to more than 350 students), and it was well received in the student environment and by local media (Diario de Lemos, 2017; La Voz de Galicia, 2017). Figure 8 shows the responses of the students to another two crucial questions. Taking each question in turn, “Are there other activities in your high school that let you learn about this topic?” received almost three-quarters negative answers. After presenting the practice and the issue of O3 measurement to the students, the question “Would you like to know more about this topic?” received 9 out of 10 positive responses. By the same token, we can assume that there is a lack of activities and that students want more events like the one here proposed. Therefore, as Vennix et al. (2018) noted in previous work, the outreach activities by universities (such as the one here developed) can be a great tool to increase pupils' motivation towards STEM disciplines.
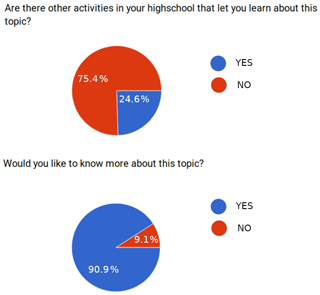
Figure 8Results of two relevant questions related to the interest of students about the laboratory practice and aroused interest.
Additionally, we gathered information about this activity from the teachers in the high schools that we visited. As an example, we include next the comments by the teachers from one of the high schools, the IES Pontepedriña.
In general, any activity that is carried out with students and people different from the teaching staff has great value since it reinforces the teacher and the contents that are worked on in the classroom. On the other hand, everything that is experimental, or in some way possible to see, is better for the students provided that it has a theoretical basis (it usually is better if the theory is taught before the experience, although doing it inversely can be an incentive for the students to continue researching). If the experience is simple and playful too, then the success of it and the improvement of learning are guaranteed.
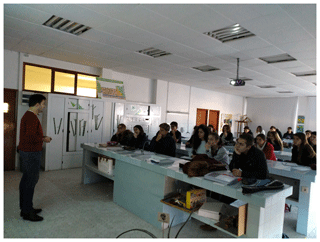
Figure 9 shows an introductory class in the technique; here it is being presented to high school students.
Our practice has the advantage of being extremely cheap in terms of student ∕ practice ratio. The cost per application ranges between EUR 200 and 300 per group of 1000 students (1000 strips for 1 year). The use of low-cost materials and the simplicity of assembly are most attractive when the test is used in the classroom. Most importantly, teachers can follow the instructions and carry out the activity themselves. This work was presented during a meeting of the Royal Spanish Society of Physics in the Symposium on Teaching of Physics (Añel et al., 2018), and some of the attendees approached us, requesting the information necessary to develop this laboratory practice in their high schools.
Retrospectively, and from the feedback by the teachers, our subjective perception is that they are differences in the understanding of the practice between students receiving a theoretical lesson on atmospheric pollution before explaining the laboratory practice and those that do not receive it. Therefore, we conclude that it is important to provide some theoretical background to the students on the topic of atmospheric pollution and its historical context before doing the practice. Also, when visiting the high schools, we took with us a portable Aeroqual O3 monitor (cited in the previous section). This device continues to be pretty expensive (approx. EUR 600), but if it is possible, it can be an excellent complement to this laboratory practice, making more visual the differences between subjective and objective measurements. However, the simple use of an app such as “O3Meter” can improve the teaching process in environmental sciences, something already proved in several previous works (Abner and Baytar, 2016; Kalogiannakis and Papadakis, 2017; Alonso-Martínez et al., 2019).
Reflecting on the teaching technique used, we consider a hands-on practice to be the right approach to cover the students' knowledge gaps pointed out earlier. In this vein, Genc (2014) pointed out that some trainee teachers found PBL to be a useful tool for the teaching of environmental issues, and Lord (1999) proved that a constructivist method (as PBL is) offers advantages over traditional teaching techniques. However, the negative point is that this type of learning is much more time-consuming than other approaches. This can be particularly true for the laboratory practice that we have described here, as producing the paper strips could take 2 or 3 d and exposing them at least 1 d more. Therefore, we recommend that it is taught transversally along several days of the course. A shortcoming of our work is that we did not evaluate a priori the motivation of the students, something that could have a positive impact on the success of the teaching approach.
The teaching practice proposed here allows students to become familiar with questions of physics and atmospheric chemistry, concepts of atmospheric pollution, and basic meteorology. Moreover, it can improve the understanding of the pupils of the scientific method, through the comparison of subjective and objective measurement techniques and the use of free software, the best option for teaching and learning (Stallman, 2020) and that corresponds to the right application of the scientific method (Añel, 2011). It also allows them to deepen their knowledge of the history of science, related to the hole in the ozone layer, the development of ways to measure air quality, and the influence of new technologies in measurement. All this can be done by putting into context the existence of previous work on the recovery of old ozone measurements based on the method of Schönbein (Linvill et al., 1980; Cartalis and Varotsos, 1994; Pavelin et al., 1999). Also, this practice and all the outreach activities included (visits and talks in high schools and media involvement) helped to raise the science capital (Archer et al., 2015) of the pupils and the general public, something that has proven to be extremely necessary (Kudenko and Gras-Velázquez, 2016).
After conducting these experiments, it is expected that students will acquire basic knowledge about O3 (understanding the difference between “good” and “bad” ozone, for example), together with an understanding of the scientific method and air quality. As mentioned above, we have presented the technique to students in 10 Galician high schools (to more than 350 students) and were pleased to see its widespread acceptance. We witnessed the initial ignorance of the subject that students had and the curiosity that is awakened in them when they develop exercises such as these. We believe its success was at least partially due to the excellent disposition of the students towards new knowledge, together with the cooperation of the high schools themselves.
Moreover, the cost of the material to develop the practice is very affordable, making it accessible even to those with fewer resources. Additionally, it can be taught at different educational levels, adapting its complexity according to the needs of the students. Finally, both the results from the surveys and the positive feedback from the teachers (after presenting the practice in high schools and at one conference) let us trust the success and validity of the proposal that we have developed.
The only data of application to this work are the responses to the surveys by the students. These surveys were collected both in print and online. They are guarded at the University of Vigo by the authors of the work.
The supplement related to this article is available online at: https://doi.org/10.5194/gc-3-99-2020-supplement.
All the authors contributed equally to the design of the work, experiments with paper strips, and writing of the paper. IARG and JAA obtained the funding, visited the high schools, and contributed to the design of the software. IARG processed the results of the surveys.
The authors declare that they have no conflict of interest.
We acknowledge funding by the Xunta de Galicia through grant no. ED431F 2016/15, the European Regional Development Fund (ERDF), and the Social Council of the Universidade de Vigo. Juan Antonio Añel is supported by Ramón y Cajal grant no. RyC-2013-14560. Antonio Cid Samamed acknowledges the Unidade de Ciências Biomoleculares Aplicadas-UCIBIO, which is financed by national funds from FCT/MEC (UID/Multi/04378/2013), co-financed by the ERDF under the PT2020 Partnership Agreement (POCI-01-0145-FEDER007728), and supported by the Associate Laboratory for Green Chemistry-LAQV, which is financed by national funds from FCT/MCTES (UID/QUI/50006/2019). This work was also supported by Applied Molecular Biosciences Unit-UCIBIO, which is financed by national funds from FCT/MCTES (UID/Multi/04378/2019). We would also like to thank the high schools of Galicia for letting us work with them. Finally, we would like to thank two anonymous referees for their feedback and the editor John K. Hillier for his recommendations to improve this work.
Antonio Cid Samamed acknowledges his contract to Facultade de Ciências e Tecnología of the Nova University of Lisbon. This work was supported by the Associate Laboratory for Green Chemistry-LAQV, which is financed by national funds from FCT/MCTES (grant no. UIBD/50006/2020), and by the Applied Molecular Biosciences Unit-UCIBIO, which is funded by national funds from FCT (grant no. UIBD/04378/2020).
This research has been supported by the Xunta de Galicia (grant no. ED431F 2016/15), the Consello Social da Universidade de Vigo (grant no. 2019), the Ramón y Cajal (grant no. RyC-2013-14560), the FCT/MEC (grant no. UID/Multi/04378/2013), and the PT2020 Partnership Agreement (grant no. POCI-01-0145-FEDER-007728).
This paper was edited by John K. Hillier and reviewed by two anonymous referees.
Abner, M. and Baytar, F.: Can Apps Encourage Engaged Learning in a Sustainability Course?, in: International Textile and Apparel Association (ITAA) Annual Conference Proceedings, available at: https://lib.dr.iastate.edu/itaa_proceedings/2016/presentations/27 (last access: 28 April 2020), 2016. a
Alonso-Martínez, D., Jiménez-Parra, B., González-Álvarez, N., Godos-Díez, J.-L., and Cabeza-García, L.: Taking Advantage of Students' Passion for Apps in Sustainability and CSR Teaching, Sustainability, 11, 779, https://doi.org/10.3390/su11030779, 2019. a
Añel, J. A.: The importance of reviewing the code, Commun. ACM, 54, 40–41, https://doi.org/10.1145/1941487.1941502, 2011. a
Añel, J. A.: Atmospheric ozone: historical background and state-of-the-art, Contemp. Phys., 57, 417–420, https://doi.org/10.1080/00107514.2016.1156748, 2016a. a
Añel, J. A.: The stratosphere: history and future a century after its discovery, Contemp. Phys., 57, 230–233, https://doi.org/10.1080/00107514.2015.1029521, 2016b. a
Añel, J. A.: Reflections on the Scientific Method at the beginning of the twenty-first century, Contemp. Phys., 60, 60–62, https://doi.org/10.1080/00107514.2019.1579863, 2019. a
Añel, J. A., Blanco-Durán, M., Gimeno, L., and de la Torre, L.: Recovery of Meteorological Data for the Observatory of A Guarda, Spain, PLOS ONE, 7, e39281, https://doi.org/10.1371/journal.pone.0039281, 2012. a
Añel, J. A., Sáenz, G., Ramírez-González, I. A., Polychroniadou, E., Vidal-Mina, R., Gimeno, L., and de la Torre, L.: Obtaining meteorological data from historical newspapers: La Integridad, Weather, 72, 366–371, https://doi.org/10.1002/wea.2841, 2017. a
Añel, J. A., Ramírez-González, I. A., Cid, A., and de la Torre, L.: Diseño de una práctica de laboratorio de medición de ozono según el método de Schönbein, p. 749, Royal Spanish Physics Society, Santiago de Compostela, Spain, 2018. a
Archer, L., Dawson, E., DeWitt, J., Seakins, A., and Wong, B.: “Science capital”: A conceptual, methodological, and empirical argument for extending bourdieusian notions of capital beyond the arts, J. Res. Sci. Teach., 52, 922–948, https://doi.org/10.1002/tea.21227, 2015. a
Bell, S.: Project-Based Learning for the 21st Century: Skills for the Future, The Clearing House: A Journal of Educational Strategies, Issues and Ideas, 83, 39–43, 2010. a
Blumenfeld, P., Soloway, E., Marx, R. W., Krajcik, J. S., Guzdial, M., and Palincsar, A.: Motivating Project-Based Learning: Sustaining the Doing, Supporting the Learning, Educ. Psychol., 26, 369–398, https://doi.org/10.1080/00461520.1991.9653139, 1991. a, b
Bojkov, R. D.: Surface Ozone During the Second Half of the Nineteenth Century, J. Clim. Appl. Meteorol., 25, 343–352, 1986. a, b
Boyes, E. and Stanisstreet, M.: The “Greenhouse Effect”: children's perceptions of causes, consequences and cures, Int. J. Sci. Educ., 15, 531–552, https://doi.org/10.1080/0950069930150507, 1993. a
Boyes, E., Myers, G., Skamp, K., Stanisstreet, M., and Yeung, S.: Air quality: a comparison of students' conceptions and attitudes across the continents, Compare, 37, 425–445, https://doi.org/10.1080/03057920701366176, 2004a. a
Boyes, E., Stanisstreet, M., and Yeung, S. P.: Air Pollution: The Knowledge and Attitudes of Secondary School Students in Hong Kong, Int. Res. Geogr. Env. Educ., 13, 21–37, https://doi.org/10.1080/10382040408668790, 2004b. a
Cartalis, C. and Varotsos, C.: Surface ozone in Athens, Greece, at the beginning and at the end of the twentieth century, Atmos. Environ., 28, 3–8, 1994. a
Diario de Lemos: Conferencia de Ignacio Ramírez, al alumnado del IES Río Cabe, sobre el ozono, available at: https://www.diariodelemos.es/conferencia-de-ignacio-ramirez-al-alumnado-del-ies-rio-cabe-sobre-el-ozono (last access: 28 February 2020), 2017. a
Fabian, P. and Dameris, M.: Ozone in the Atmosphere, Springer-Verlag, Berlin Heidelberg, 2014. a, b
Fukushima, N.: Classroom ozone measurements, Tech. rep., National Center for Atmospheric Research, USA, 1993. a
Genc, M.: The project-based learning approach in environmental education, Int. Res. Geogr. Env. Educ., 24, 105–117, https://doi.org/10.1080/10382046.2014.993169, 2014. a
Hagedorn, G., Kalmus, P., Mann, M., Vicca, S., Van de Berge, J., van Ypersele, J.-P., Bourg, D., Rotmans, J., Kaaronen, R., Rahmstorf, S., Kromp-Kolb, H., Kirchengast, G., Knutti, R., Seneviratne, S. I., Thalmann, P., Cretney, R., Green, A., Anderson, K., Hedberg, M., Nilsson, D., Kuttner, A., and Hayhoe, K.: Concerns of young protesters are justified, Science, 364, 139–140, https://doi.org/10.1126/science.aax3807, 2019. a
Kalogiannakis, M. and Papadakis, S.: Combining mobile technologies in environmental education: a Greek case study, Int. J. Mob. Learn. Organ., 11, 108–130, https://doi.org/10.1504/IJMLO.2017.084272, 2017. a
Kudenko, I. and Gras-Velázquez, À.: The Future of European STEM Workforce: What Secondary School Pupils of Europe Think About STEM Industry and Careers, 223–236, Springer, https://doi.org/10.1007/978-3-319-20074-3_15, 2016. a
La Voz de Galicia: Antes sabíase se ía chover, e iso é un síntoma de que o clima cambia, available at: https://www.lavozdegalicia.es/noticia/lugo/guitiriz/2017/12/20/ span-langgl-sabiase-ia-chover-iso-e-spanspan-langgl-sintoma-clima-cambiaspan/0003_201712L20C79918.htm (last access: 28 February 2020), 2017. a
Lin, C., Gillespie, J., Schuder, M. D., Duberstein, W., Beverland, I. J., and Heal, M. R.: Evaluation and calibration of Aeroqual series 500 portable gas sensors for accurate measurement of ambient ozone and nitrogen dioxide, Atmos. Environ., 100, 111–116, https://doi.org/10.1016/j.atmosenv.2014.11.002, 2015. a
Linvill, D. E., Hooker, W. J., and Olson, B.: Ozone in Michigan's Environment 1876–1880, Mon. Weather Rev., 108, 1883–1891, 1980. a, b
Lord, T. R.: A Comparison Between Traditional and Constructivist Teaching in Environmental Science, 30, 22–27, https://doi.org/10.1080/00958969909601874, 1999. a
Marenco, A., Gouget, H., Nédélec, P., Pagés, J.-P., and Karcher, F.: Evidence of a long-term increase in tropospheric ozone from Pic du Midi data series: Consequences: Positive radiative forcing, J. Geophys. Res., 99, 16617–16632, 1994. a
McCaffrey, M. S. and Buhr, S. M.: Clarifying Climate Confusion: Addressing Systemic Holes, Cognitive Gaps, and Misconceptions Through Climate Literacy, Phys. Geogr., 29, 512–528, https://doi.org/10.2747/0272-3646.29.6.512, 2013. a
Myers, G., Boyes, E., and Stanisstreet, M.: School students' ideas about air pollution: knowledge and attitudes, Res. Sci. Technol. Educ., 22, 133–152, https://doi.org/10.1080/0263514042000290868, 2004. a
Österlind, K.: Concept formation in environmental education: 14‐year olds’ work on the intensified greenhouse effect and the depletion of the ozone layer, Int. J. Sci. Educ., 27, 891–908, https://doi.org/10.1080/09500690500038264, 2005. a
Papadimitriou, V.: Prospective Primary Teachers' Understanding of Climate Change, Greenhouse Effect, and Ozone Layer Depletion, J. Sci. Educ. Technol., 13, 299–307, https://doi.org/10.1023/B:JOST.0000031268.72848.6d, 2004. a, b
Pavelin, E. G., Johnson, C. E., Rughooputh, S., and Toumi, R.: Evaluation of pre-industrial surface ozone measurements made using Schönbein's method, Atmos. Environ., 33, 919–929, 1999. a
Pfaffman, J.: Transforming High School Classrooms with Free/Open Source Software: It's Time for an Open Source Software Revolution, High Sch. J., 91, 25–31, 2008. a
Punter, P., Ochando-Pardo, M., and García, J.: Spanish Secondary School Students' Notions on the Causes and Consequences of Climate Change, Int. J. Sci. Educ., 33, 447–464, https://doi.org/10.1080/09500693.2010.492253, 2011. a
Ramírez-González, I. A., Garcia-Feal, O., Pereiro-Rodríguez, A., and Añel, J. A.: O3METER: a software tool to measure ozone objectively using the Schönbein method, in preparation, 2020. a
Shepardson, D. P., Niyogi, D., Choi, S., and Charusombat, U.: Seventh grade students' conceptions of global warming and climate change, Environ. Educ. Res., 15, 549–570, https://doi.org/10.1080/13504620903114592, 2009. a
Solomon, S. and Lennie, P.: The machinery of colour vision, Nat. Rev. Neurosci., 8, 276–286, https://doi.org/10.1038/nrn2094, 2007. a
Stallman, R.: Why Educational Institutions Should Use and Teach Free Software, available at: https://www.gnu.org/education/edu-schools.html, last access: 18 March 2020. a
Vennix, J., den Brok, P., and Taconis, R.: Do outreach activities in secondary STEM education motivate students and improve their attitudes towards STEM?, Int. J. Sci. Educ., 40, 1263–1283, https://doi.org/10.1080/09500693.2018.1473659, 2018. a
- Abstract
- Introduction
- Student knowledge of environmental issues including ozone
- Ethical considerations
- Teaching method selected
- Detailed description of the proposed session
- Evaluation of the proposed session
- Conclusions
- Data availability
- Author contributions
- Competing interests
- Acknowledgements
- Financial support
- Review statement
- References
- Supplement


