the Creative Commons Attribution 4.0 License.
the Creative Commons Attribution 4.0 License.
 | 05 Mar 2020
Assessing economic impacts of environmental research infrastructures: overview of methodological tools
Régis Kalaydjian
The data generated by environmental research infrastructures (ENV RIs) are key to analysing the quality of general living standards and the conditions of development of environmentally sensitive economic activities: monitoring the atmosphere and ocean is increasingly and critically important in a context marked by the risks caused by global warming.
Given the cost of ENV RIs, their benefits to society, in terms of economic impacts, must be assessed and demonstrated. The primary objective of this article is to review the main tools used to assess the economic impacts of ENV RIs and to propose a methodological framework. The latter classifies the impacts into three categories: (1) upstream impacts on equipment suppliers; (2) downstream impacts on the performance and quality of observational data, monitoring services and forecasts; and (3) feedback impacts in terms of improved knowledge about the environment to the benefit of economic activities. In this framework, the entire data and service supply chain is considered for the assessment of impacts.
An ocean-related case study serves as a practical example: Argo, a global in situ ocean observing system, provides an understanding of the supply chain from upstream suppliers of ENV RIs to primary and processed ocean data providers. It highlights the methodological issues involved in assessing the different categories of impacts.
The article gives precedence to tried and tested methods. It concludes that further work and more data are needed to improve assessment methods.
- Article
(3286 KB) - Full-text XML
- BibTeX
- EndNote


Research infrastructures (RIs) are widely recognized as key components in performing high-level research in many fields. In broad terms, according to the definitions provided by the Organisation for Economic Co-operation and Development (OECD, 2019) and the European Strategy Forum for RIs (ESFRI, 2018), RIs can be defined as facilities, scientific equipment (i.e. sets of instruments, archives and scientific data, and “e-infrastructures” such as computing systems) and other tools required for research and innovation. The two reports highlight the key role of RIs in generating scientific knowledge and knowledge transfer through higher education and training for researchers, technology developers and innovators.
The development of RIs has become essential for government research policies and international strategies aiming to co-ordinate these policies: on an international level, the Megascience Forum created by the OECD in the early 1990s, and later renamed the Global Science Forum (GSF), conducts studies and produces findings and recommendations for governmental actions and international co-operation between its member states in selected fields of which RIs are a major topic. At the level of the European Union (EU), ESFRI was created in 2002 following a recommendation by the European Council to the European Commission (EC). According to its mandate, ESFRI carries out a number of tasks and responsibilities, including the development of an approach to policy-making on RIs in Europe, facilitating initiatives leading to a better use and development of RIs, and establishing the ESFRI Roadmap for RIs for the coming 10–20 years, to be updated as and when necessary.
Despite differences between the objectives of GSF and ESFRI (the latter is specifically dedicated to European RIs), the creation of these two bodies shows the increasing importance of RIs to international organizations in terms of scientific co-operation. The significant financial and human resources involved in developing RIs explain the need to evaluate the return on investment of these infrastructures and inform RI managers and funders of the results: the OECD and ESFRI highlight the need to demonstrate the value of RIs by assessing their economic and social impacts as mentioned in the two reports referenced above. This task is part of the ESFRI Roadmap, and the OECD report offers a set of indicators to assess the impacts of RIs' activities, including scientific, technological and educational impacts.
The present article focuses on Environmental RIs (ENV RIs), an important category of RIs considered by the ESFRI Roadmap, and proposes a methodological framework to assess their economic impacts. This approach is motivated by the urgent issues emphasized by the ESFRI Roadmap and the need to respond to natural and anthropic environmental changes. The report stresses that the effect of pollution and climate change needs “to be fully understood urgently”, as natural hazards “can impact society with large economic deficits”. The report notes that ENV RIs address these issues through general-purpose actions (e.g. supporting education and training; delivering essential data to the public; and producing accurate scientific and technical knowledge) and through specific-purpose actions (e.g. generating coherent time series of key environmental variables; opening access to environmental big data to help promote activities in the private sector; and developing new technologies for sensors, data collection and transfer).
The framework considered hereafter presents an overview of the main impact assessment methods and an ocean-related case study, the Argo observing system; it classifies the economic impacts of ENV RIs into three categories:
-
upstream impacts on equipment and infrastructure supply and maintenance services;
-
downstream impacts on the performance of environmental data and monitoring services;
-
feedback impacts of observations, monitoring and improved forecast services on environmentally sensitive activities in terms of increasing efficiency and risk avoidance.
This classification is motivated by the ESFRI Roadmap and its remarks on the development of new technologies, the provision of long-term data to support downstream environmental services, and, as said above, the urgent need to address major environmental challenges such as climate change.
Upstream impacts (Fig. 1) concern the commercial relationships between infrastructure and equipment suppliers and maintenance service providers and ENV RI developers and operators. Suppliers' performance is boosted by a demand effect from ENV RIs (and conversely, the former enables developers to increase ENV RI efficiency). The economic impacts on suppliers are commonly assessed in terms of turnover, employment, workforce earnings, innovation and exports.
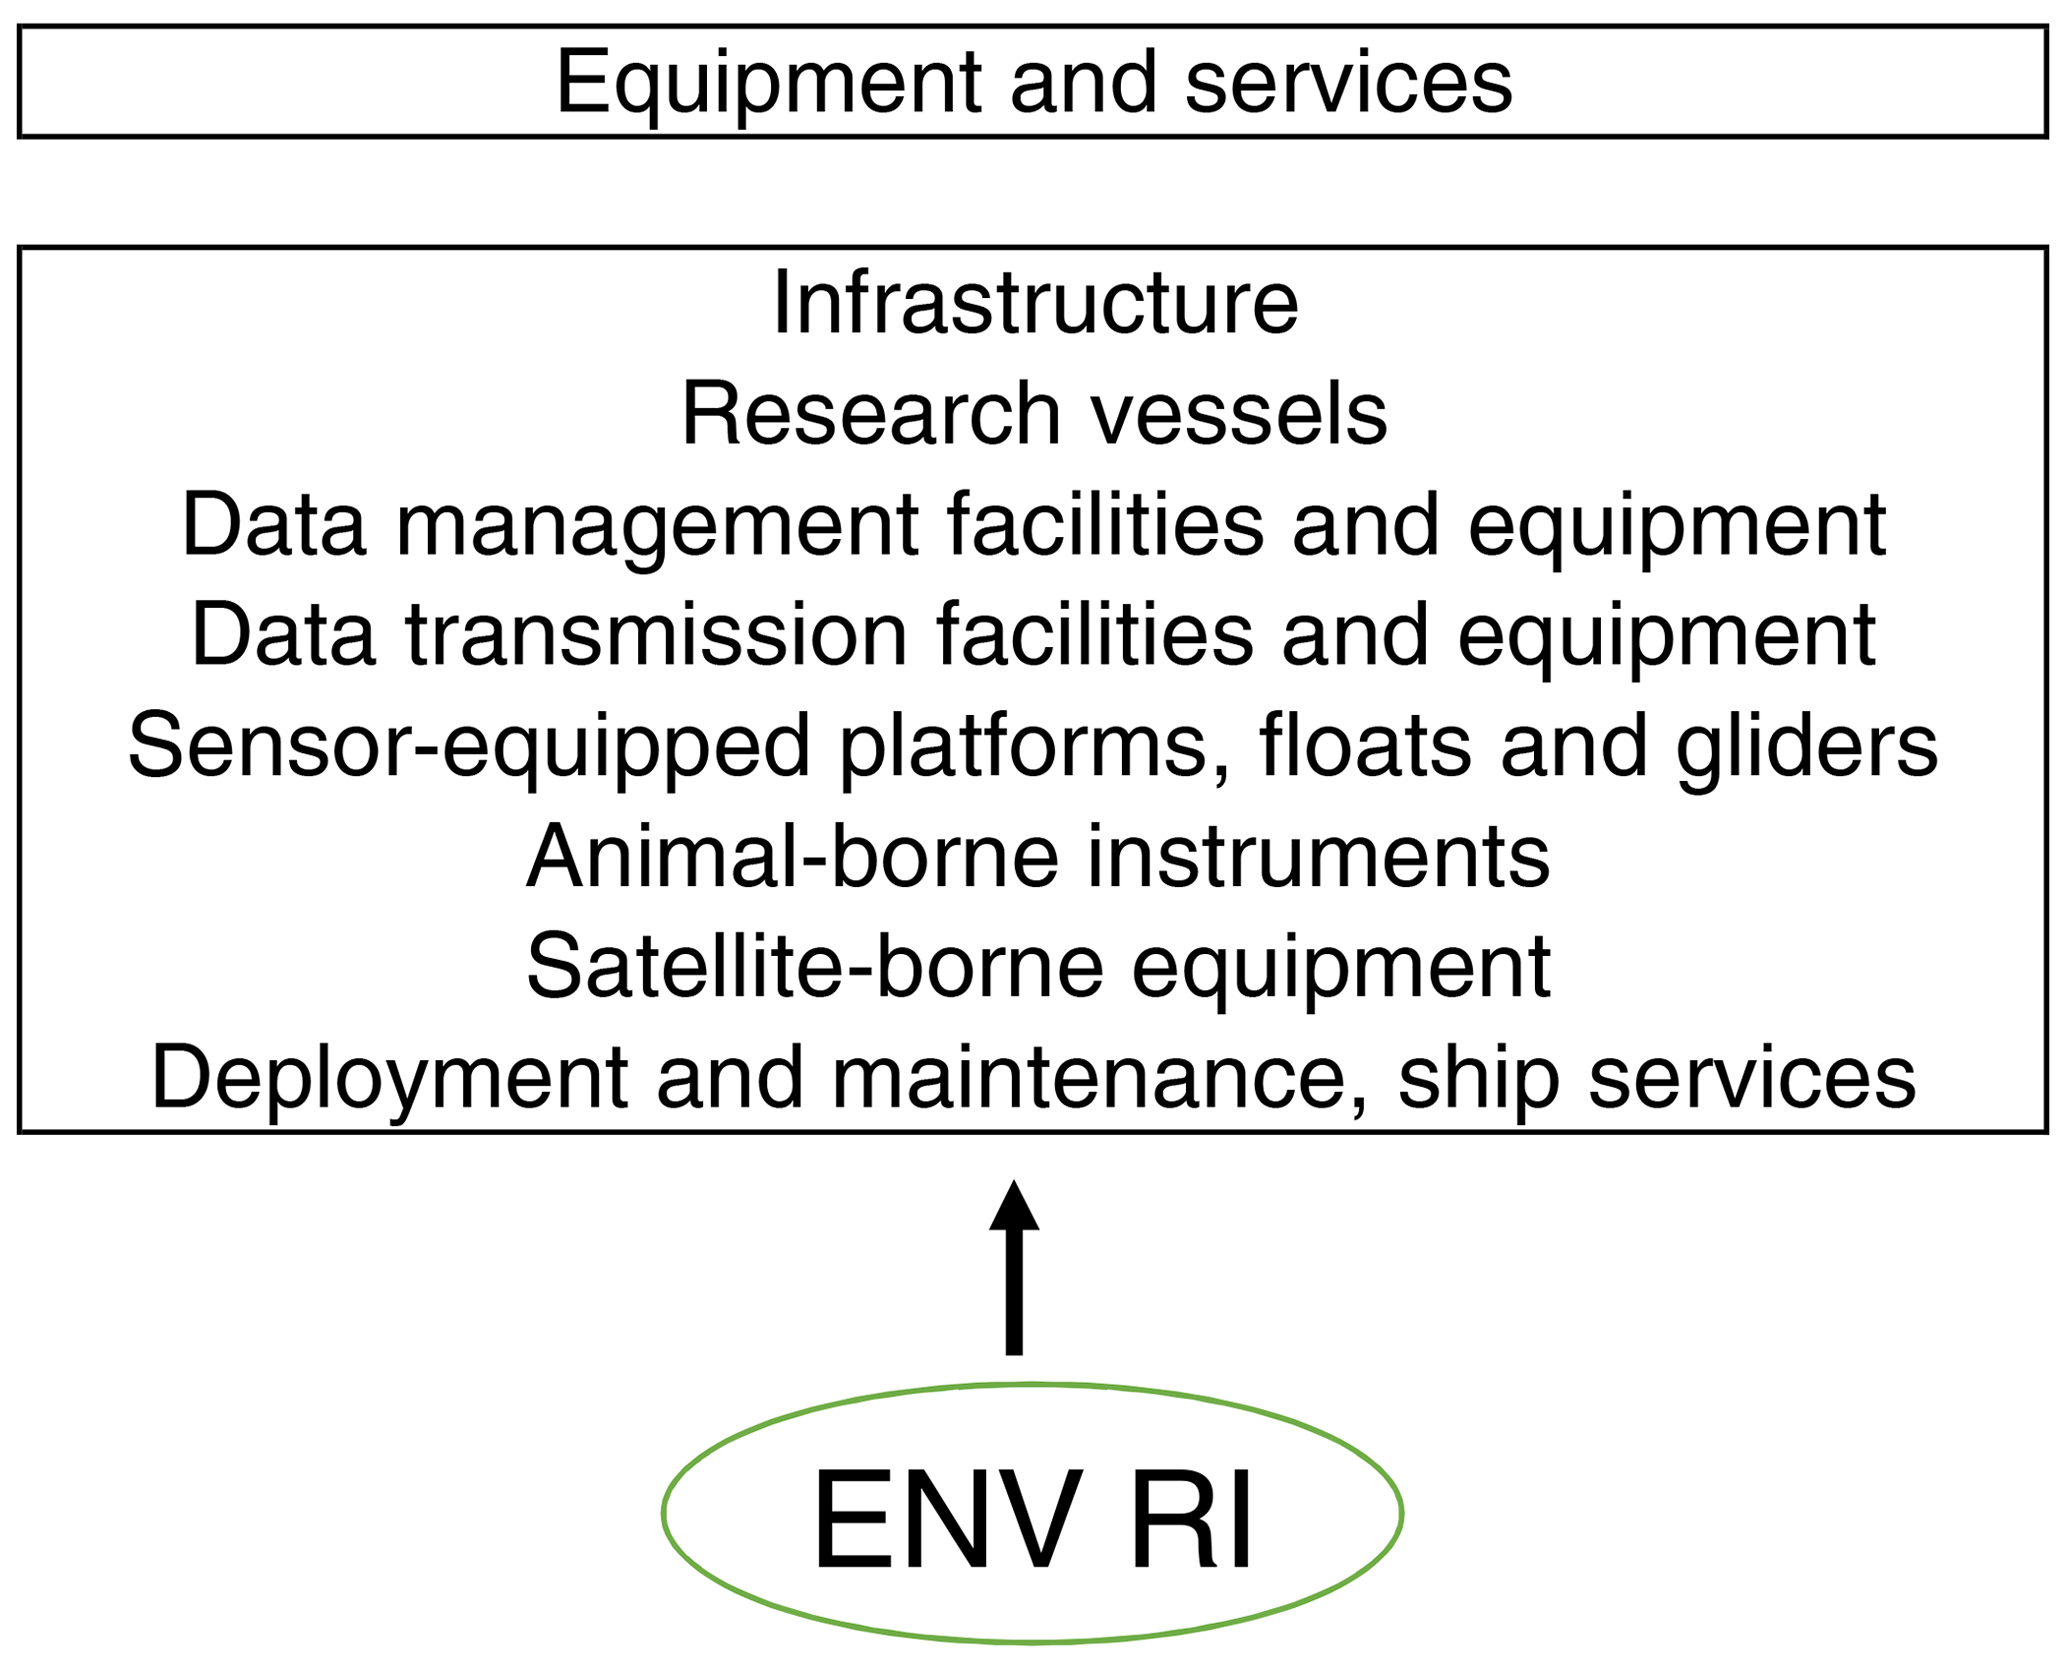
Figure 1Upstream impacts: list of the main categories of equipment and services supplied to ENV RIs.
Downstream impacts (Fig. 2) are generated by the uses of ENV RI data products. The performance of observational data positively impacts the performance of the processed data and information provided to data users. Certain ENV RIs develop databases for archival, scientific research and education, and stakeholder information, e.g. Integrated Carbon Observation System (ICOS; https://www.icos-ri.eu, last access: 11 January 2020). Other ENV RIs produce multi-purpose observational data (1) for archival, research and education and (2) for the development of models processing the data for environment monitoring and forecasting; (3) further downstream, the processed data are re-processed for the supply of customized data products and services. The Argo case study belongs to such a category. The downstream impact assessment methods examined below will therefore give attention to data performance indicators at different stages of the data supply chain.
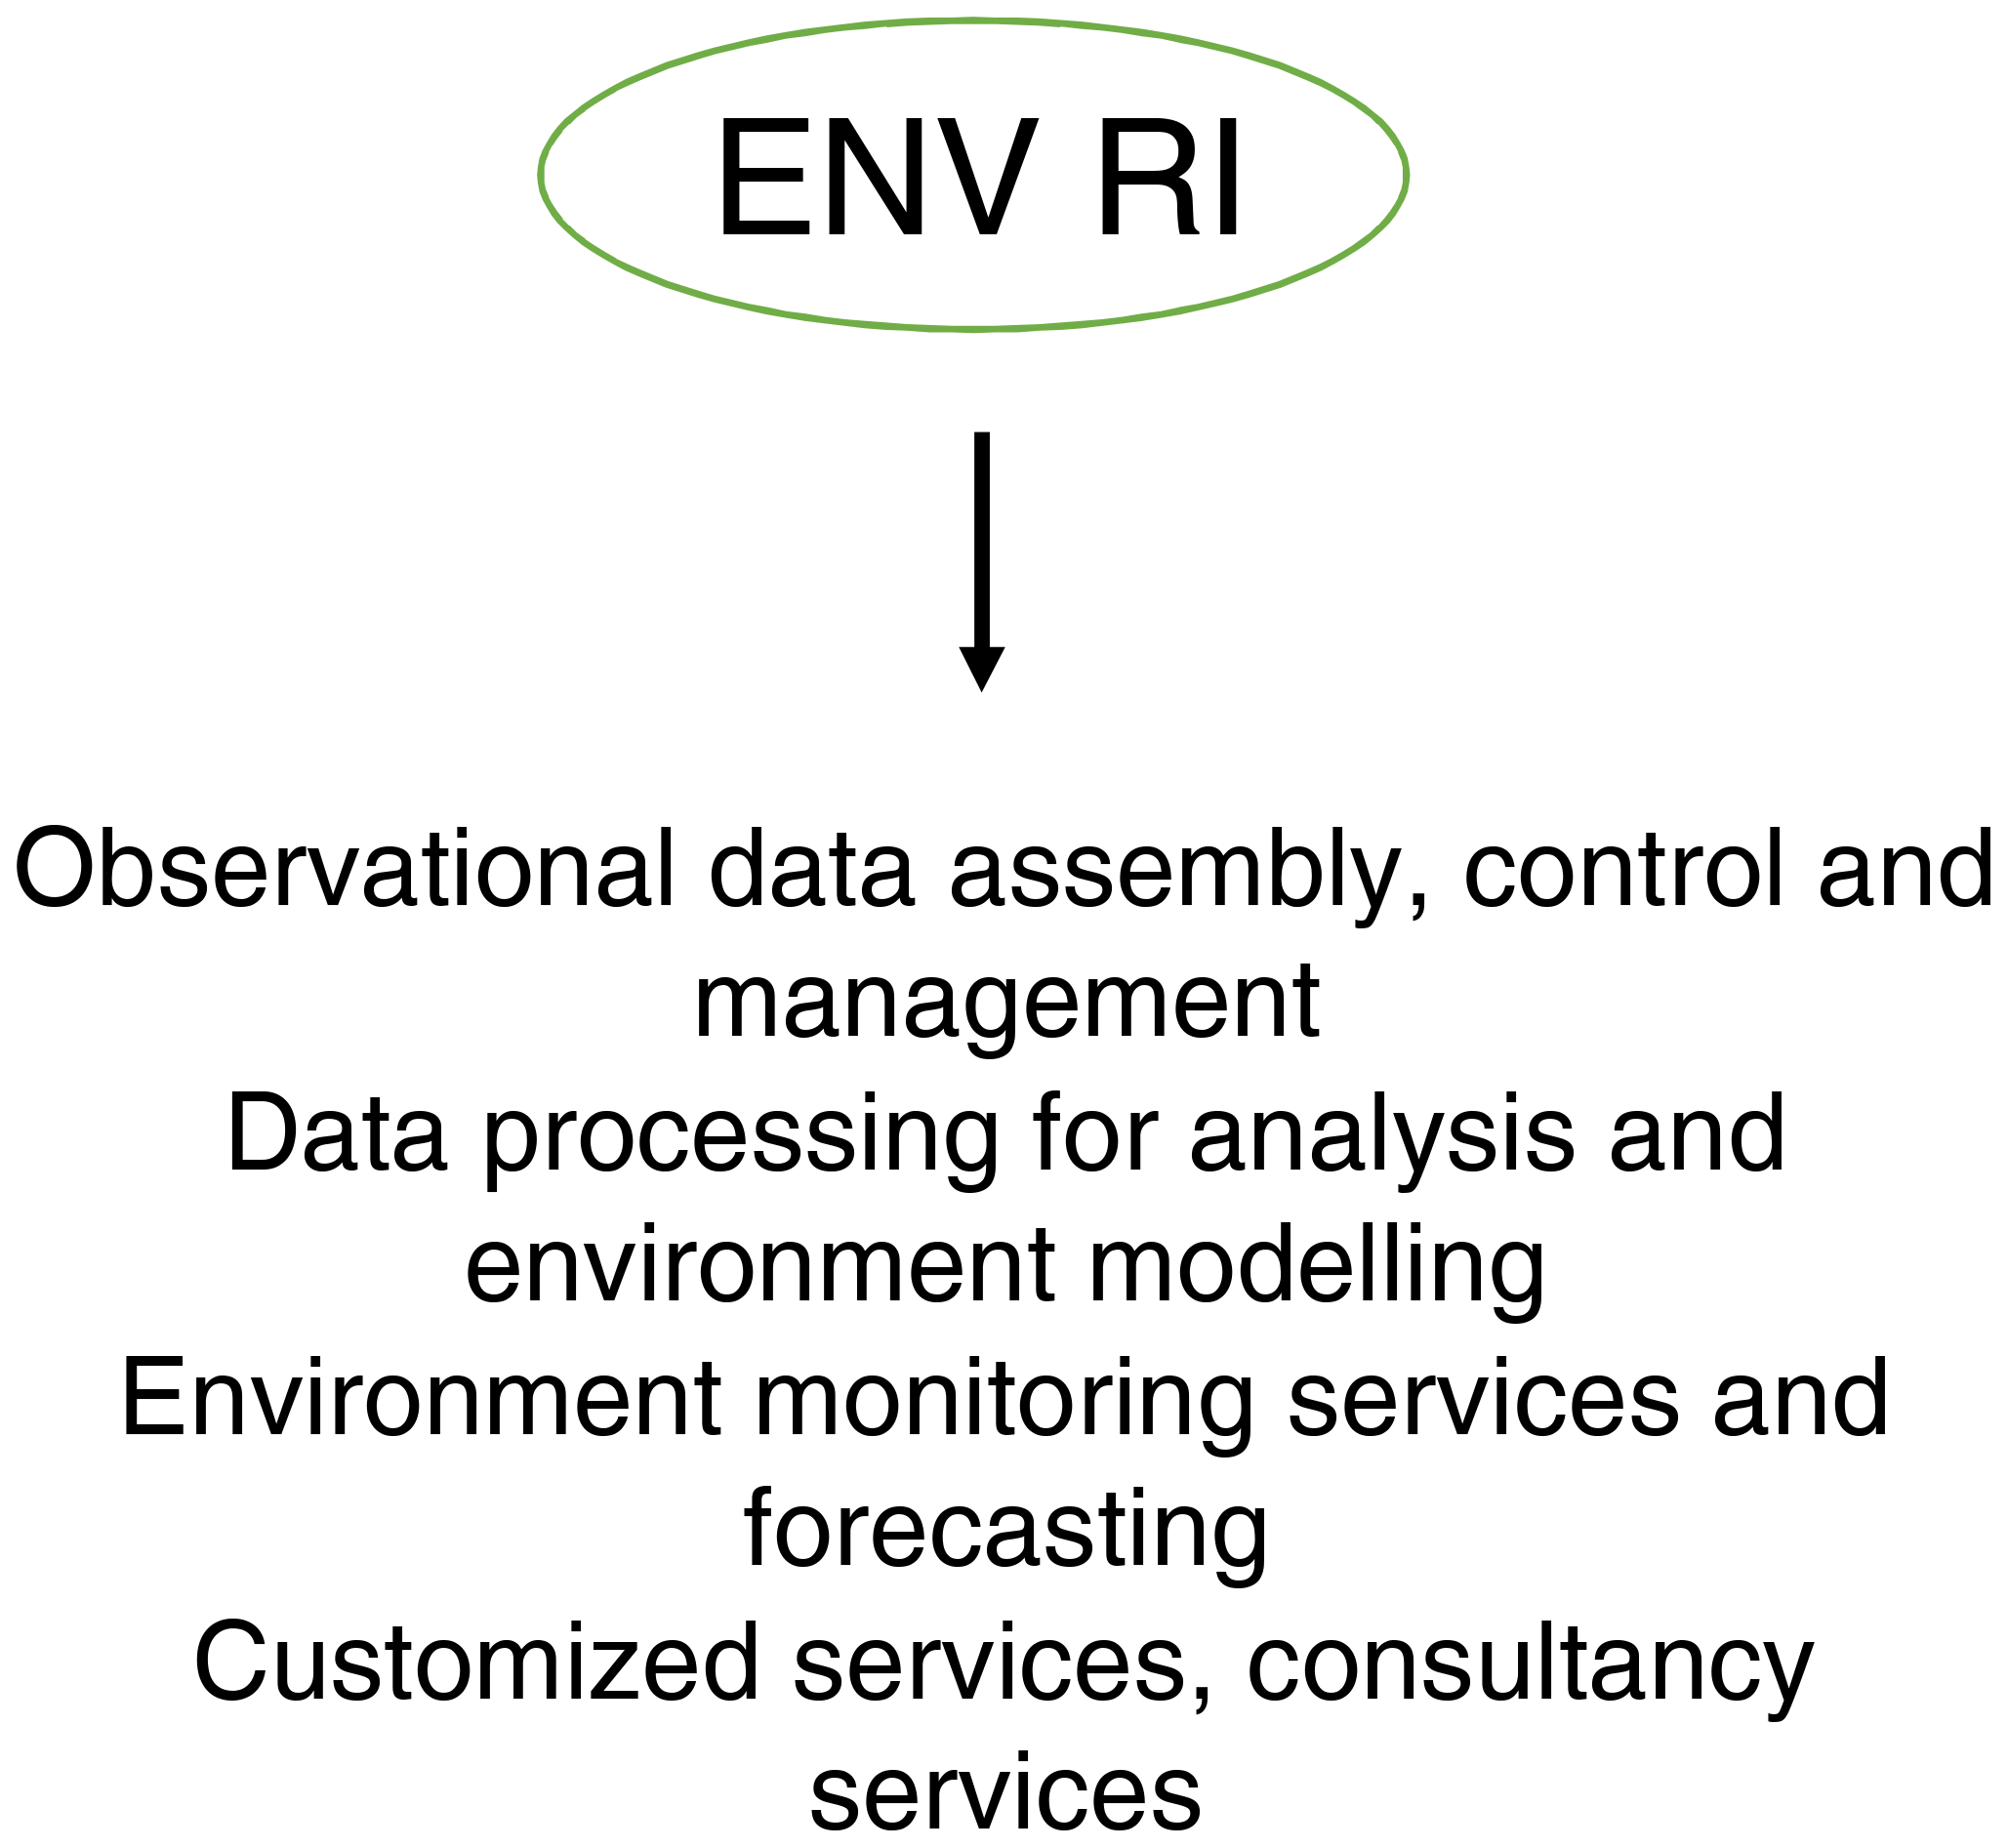
Figure 2Downstream impacts: the different stages of data and service supply from observational and processed data to the different environment monitoring services.
Feedback impacts concern the response to environmentally sensitive economic activities' and other data users' need for information about environmental conditions (e.g. climate change): comprehensive observations and monitoring services are critical for understanding and predicting environmental changes. These impacts involve ENV RIs and the supply chain from upstream equipment and service suppliers to the diversity of downstream value-added services (Fig. 3), aiming to improve scientific knowledge to the benefit of environmentally sensitive activities. These benefits are often assessed in terms of avoided costs resulting from the predictive capacity of ENV RIs. The assessment of both the costs of ENV RIs and their data supply chain and the benefits to users is performed, in several studies, through cost–benefit analyses (CBAs), as will be seen below.
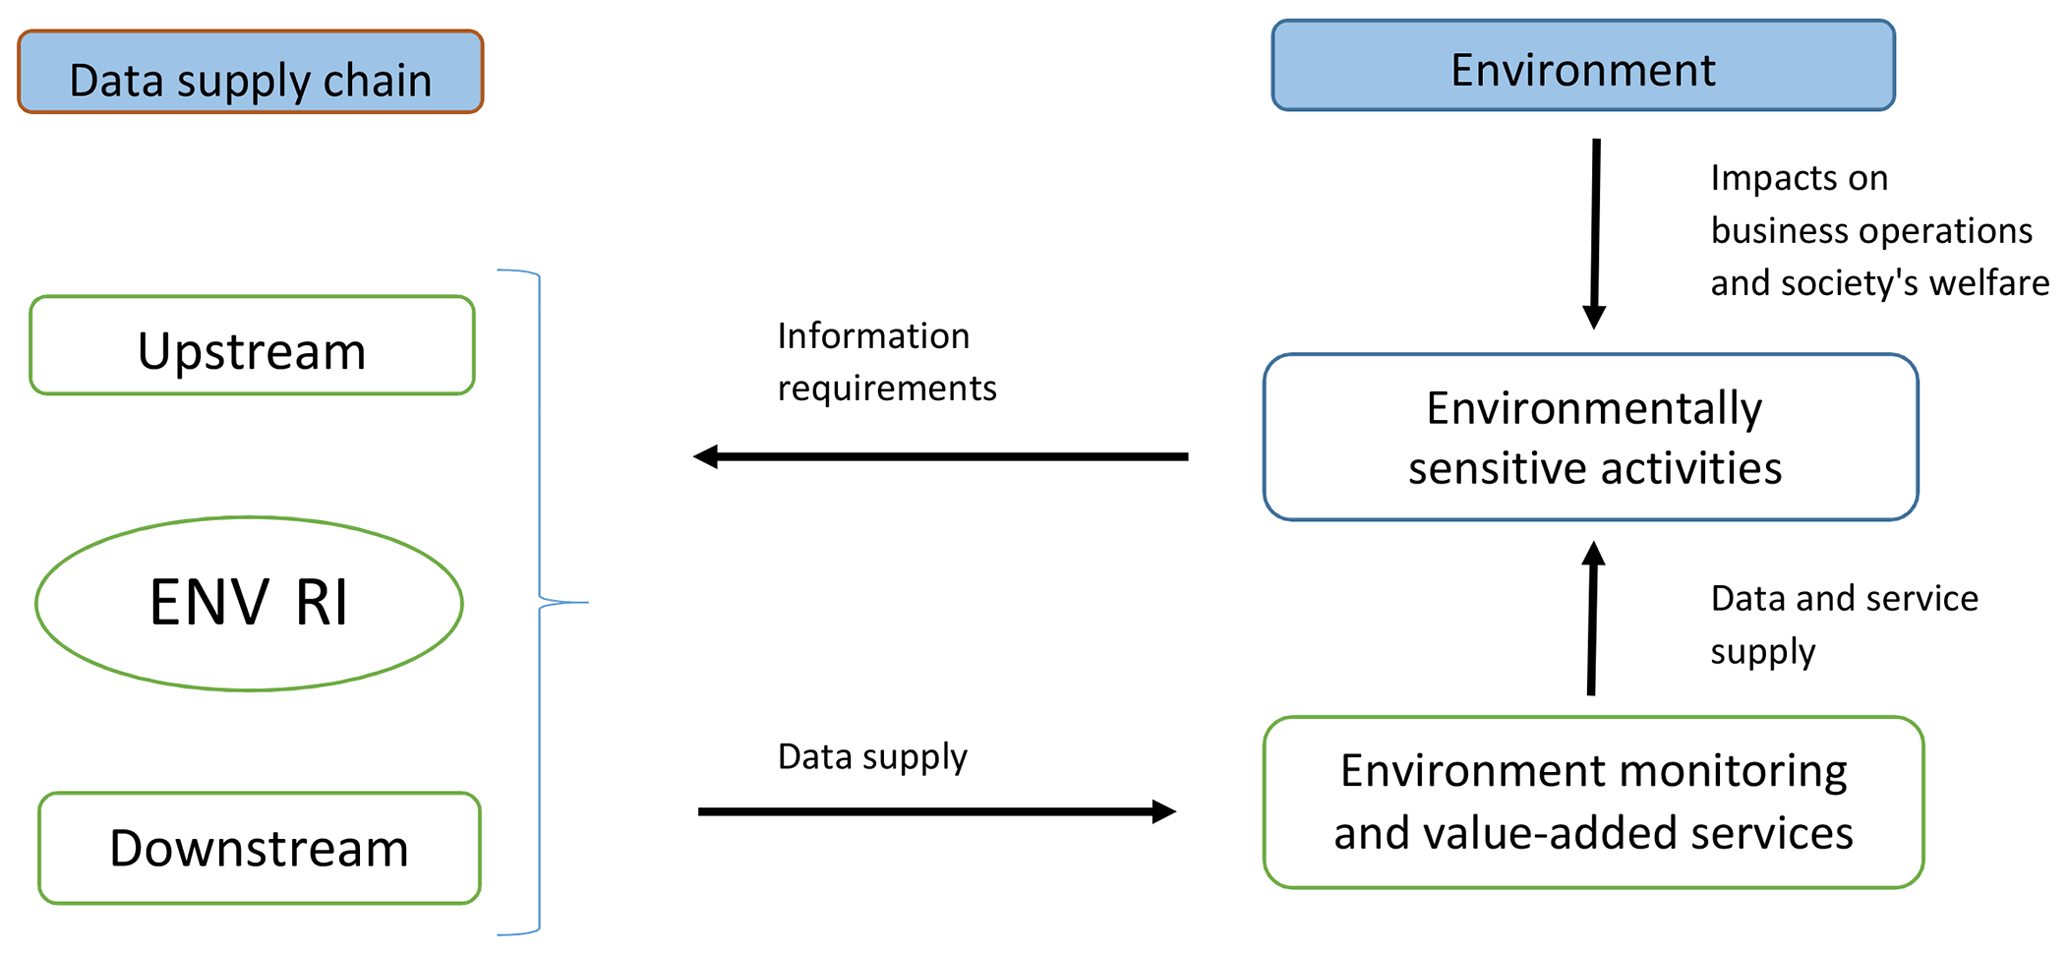
Figure 3Feedback impacts: environmentally sensitive activities require environmental information and are supplied with data, monitoring services and forecasts by e.g. Copernicus and other value-added services.
The case study is an ocean observing system which benefits from not only new platform and sensor technologies and robotic measurements but also global telecommunications. It has decisive impacts on our knowledge about oceans in physical and biochemical terms. The development of Argo is therefore tightly associated with a range of upstream and downstream activities.
2.1 Argo's role in the ocean data acquisition chain
2.1.1 Observational instruments and parameters
Argo (Fig. 4) is an in situ ocean observing system providing real-time and delayed-mode observations at a global scale (Euro-Argo European Research Infrastructure Consortium, 2018). It operates a growing array of free-drifting profiling floats measuring marine parameters on a periodical basis; the deployments began in 2000. The Core component of Argo is designed for monitoring the key ocean state variables (pressure, temperature and salinity) from the upper 2000 m of the ocean. Recent advances in platform and sensor technologies permit the extension of Core Argo's spatial coverage and development of two other key components of the programme. (1) The Biogeochemical-Argo (BGC-Argo) floats measure a range of parameters including dissolved oxygen, chlorophyll a, suspended particles, downwelling irradiance, nitrates and pH (Roemmich et al., 2019): BGC-Argo will allow for a better understanding of ocean biochemistry and marine resources. (2) Deep Argo is a new generation of floats designed to sample the ocean beyond the limit of 2000 m, and is capable of reaching 6000 m, aiming to sample the full ocean depth. Deep Argo, still in its pilot phase, is aimed at helping to better assess some essential ocean-warming-related parameters, reduce uncertainties in coupled atmosphere–ocean models, re-analyses and forecasts, and improve understanding of ocean circulation.
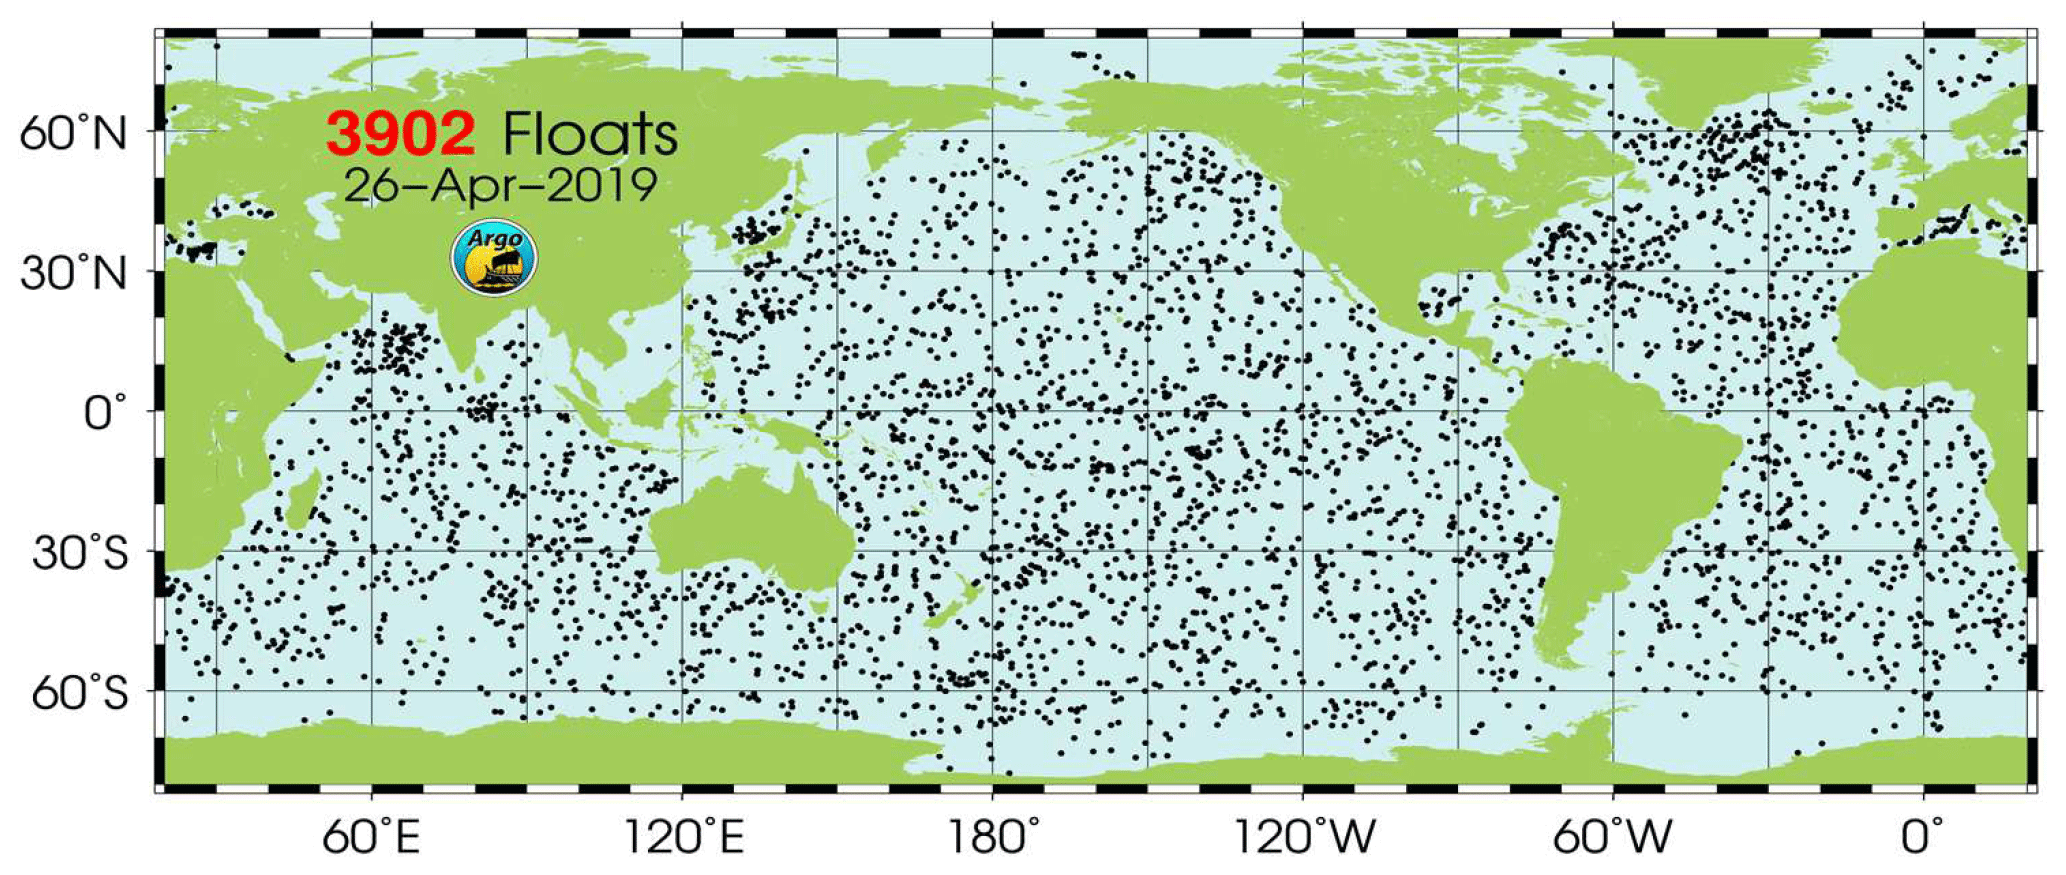
Figure 4Argo global array of profiling floats: position of floats having delivered data within the last 30 d until 26 April 2019. Source: © Argo programme (http://www.argo.ucsd.edu, last access: 26 April 2019).
The initial objective of 3000 profiling floats was reached in November 2007. The current number of floats increases by around 150–200 per year. Euro-Argo is Europe's contribution to Argo with around 600 active floats out of a total of nearly 4000. The float has a lifespan of 4 to 5 years.
The Argo programme is a major contributor to the Global Ocean Observing System (GOOS) and the Global Climate Observing System (GCOS) (Riser et al., 2016; Roemmich et al., 2019) and is now key to operational oceanography and climate research. It operates in association with:
-
Satellite remote sensing. Satellite profilers provide parameters which are impossible to obtain from floats (global data on altimetry/sea level and waves, current, ocean colour, sea ice and winds) and which are key for ocean circulation models and assimilation techniques. Experiments have shown (see Sect. 3.2.2) that assimilating both satellite and in situ data significantly improves sea surface temperature and salinity forecasts.
-
Other in situ observation platforms and profilers. Instruments include ship-based conductivity–temperature–depth (CTD) profilers, expendable bathythermographs (XBTs), for temperature and depth, FerryBox systems for physical, chemical and biological parameters, moorings for a range of parameters including current, animal-mounted instruments, gliders, drifting buoys, and cabled systems; e.g. a North American project aims at associating ocean sensors to submarine telecommunications cables (Science Monitoring and Reliable Telecommunications subsea cables; SMART).
-
Satellite transmission. Argo floats transmit observational data to satellites during the time slot when they are at the surface.
On the other hand, platforms measure certain types of parameters that satellite profilers do not capture, e.g. sea subsurface temperature and salinity and most bio-parameters. The synergy between in situ platforms and satellite remote sensing is therefore essential.
The data generated by the Argo system are made freely available to the public within hours of collection. As explained by Roemmich et al. (2019), they are used for education, research, monitoring and forecasting. The Argo programme must then be kept relevant to these different uses. The main challenge facing Argo is now to sustain a long-term global coverage under budget constraints. New Argo development projects include:
-
the spatial expansion of Core Argo and regional increases in float density in poorly sampled zones;
-
achieving the long-term sustainability of BGC-Argo by increasing cost effectiveness (decreasing sensor costs) and adapting the types of observations to users' requirements;
-
the implementation of the Deep Argo programme, with a new design of the Argo array including −4000 to −6000 m observations.
2.1.2 Data acquisition and processing
Argo is part of a supply chain stretching from primary data collection to processed data distribution and, further downstream, to value-added marine services for environment monitoring and security (Fig. 5). Downstream from in situ platforms, the data acquisition chain, after satellite re-transmission, includes a data assembly segment.
-
A total of 11 national Data Acquisition Centres (DACs) collect, quality-control, standardize, archive and distribute real-time (within 24 h of data transmission from the float) and delayed-mode (within 1 year of collection) biological, chemical, physical and geophysical ocean profiles from Argo floats and other types of profilers, and convert data into standard exchange format.
-
These data, together with associated metadata, are reported to the Global Telecommunication System (GTS) of the World Meteorological Organization (WMO), to meteorological forecasting centres, and to the two Global Data Assembly Centres (GDACs) in charge of collecting Argo data and operated by the Fleet Numerical Meteorology and Oceanography Center (FNMOC; USA) and Coriolis (France). Observational data are then made publicly available from GDACs via the internet. For a description of DAC and GDAC operations, see Carval et al. (2018).
Marine services are developed using a variety of processed marine data. In Europe, Mercator Ocean International and the Copernicus Marine Environment Monitoring Service (CMEMS) play an essential role in this area. Mercator is an ocean monitoring service provider delivering customized real-time and delayed-mode ocean information services on a periodical basis. CMEMS is an online service providing all users (service providers or end users from the commercial and research and development sectors) with core information on maritime safety, the coastal and marine environment, marine resources, and weather, seasonal forecasting and climate. It includes (1) Thematic Assembly Centres (TACs) which process real-time in situ and satellite observations – TACs include an in situ component (INS TAC) which collects, quality controls and validates Argo and non-Argo data – and (2) Monitoring and Forecasting Centres (MFCs) which run ocean models assimilating the data supplied by the TACs to generate analyses of the current state of oceans, reanalyses (analyses of the past state of oceans using model and observations) and 10 d forecasts. Argo Regional Centres (ARCs) provide expertise on specific ocean regions using Argo and non-Argo observations.
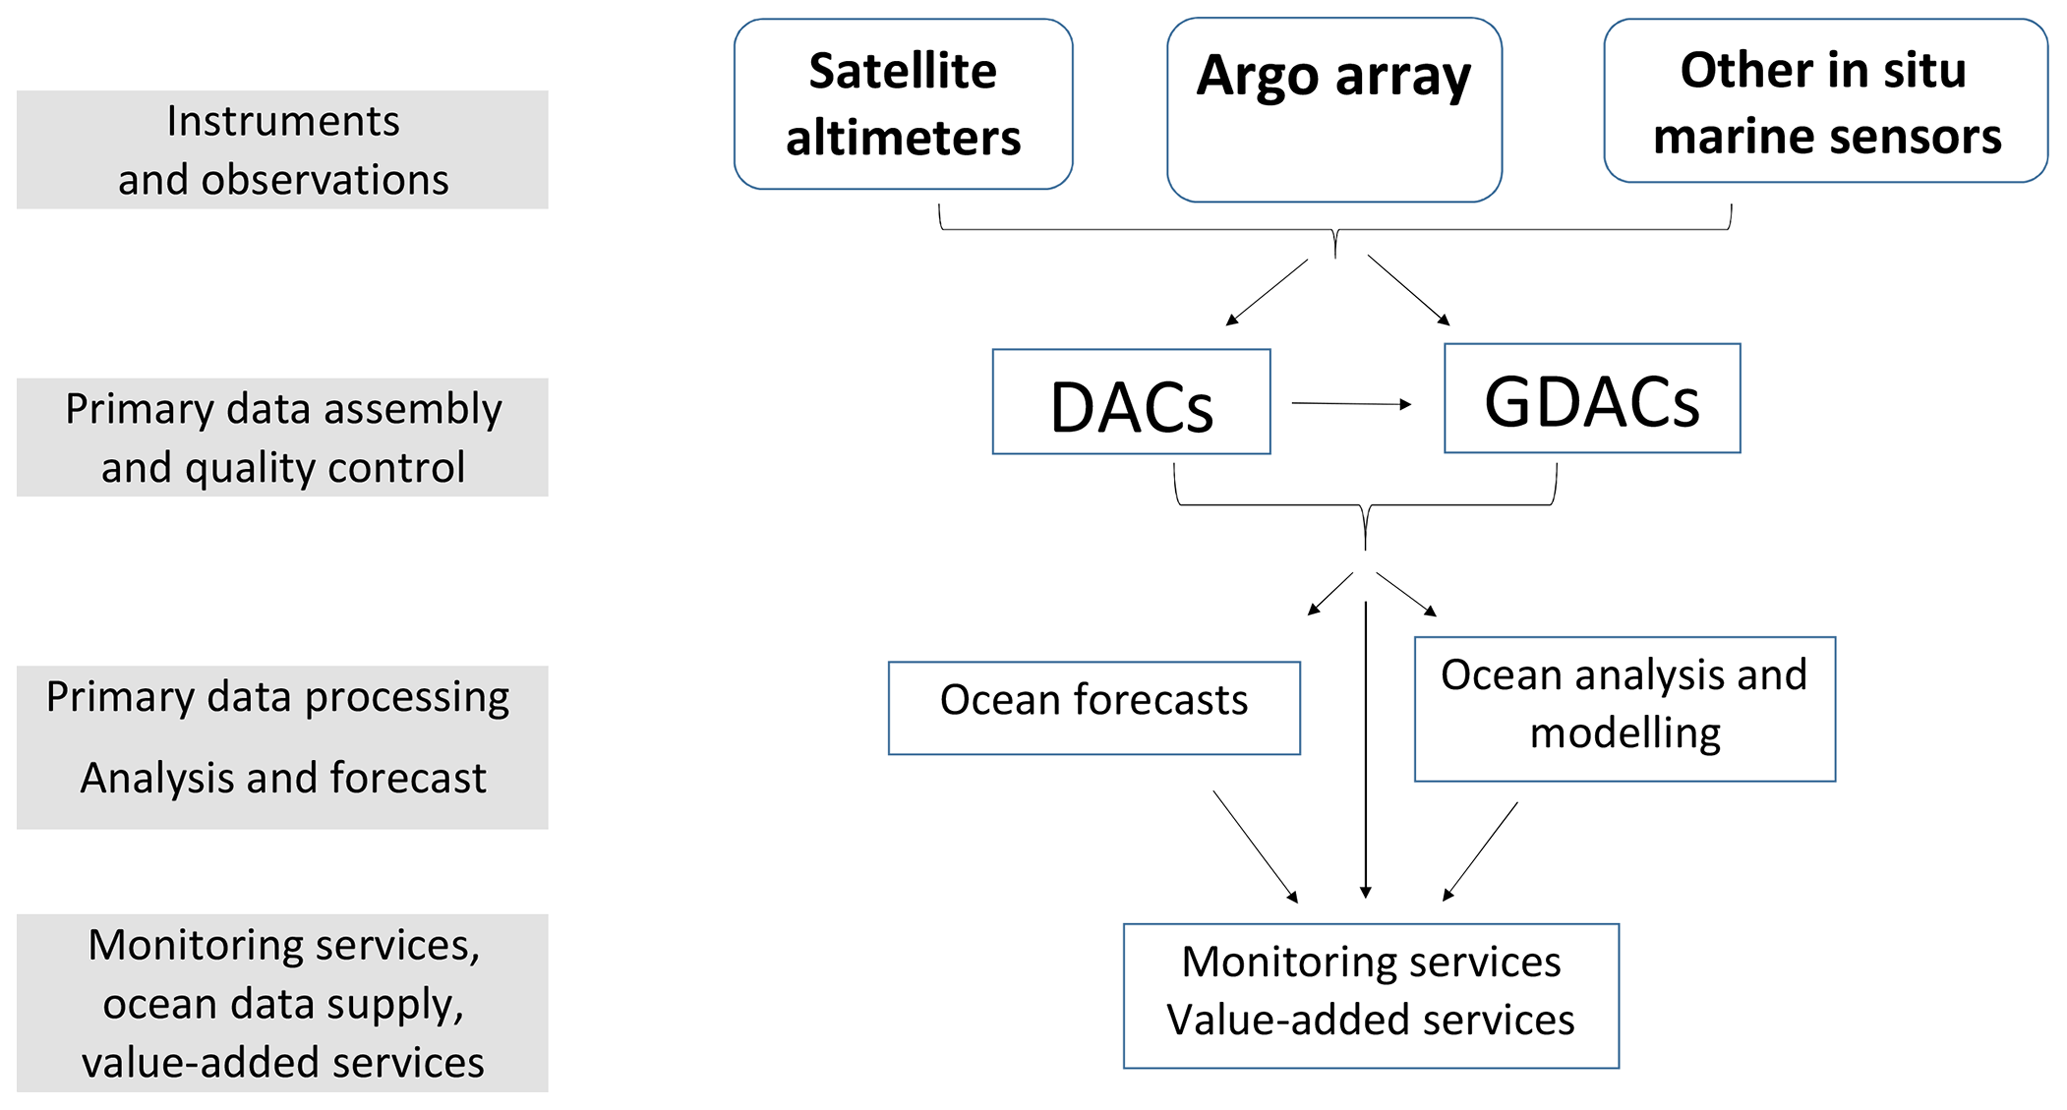
Figure 5Simplified description of the ocean data supply chain including the Argo array: observational data are provided to the Data Assembly Centres (DACs) and Global Data Assembly Centres (GDACs) and then to scientific users for processing and modelling. Observational and processed data are used for monitoring services.
Standardized marine services include observational data compliant with the EU INSPIRE (Infrastructure for Spatial Information in the European Community) Directive 2007/2/EC in terms of data interoperability. For instance, EMODnet (European Marine Observation and Data Network), as a major component of the EU marine data supply strategy, publishes online interoperable data products and maps on bathymetry, geology, seabed habitats, chemistry, biology, physics and human activities (https://www.emodnet.eu, last access: 11 January 2020). These marine data products are provided for research, archiving, observation and forecasting purposes to end users, including not only operational end users such as maritime transport (shipping and cruise lines) and offshore mining (oil rigs and dredging) but also commercial consultancies. The latter are active on customized service markets based on local forecast and specific coastal management services.
While the marine data acquisition and distribution market is mainly driven by public funding and investments, the US-originating strategy of a free-of-charge supply of Earth observation data products, aimed at supporting the competitiveness of downstream value-added services by decreasing their production costs, is superseding alternative business models outside the US, notably in Europe (see Groupe interministériel sur la politique de diffusion des données d'observation de la Terre à partir de l'espace, 1995; MENESR, 2004). On the market of marine data products, the free-of-charge principle reinforces the role of public funding and public agencies in the supply chain, while business opportunities are created downstream: in businesses such as big data management in Earth observation and customized data products and value-added services, many private companies are now active (see European Commission et al., 2017). CMEMS is part of the free-of-charge marine data supply chain. In 2016, the number of users of CMEMS data products was estimated at around 5000, 80 % of which were from the public sector. “Intermediate users”, i.e. value-added service providers using and processing CMEMS data products, were not only large companies with a large market share but also small- and medium-sized enterprises (SMEs), micro-companies and research institutions (PricewaterhouseCoopers; PwC, 2016).
2.1.3 Summary on Argo
The description above highlights the horizontal and vertical integration of Argo with other components of the ocean data supply chain. Horizontally, the combined working of Argo, the other in situ observing networks and satellite altimetry provides a full set of ocean observations. Vertically, primary observational data are validated and archived after quality control by the data assembly centres. An important part of the economic impacts discussed in this paper are generated by the combined working of Argo and of these components.
This description also highlights the dual-use nature of Argo: the programme is designed both for improving knowledge for research and education purposes and for operational oceanography and the development of monitoring and forecasting services (Argo data are multi-purpose, as mentioned in Sect. 1). These two types of use are important for the impact assessment methods examined below.
2.2 Cost of Argo
Information on ENV RI fixed and running costs is necessary for the assessment of economic impacts. Regarding Argo, the AtlantOS “Optimizing and Enhancing the Integrated Atlantic Ocean Observing System” project (2015–2019; H2020 European Research and Innovation Framework Programme) issued a report (Reilly et al., 2018) providing the estimated costs of a selection of ocean observing networks in the Atlantic, including the costs of the Atlantic Argo array (Euro-Argo and US Argo floats). Data gaps are recognized by the report as a limiting factor; pending better data coverage, the costing exercise is thus a first step toward consistent accounts of Atlantic Ocean observing networks. However, as it stands, it provides valuable information on the costs of in situ observing networks in the 2012–2016 observation period.
The report provides cost estimates for the Argo floats of the AtlantOS area (Table 1), deployed by Euro-Argo ERIC (European Research Infrastructure Consortium) members (Bulgaria, Finland, France, Germany, Greece, Ireland, Italy, Netherlands, Norway, Poland, Spain and the UK) and by three other AtlantOS consortium members (Brazil, Canada and the US). The calculation methodology is based on the number of floats deployed per country. Table 1 shows only cross-country averages which do not reflect inter-country variations of unit costs. Fixed costs show significant differences between the different types of float. The report also provides estimates for the 2017–2021 period in terms of expected investments and running costs. These estimates were tenuous at the date of publication and have not been used in Table 1.
Table 1Argo programme costs for the Atlantic Ocean observing network.
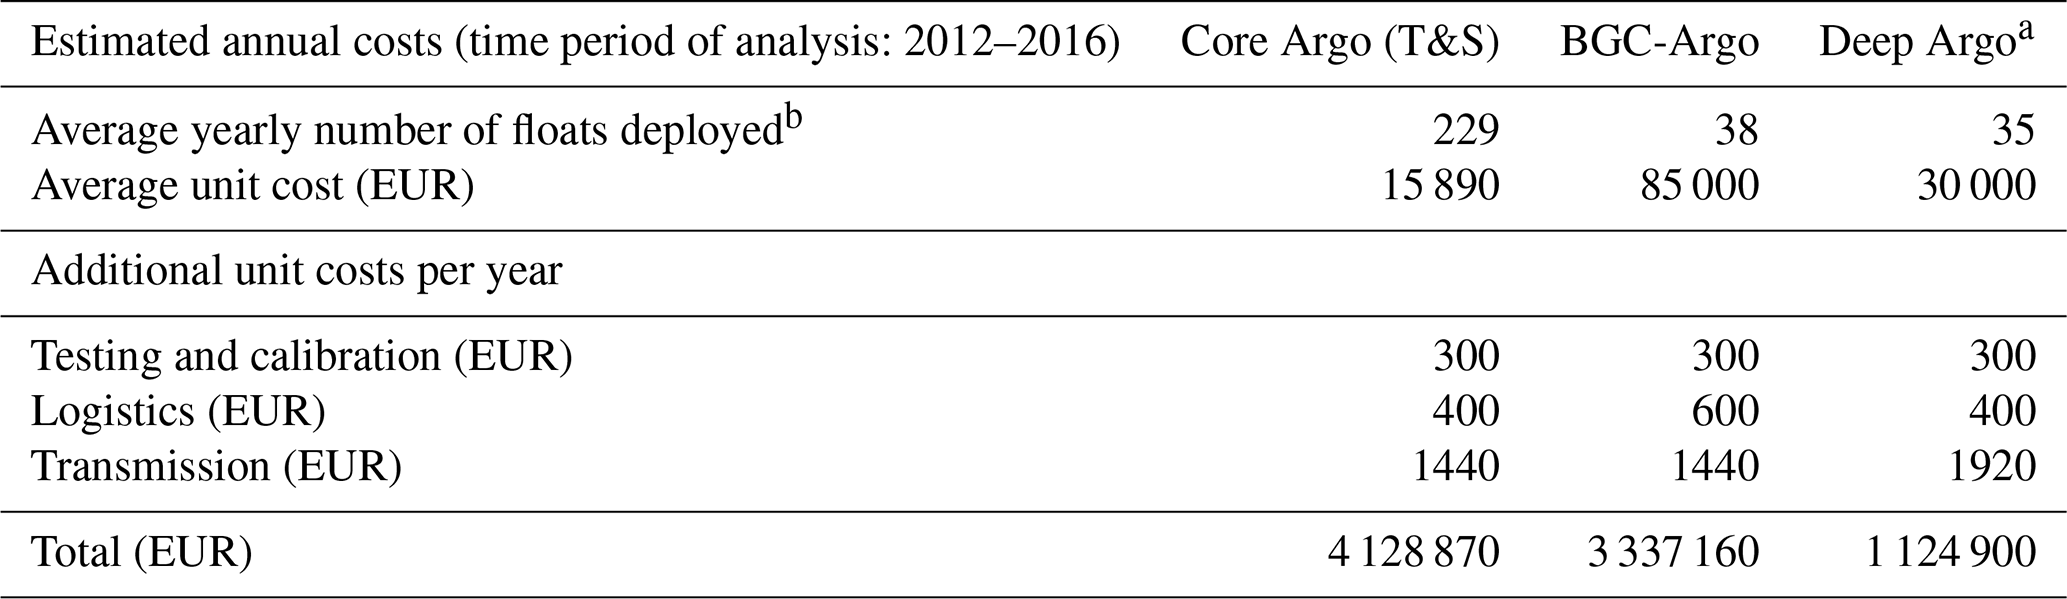
T&S: temperature and salinity profiler. BGC: biogeochemical profiler. a Arvor Deep Argo floats only. Apex floats excluded. b Target annual deployment for Deep Argo and BGC floats. Source: Reilly et al. (2018).
Regarding the 2012–2016 data, certain cost components would require further study:
-
Staff costs have been excluded from the accounting and remain to be analysed. The challenge is for all participating countries to have a common definition of the activities involved in Argo operations. The report indicates differences between member states in this respect.
-
The costs of research vessel services and those of ships of opportunity have also been excluded, although data were collected for a few countries. Cost harmonization remains to be extended to this area too.
According to Table 1, the yearly costs of investments in floats are estimated at EUR 8.5 million over the period of analysis. These estimates, limited to the Atlantic array of Argo, account for about a third of total Argo programme costs on the global scale and for the same cost categories as in Table 1.
Following the classification presented above, this section proposes an approach to the assessment of upstream, downstream and feedback impacts.
3.1 Assessment of upstream impacts
Upstream impacts are generated by the development and running of ENV RIs and their requirements for equipment supply and related services. This includes the construction of dedicated facilities and infrastructure (which may be very high); the manufacture and trade of remote sensing and in situ measurement instruments, airborne or waterborne platforms; data transmission; data collection and processing; and repair, refurbishment and other maintenance interventions. Particular attention is paid to the assessment of upstream impacts in terms of business indicators such as turnover, the value added and job creation.
3.1.1 Analysis of suppliers: direct assessment
In a favourable situation where suppliers are clearly identified and provide economic information on their businesses, a direct assessment of upstream economic impacts is feasible.
A case study proposed by Barrow et al. (2005) on the “marine science and technology industry” (MST) in New England (group of five US states, including Connecticut, Maine, Massachusetts, New Hampshire and Rhode Island) illustrates the approach. The paper analyses MST employment, sales and the number of establishments per type of activity for each state of New England.
The methodology uses a master database of 481 MST companies and organizations sourced from universities, public agencies and a commercial consultancy database supplemented by web searches and targeted interviews. The companies listed in the master database are totally or partially involved in MST. To characterize this total or partial involvement, their employment and sales figures have been weighted at 100 %, 40 % or 10 % if they pertain to the core, partial core or second tier of MST respectively. This operation has led to a set of adjusted indicators (Table 2) for MST in New England. Companies are classified into five subsets analysed in terms of sales and employment. The “marine instrumentation and equipment” (MIE) and “marine research and education” (MRE) subsets are those relevant to our approach. They respectively include (1) cutting edge measuring instrument producers for oceanography, geophysics, acoustics, electronics for marine instruments, platforms and marine navigation and (2) marine education, industry and technology and transfer groups, and all areas of oceanography including fisheries research. The other subsets are less directly usable: the subset “marine services” includes consultancies and engineering; “marine materials and supplies” includes marine equipment (paints, engines, machinery, etc.); and “shipbuilding and design” includes civil and defence shipbuilding operations.
Table 2Marine Science and Technology industry adjusted figures for New England in 2004.
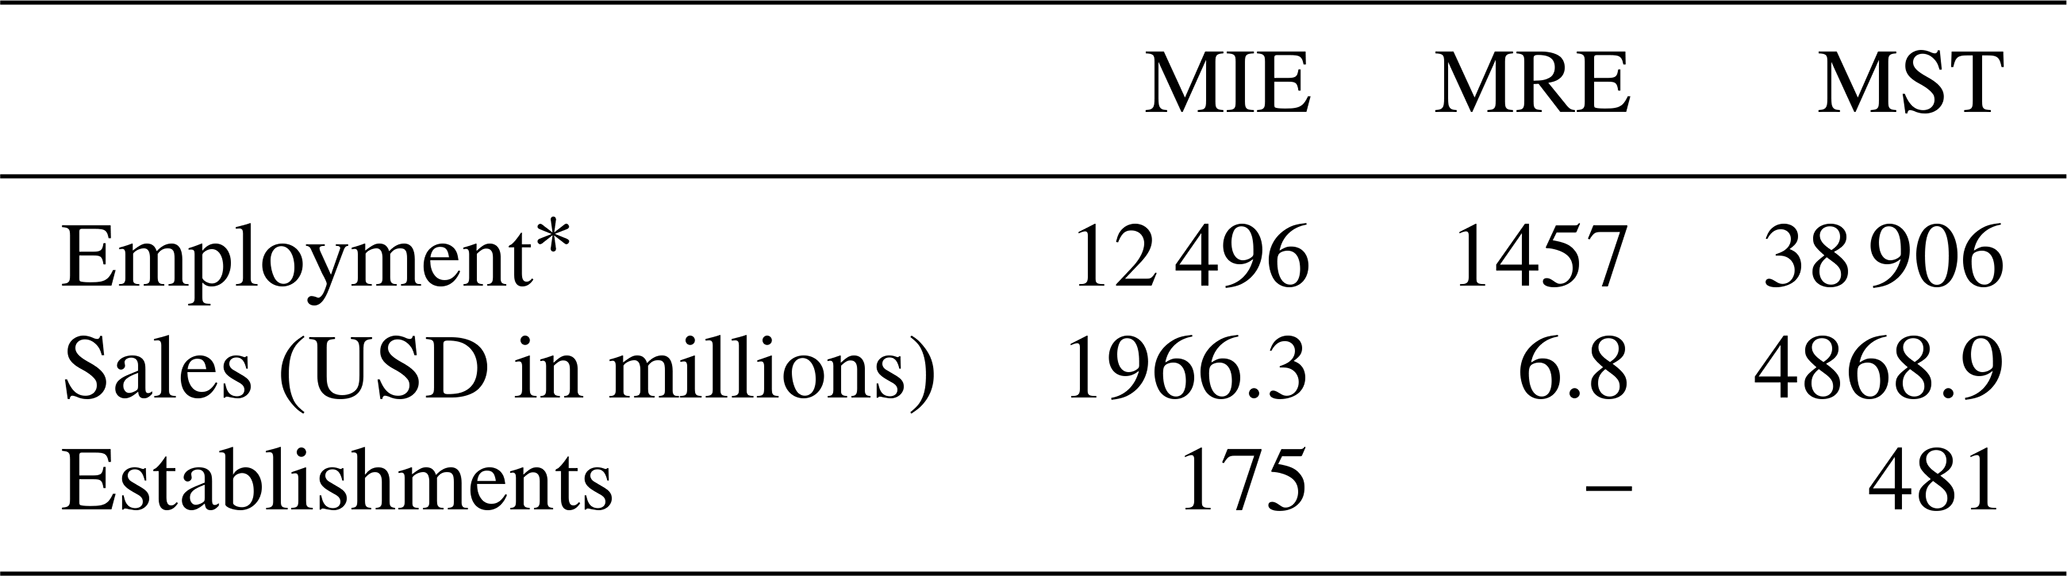
– means not reported. * is the number of persons employed. MIE: marine instrumentation and equipment. MRE: marine research and education. MST: marine science and technology industry. Source: Barrow et al. (2005).
Although the 2004 data would require updating, Barrow's approach points to a feasible way to assess the upstream segment of EU ocean observing RIs, based on targeted inquiries on jobs and sales of a delimited set of businesses. However, Barrow's objective is to describe the industry of a given geographical area using simple economic metrics but not to assess the upstream impacts from ENV RIs on the supply industry, which may be active beyond the geographical limits of New England.
A master database of MST companies such as the one used by Barrow would be worth developing for the EU. It would be a relevant start for further analysis on upstream impacts on an EU scale. An option would then be to define a set of activities equivalent to MST for EU countries and collect economic information through ad hoc business inquiries.
3.1.2 Analysis of suppliers: indirect assessment
In less favourable but more frequent situations where suppliers are identified but do not provide commercial information, the impacts of ENV RI's operational and investment costs can be estimated using the standard classification of activities serving as a basis for national statistics. The EU statistical framework is based on the NACE1, from which each member state derives its own national classification:
-
Companies are classified into NACE classes in which one class per company is based on its core business.
-
“Structural business statistics” (SBSs) are annually updated by the National Statistical Institutes (NSIs) of the EU member states, using annual business inquiries. They provide financial and non-financial indicators (turnover, purchases, gross value added, number of employees, personnel compensation, etc.) per NACE subdivision. These primary data are processed to develop National Accounts, where economic consistency is ensured.
SBSs are readily available to the public from Eurostat, the statistical division of the European Commission, which collects the data from NSIs and provides series of annual economic indicators per NACE class and member state (see https://ec.europa.eu/eurostat/data/database, last access: 11 January 2020). If the classes including the targeted businesses (ENV RI suppliers) are identified, it is feasible to estimate the impacts from ENV RI operational and investment costs in terms of turnover and employment, using SBS economic indicators as average estimates of supply company indicators.
There are two limits to this option. (1) SBS series are developed without a time consistency objective. It is therefore preferable to use the branch accounts (of National Accounts) when they are available at a class level: they allow for year-to-year comparisons. (2) Although class is the finest level of the NACE, most classes include numerous businesses; the indicators of a class of this type do not accurately characterize the economic situation of a small subset of companies such as ENV RI suppliers.
For instance, NACE class 26.51 “Manufacture of instruments and appliances for measuring, testing and navigation” includes the manufacture of aircraft engine instruments, radars, medical laboratory instruments, etc. The manufacture of ocean measuring instruments is only a modest part of this set. Likewise, the wholesale trade involved in the upstream segment of ocean RIs accounts for a small part of NACE class 46.69 “Wholesale of other machinery and equipment”. Consequently, class-related indicators are used as average estimates to assess the upstream impacts of ENV RIs.
The major difference between the NACE-based approach and the previous one, based on ad hoc inquiries, lies therefore in the fact that the NACE is readily available, systematic for all economic activities and consistent, while ad hoc inquiries may have weaknesses in terms of consistency and have to be redone for each specific assessment. On the other hand, the latter can adapt to specific cases, while the NACE cannot and has a limited resolving power, especially for the analysis of small-sized or local economic activities.
3.1.3 Analysis of ENV RI purchases
Where information on suppliers is missing, a consistent option is to collect the available data on ENV RIs' equipment and service purchases, either directly through ENV RI purchase records or indirectly through inventories and stock variations. This includes investments in infrastructure and equipment, as well as installation and maintenance services.
A standard statistical tool classifies the different types of products and services: the hierarchical “Classification of products by activity” (CPA), in force in the EU, classifies products (goods and services) by physical characteristics and by originating activity as defined in the NACE. CPA classes are strictly consistent with NACE classes: each CPA product corresponds to a specific NACE class. Like the NACE, each member state adapts the CPA to its national economy.
If ENV RI purchases are known in detail and can be broken down into CPA categories, it is feasible to evaluate their impacts on the branch accounts of the National Accounts. The latter permits the quantification of the direct impacts of demand, as classified by products, on the corresponding production branches. Note that the assessment of the indirect impacts generated by supplier spending raises other kinds of economic questions which go beyond the scope of the upstream impacts analysed in this section.
An example of ENV RI purchase data is offered by INSU (Oceanography division of the French National Centre for Scientific Research). INSU publishes an online inventory of its open-ocean instruments, including every type of material with technical specifications, purchase value, origin and number of instruments. The periodical flows of INSU purchases provide the data necessary for assessing demand: flows can be inferred from stock variations based on successive inventory updates.
Table 3 summarizes INSU's inventory, limited to the amounts of purchase costs per supplying country. It shows the diversity of INSU's suppliers, although more than half of the equipment value originates from North America and more than a third from the US alone. A detailed assessment of the upstream impacts of European ocean RIs must therefore take account of imports, especially from North America.
Table 3Open-ocean equipment. INSU Brest Centre.
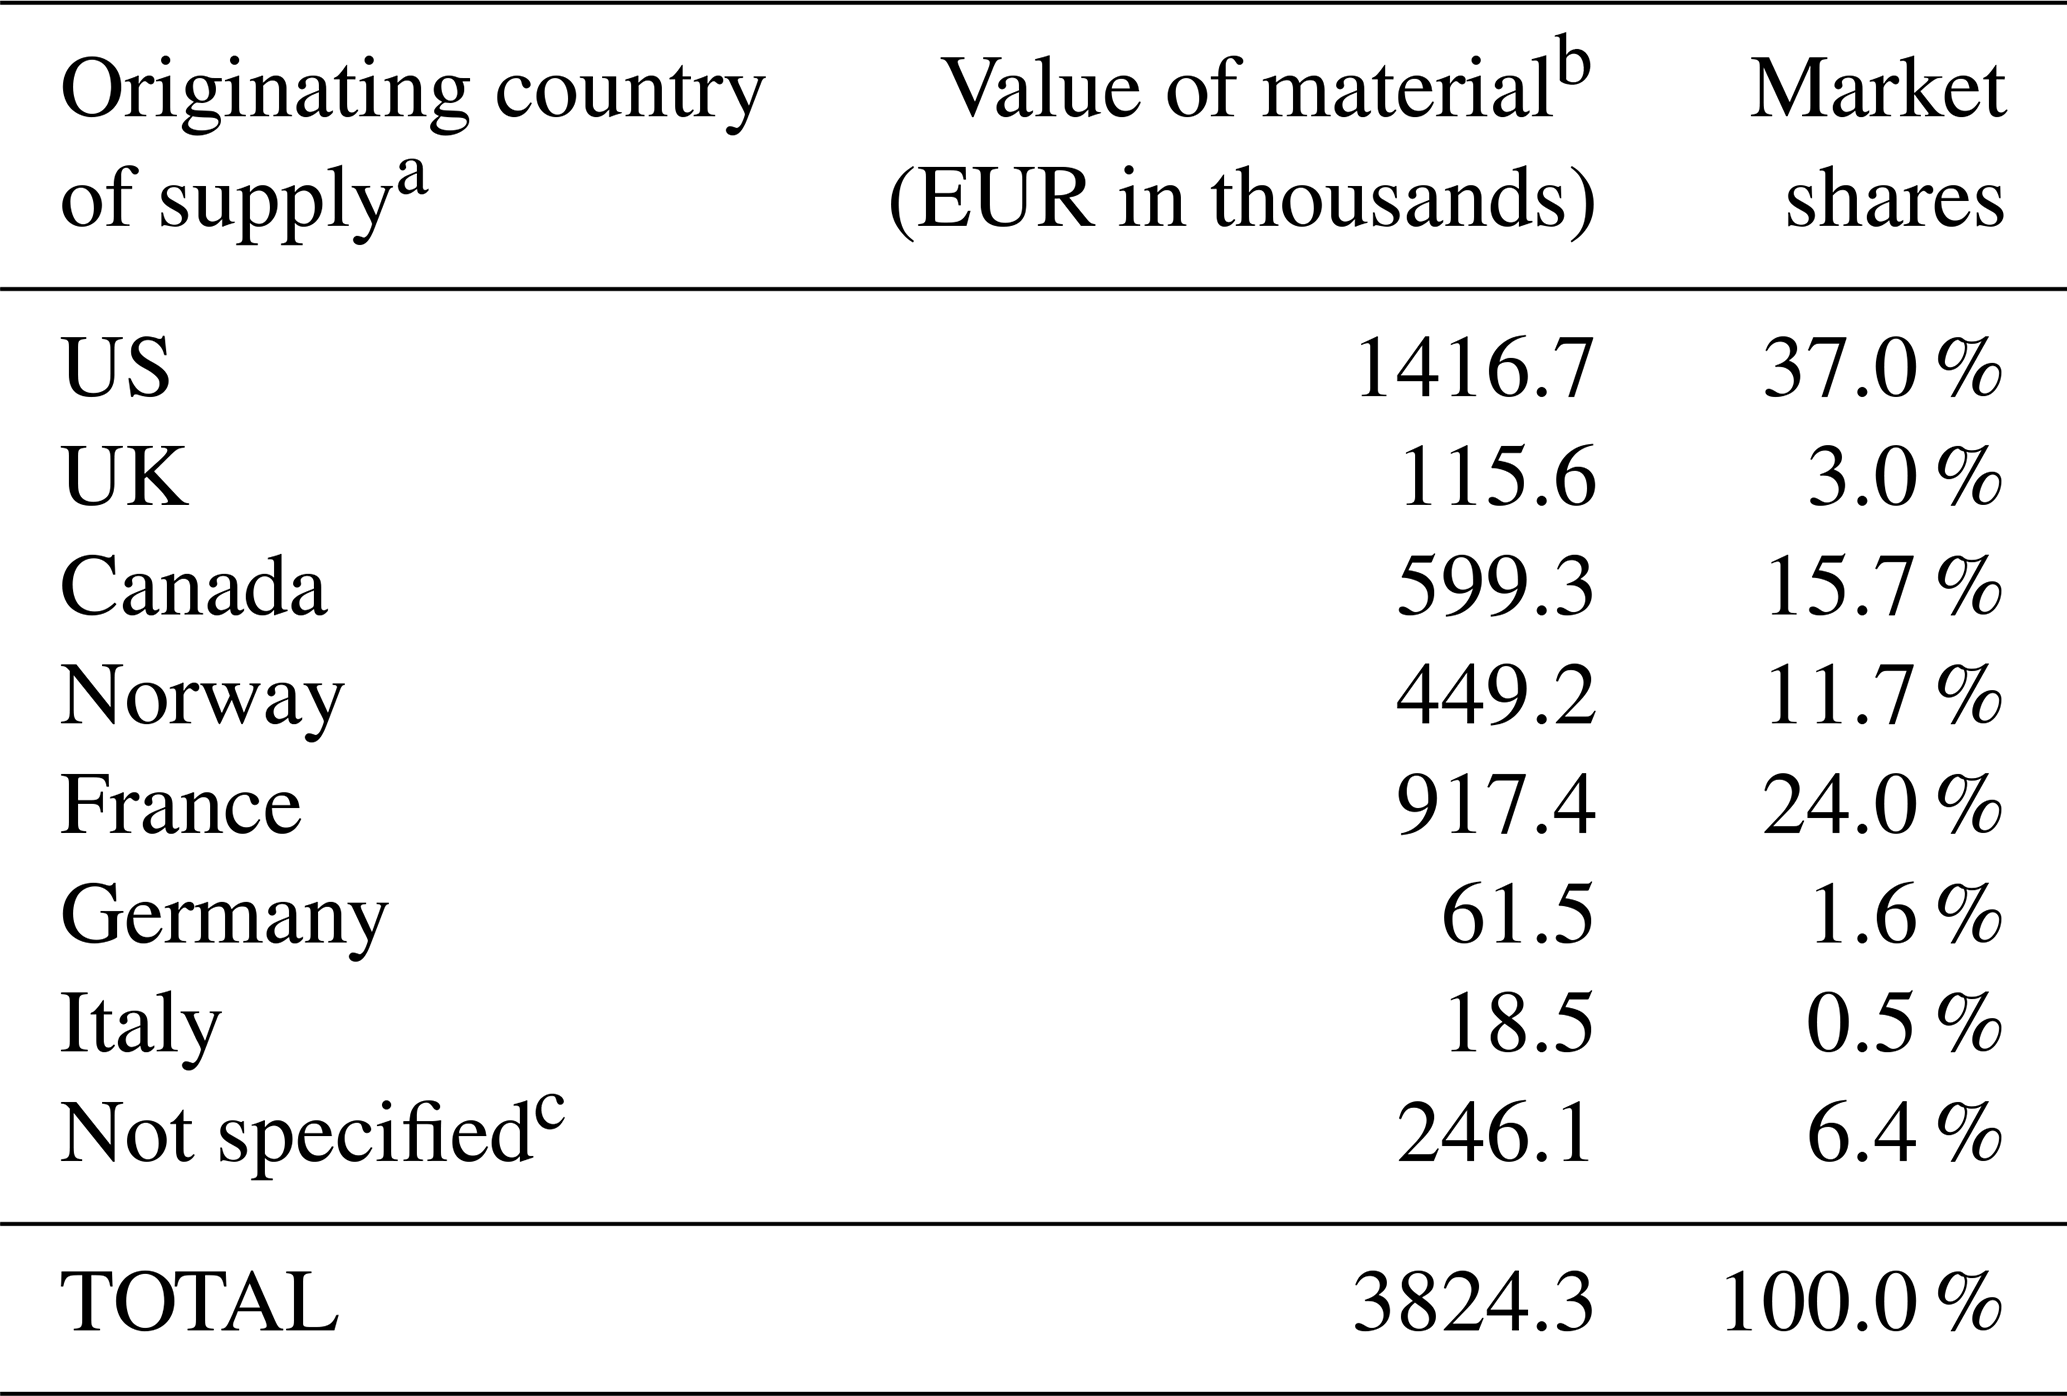
a Country of supplier's head office. This does not indicate country of manufacture. b Purchase value for INSU. c Material listed without details about suppliers. Source: INSU.
However, note that (1) the example of INSU is limited to scientific equipment (examples related to purchases of other types of infrastructure components and services would be useful) and (2) such a method is of limited accuracy if the branch accounts referred to above include large numbers of businesses, as it provides rough average estimates of impacts. In any case, it is preferable to have the branch accounts available at the class level (the most detailed level of the NACE).
3.1.4 Summary of upstream impact assessment
The upstream impact assessment methods presented above are based on the combined use of data on ENV RI demand and supply business accounts. Each of the options has its area of validity and its limits. Validity is determined by the relevance of source and the quality of statistics. Limits are methodological: ad hoc inquiries are time consuming and require significant input. SBSs are useful proxies for supplier business data but must be used with caution as an inter-annual comparison is impossible. In the absence of information on suppliers and if ENV RI purchases are detailed, branch accounts are the most consistent tool to obtain an accurate valuation of upstream impacts in general terms, provided information is available at the class level.
Practically, the selection of the most appropriate tools will depend on their capacity to analyse a diversity of supply business categories. Estimates are inevitable if business data are not available from enterprises; in such cases, the resolving power of the available statistics is essential for accurate estimates.
3.2 Assessment of downstream impacts
This section considers the downstream stages of the environmental data supply chain, from primary data management (data assembly, quality control, archiving and assimilation for modelling, and analysis and forecasting) to data user categories, including public and commercial value-added services and end users.
The performance of the data from ENV RIs determines the quality of environmental observations supplied as primary material for the downstream chain. Therefore, the analysis of ENV RI downstream economic impacts requires a performance assessment of the first stages of the chain: primary data collection and processed data for monitoring and forecasting. In the absence of commercial transactions, performance assessment is based on non-market indicators. Further downstream, most of the customized value-added services perform commercial transactions: market-related tools are necessary for performance assessment.
The subsections below focus first on the two first stages mentioned above. Argo and the other components of the ocean observing system provide a practical example for the discussion. Value-added services and related markets are then considered.
3.2.1 Performance of observations: the role of key performance indicators
This subsection focuses on the case of Argo and other in situ ocean observation arrays, but the discussion can be generalized to other ENV RIs.
At the stage of observational data acquisition, archiving and quality control, DACs and GDACs are key players. GDACs publish information on data performance using a set of key performance indicators (KPIs).
The KPIs used by Coriolis, other assembly centres and INS TAC (see Sect. 2.1.2) constitute metrics of the quality of ocean observations, also resorted to by CMEMS for performance monitoring. They include:
-
delay (e.g. share of delayed data per time interval),
-
type and number of platforms (per type of sensors and per measured parameter),
-
accuracy of measurement (for temperature and salinity),
-
number of downloads and number of users.
Certain KPI series do not go back many years and cannot characterize long-term progress in equipment generations. However, the number of platforms per type or per parameter has been monitored since 2014 by Coriolis, which is sufficient to provide indications on trends. Likewise, several other monthly, weekly and daily KPIs generate sizable time series with short-term monitoring purposes, as shown by KPIs available from INS TAC (http://www.marineinsitu.eu/monitoring/, last access:11 January 2020). In future, longer series will enable the analysis of correlations between data supply and demand, i.e. between data quality KPIs and the number of downloads.
Complementary sources of KPIs are available, e.g. from the Joint WMO–IOC (Intergovernmental Oceanographic Commission) Commission for Oceanography and Marine Meteorology (JCOMM), an intergovernmental body in charge of, inter alia, co-ordinating the WMO Marine Meteorology and Oceanography Programmes. JCOMM's “in situ Observation Programme Support Centre” (JCOMMOPS) monitors and provides metrics for a range of in situ observing networks including Argo. Indicators on the array (activity, density and intensity), data flows (delivery, sensor metadata quality and timeliness) and national diversity are made available to the public on the JCOMMOPS website (https://www.jcommops.org/board, last access: 3 January 2020). Some data series started in 2000, which secures a correct historical background. Observing float arrays monitored by Coriolis and JCOMMOPS overlap; some measurement differences may arise between the two sets of floats.
Beyond the specific case of Argo, such an assessment method is based on standard KPIs and could be generalized to other ENV RIs: as pointed out by Roemmich et al. (2019), the Argo data management system has been used as a model for other observing systems.
3.2.2 Performance of analysis and forecasts: the role of observing system experiments
This subsection focuses on issues relating to ocean and atmosphere RIs. It can be generalized, with caution, to ENV RIs generating primary observational data for processing and environment monitoring and forecasting.
At the stage of environment modelling and forecasting, ocean RIs rely on real-time observations. To assess forecasting accuracy, “observing system experiments” (OSEs) have become a frequent tool. Originally designed and performed for atmospheric observations, OSEs were adapted to ocean observations. The latter are assimilated into models for improving ocean analysis and forecasts; the performance of an observing system must then be assessed based on its impacts on ocean models and forecasts.
The traditional OSE method consists of running an ocean model under various observation use scenarios: a given subset of past observations (e.g. satellite altimetry or part of the Argo profiles) is withheld from an assimilating system for a given ocean model. The resulting forecast error on real observations allows for an indirect assessment of the impact of assimilating the subset of information withheld for a given assimilation method. Based on a similar methodology, “observing system simulation experiments” (OSSEs) are used to quantify the potential impacts of new assimilation techniques and new generations of observation instruments. OSSEs use simulated observations from a free-running model, called “nature run”. Used as environmental truth, these simulations are assimilated into the ocean model; observing system experiments are then performed by comparing the forecasts generated by the model with simulations from the nature run.
In the recent past several OSE-based studies analysed the impacts of Argo on ocean observing systems and forecasting (Turpin et al., 2016). In the framework of the E-AIMS (Euro-Argo Improvements for the Copernicus Marine Service) research project, designed to improve Euro-Argo, a range of contributions using OSEs and OSSEs were summarized in Rémy and Le Traon (2015). OSEs were also applied to GOOS components, including satellite altimetry, Argo and non-Argo floats (Oke et al., 2015a), and regional observing systems, in order to provide the GOOS with additional constraints for initializing ocean models and to resolve regional and local processes (Oke et al., 2015b). Note also that OSSEs were performed within the AtlantOS project (see Sect. 2.2) to assess the impact of Deep Argo observations for analysis and forecasting (Roemmich et al., 2019).
The traditional OSEs presented in these publications calculate the root mean square of the difference (RMSD) between forecast and real-time observations to measure the impacts of a specific set of observations. Turpin et al. (2016) assesses the impacts of Argo data assimilation on the short-term real-time analysis and forecast of sea surface temperature and salinity. It summarizes OSEs conducted in 2012. These OSEs include the assimilation of observations from satellites, from all in situ instruments other than Argo and from a share of the Argo array (100 %, 50 % or 0 %). The results show that the impacts of Argo profiles on RMSD for temperature and salinity are significant from sea surface to −2000 m: the use of Argo data can lead to a 20 % to 50 % decrease in RMSD for temperature on the 700–2000 m depth layer and 30 % to 65 % for salinity.
More generally, the findings from Turpin et al. (2016), Oke et al. (2015a, b), and Rémy-Le Traon (2015) emphasize the significant impacts of Argo. They include the following points:
-
The diversity of OSEs, though based on different approaches, permits the conclusion that the use of Argo profiles has positive impacts on real-time ocean analysis and forecasting in a wide range of cases including short- and long-term analyses, ocean properties up to 2000 m depth and sea level analysis.
-
Regarding sea level analysis, Argo observations on seawater properties are critical to complement satellite altimetry and constrain the ocean state analysis.
-
These remarks must be qualified: the results may vary depending on seawater parameters and the state of deployment of Argo. For certain parameters and ocean regions, non-Argo observation networks are as important as Argo.
-
The results obtained from OSEs and other experiments depend on the ocean models and data assimilation systems which are used, as emphasized by Turpin et al. (2016) and Oke et al. (2015b). It is therefore impossible to draw general conclusions in quantitative terms from each specific experiment.
-
Some monthly OSEs were performed with different specific subsets of observations being withheld from assimilation, e.g. XBTs, satellite altimetry, tropical Pacific buoys or Argo (Oke et al., 2015a). Results show complementarity between the different subsets in terms of forecasting performance: this important conclusion provides key knowledge about ocean observations, beyond an Argo-specific assessment.
Observing system experiments are therefore an important tool for assessing the impacts of the GOOS in terms of forecasting performance. Using simulations, the method is also relevant to analyse the expected impacts of the use of new instrument generations.
3.2.3 From ENV RI performance to downstream impacts
This subsection briefly considers the methods used to assess the downstream impacts of ENV RIs on value-added services and end users.
While performance indicators are relevant assessment tools for the first stages of the data supply chain from primary observations to free-of-charge monitoring services, the second stage involves commercial activities subject to markets where players' performance is subject to competition. Relevant impact assessment methods must then consider this competitive framework and include market-related indicators, e.g. the number of value-added businesses, or the amount of demand for data and services. The PwC (2016) report offers examples of such standard economic indicators through the analysis of Copernicus data users. The work is based on an inquiry on a substantial sample of CMEMS data users and their business characteristics. The inquiry permits the classification of the different types of data users and evaluation of the size of the ocean-related value-added service market, based on the income generated to service providers. For instance, the 2015 income was estimated at EUR 5.6 to 8.6 million. It was expected to grow substantially and reach nearly EUR 28 million in 2020.
This example shows that relevant indicators can be drawn from such an inquiry to assess the downstream impacts on environmental data product markets. Similar inquiries, if performed on a periodical basis, would provide useful information on downstream impacts.
For consistency purposes, a proper assessment of downstream impacts would also require a cross-section analysis of the first- and second-stage performance indicators. Studying possible correlations between indicators of the two types would give indications on interrelationships between the quality and performance of observational data and the size of value-added service markets. However, such an analysis is difficult, as it would require data from a sufficient number of second stage market inquiries. The issue must be left open.
3.2.4 Downstream impacts on knowledge development
As said earlier, the OECD (2016) proposes a list of indicators which can help to quantify the general impacts of RIs. The list includes 25 “core impact indicators” and 33 “additional indicators”, most of which are quantitative and classified per RI objective (e.g. “promote education outreach and knowledge transfer” and “provide scientific support to public policies”) and per main impact category (e.g. scientific impact; technological impact; and training and education). Indicators include, inter alia, the number of citations received by publications using the RI; number of projects funded by external grants; number of projects developed with other RIs; number of PhD students from universities using the RI; and number of staff in full-time equivalents.
Such indicators are relevant for an indirect assessment of the long-term economic impacts of Argo. The Argo community is concerned to keep Argo data relevant for the diversity of users to “deliver societal benefits” (Roemmich et al., 2019). Among Argo data users, research and education are considered essential and some elements of the metrics mentioned above are used to assess the importance of their demand for data. Riser et al. (2016) uses the number of publications since the beginning of the Argo programme (2100 papers in the refereed science literature until 2016); Roemmich et al. (2019) uses the number of PhD theses having used Argo data (about 300).
3.2.5 Summary of downstream impact assessment
Summarized above are the practical approaches to assessing the impacts of the different stages of the data supply chain, from observational data acquisition to monitoring, forecasting and customized value-added services.
KPIs, as applied to in situ observations, provide combined information on observational data quality, the number of platforms and the size of demand (number of downloads). Generally, the set of relevant KPIs will depend on the nature and objectives of ENV RIs.
OSEs are considered herein in relation to ocean forecasts. They prove useful for assessing (1) forecasts, based on the combined use of in situ and satellite data, and (2) the contribution of Argo to the performance of forecasts. In future, it will be essential to have similar OSEs analysing the contribution of the new components of ocean observing systems, e.g. Deep Argo.
KPIs and OSEs have different scopes of application. Combined, they are a valuable step toward the assessment of ocean RIs' downstream impacts. Periodical performance monitoring, based on routine OSEs, would be an essential complement for assessing the value of the GOOS at its present and future stages (cf. Oke et al., 2015a; Rémy and Le Traon, 2015; GODAE OceanView Science Team, 2014).
Further downstream, more data will be necessary to study the impacts on ocean data users, including value-added service providers and the correlations between performance indicators and the demand for ocean data products.
Finally, it is important to monitor the use of ENV RIs by research and education, which gives indications of their long-term economic impacts and societal benefits. Indicators are available for this purpose, some of which have been used to appraise the importance of the Argo programme.
3.3 Assessment of feedback impacts
This section focuses on the impacts of the entire supply chain of an ENV RI – from infrastructure supply to value-added services – on environmentally sensitive users. This supply chain responds to society's need for environmental knowledge by providing observational and processed data; these data are used by economic activities and other end users for increasing efficiency, competitiveness and welfare. In certain cases, the data are used to better respond to environmental hazards and uncertainty.
Cost–benefit analysis is a classic tool to test whether an ENV RI project serves public interest. It consists of calculating the benefits to environmental data users in terms of increased welfare, efficiency and avoided costs, minus the costs of the project. This section addresses the methodological issues raised by the assessment of feedback impacts from ENV RIs and discusses examples of CBAs on weather and ocean observing systems and some specific issues raised by the case of Argo in particular.
3.3.1 Examples of CBAs on ocean observing systems
Since the 1990s, several CBAs were performed to assess the expected impacts of ocean observing systems. Four examples of CBAs are summarized below. The three first were published at an early stage of the development of in situ ocean observing systems and were intended to evaluate the relevance of public support for the investment projects. A fourth example, published later, was related to the future Global Monitoring for Environment and Security (GMES; renamed Copernicus in 2013), with the same evaluation purpose.
Sassone and Weiher (1997) focus on the El Niño–Southern Oscillation (ENSO) phenomenon and its impacts on the US agricultural sector and analyse the potential impacts of improved ENSO forecasts.
Solow et al. (1998) also analyse the value of improved ENSO forecasting to US agriculture but with a focus on cropping strategies.
Kite-Powell and Colgan (2001) consider the local marine activities in the Gulf of Maine (GoM), which could use and benefit from the development of an ocean observing system, for e.g. maritime transport.
Cedre2 and Ifremer (2009) analyse the potential impact of GMES monitoring and forecasting services on the prevention and mitigation of an oil spill event.
These CBAs rely on methodological options concerning (a) the categories of data users to consider in the analysis; (b) the definition of the notion of “improved forecasts” with reference to a baseline scenario which must also be defined; (c) users' sensitivity to observations and forecasts and their adaptation capabilities, in terms of consumption or business strategy, to new sets of environmental information; and (d) the spatial scale and time period of the analysis.
Sassone and Weiher (1997) build on progress in ENSO forecasting capabilities and on the findings of the Tropical Ocean–Global Atmosphere (TOGA) project (1984–1995) on coupled tropical-ocean–atmosphere modelling. The aim of the paper is to discuss the relevance of a projected, government-funded, research programme combining an extension of TOGA and an ENSO observing system (EOS) to make routine ENSO forecasts. To this end, a CBA assesses the development of TOGA–EOS versus a baseline scenario in which the research programme is not carried out. Projected costs are based on past TOGA costs and government expectations for EOS costs; projected benefits are for the US agriculture sector. The overall benefits for agriculture are the sum of farmers' profit and consumers' surplus, farmers being assumed to gradually accept forecasts and adapt their strategy accordingly: gradual adaptation is translated in quantitative terms. Annual costs and benefits to the agriculture sector are estimated for 10-year and 20-year periods from 1995. They allow for calculating an internal rate of return (IRR)3.
Solow et al. (1998) focus on farmers' cropping strategies: the yields of the different types of crops depend on climate conditions, which in turn depend on ENSO phases (i.e. warm or cold climatic phase or no climatic event). Farmers optimize benefits by adjusting cropping strategies (or crop mix) to the forecasts of ENSO phases per US agricultural region. Using a meteorological model (for precipitation forecasts) and a plant growth model (for crop yield forecasts), the economic surplus from an ENSO phase prediction (i.e. benefits minus losses to producers and consumers) is calculated in a scenario with such a prediction versus a baseline scenario without a prediction.
An essential feature of Solow's methodology is that a statistical model is used to take prediction skills into account, as expressed by a probability of realization of the predicted phases. Farmers adjust cropping strategies by maximizing their expected surplus, given a range of ENSO phase predictions. An economic model of the agriculture sector is used to calculate the expected surplus resulting from changes in crop yields and crop product markets (prices and quantities). The economic surplus is then summed over all phase predictions weighted by the probability of realization of each prediction.
Kite-Powell and Colgan (2001) focus on some of the major maritime activities in the Gulf of Maine: maritime shipping, commercial fishing and fish farming, boating and leisure fishing, search and rescue, and oil spill management. Ocean observations are generated by the Gulf of Maine observing system (GoMOOS). The study differs from the two preceding examples by its focus on the general impacts of a regional ocean observing system on a set of maritime activities. The potential benefits of additional ocean information are expressed in terms of lower operating costs and higher value-added for businesses, lower travel costs for recreational activities, and lower management costs of accidental pollution due to more efficient damage prevention. Potential benefits are difficult to quantify for certain activities, as some of the usable data the observing system would produce remained to be defined at the date of publication of the paper.
InterRisk (2006–2009) was a research project funded by the European Commission. The aim was to develop a pilot project of GMES monitoring and forecasting services for environmental risks and crisis management in marine and coastal areas. In one of the deliverables, Cedre and Ifremer (2009) focussed on the impacts of improved information on coastal seas regarding the capacity to respond to a specific oil spill incident. The study benefitted from experience gained by Cedre in oil spill management: Cedre has acquired a significant amount of information and data on damage and response costs generated by oil spill incidents and on impacted activities. It intervened in the wreckage of the Erika oil tanker in the Bay of Biscay (December 1999) when a 40 000 t oil spill impacted a large part of the Bay of Biscay coast, including natural and tourist sites, ports, marinas, and fisheries and fish farming zones. The Erika incident was used as a case study. (1) Costs and losses incurred by marine and coastal activities from the Erika incident were estimated according to insurance claims and administrative data. The activities and industries included in the assessment were fisheries, aquaculture, salt production, coastal hotels and tourist visits; impacts also concerned coastal private and natural assets and equipment and material supply to fisheries and for aquaculture, seafood processing, and local tourism. Public response to oil spills was also included in the costs. (2) Potential mitigation of the spill was estimated and expressed in the percentage of the oil spill volume, using GMES ocean forecasts. (3) Avoided losses for coastal activities were expressed in percentage of the total losses incurred in the baseline scenario (no GMES), using damage mitigation estimates.
3.3.2 Summary on CBAs on ocean observing systems
The CBAs examined above (see Table 4) are ex ante analyses: they assess the potential economic impacts in scenarios where more information would be available to users. This requires assumptions on the impacts of this information surplus on users' behaviour: how will users adjust their consumption, production and management strategies to improved forecasts? In this respect, the above CBAs can be classified into two main categories.
Table 4Four examples of cost–benefit analyses of observing infrastructures used for ocean forecasting and climate monitoring.
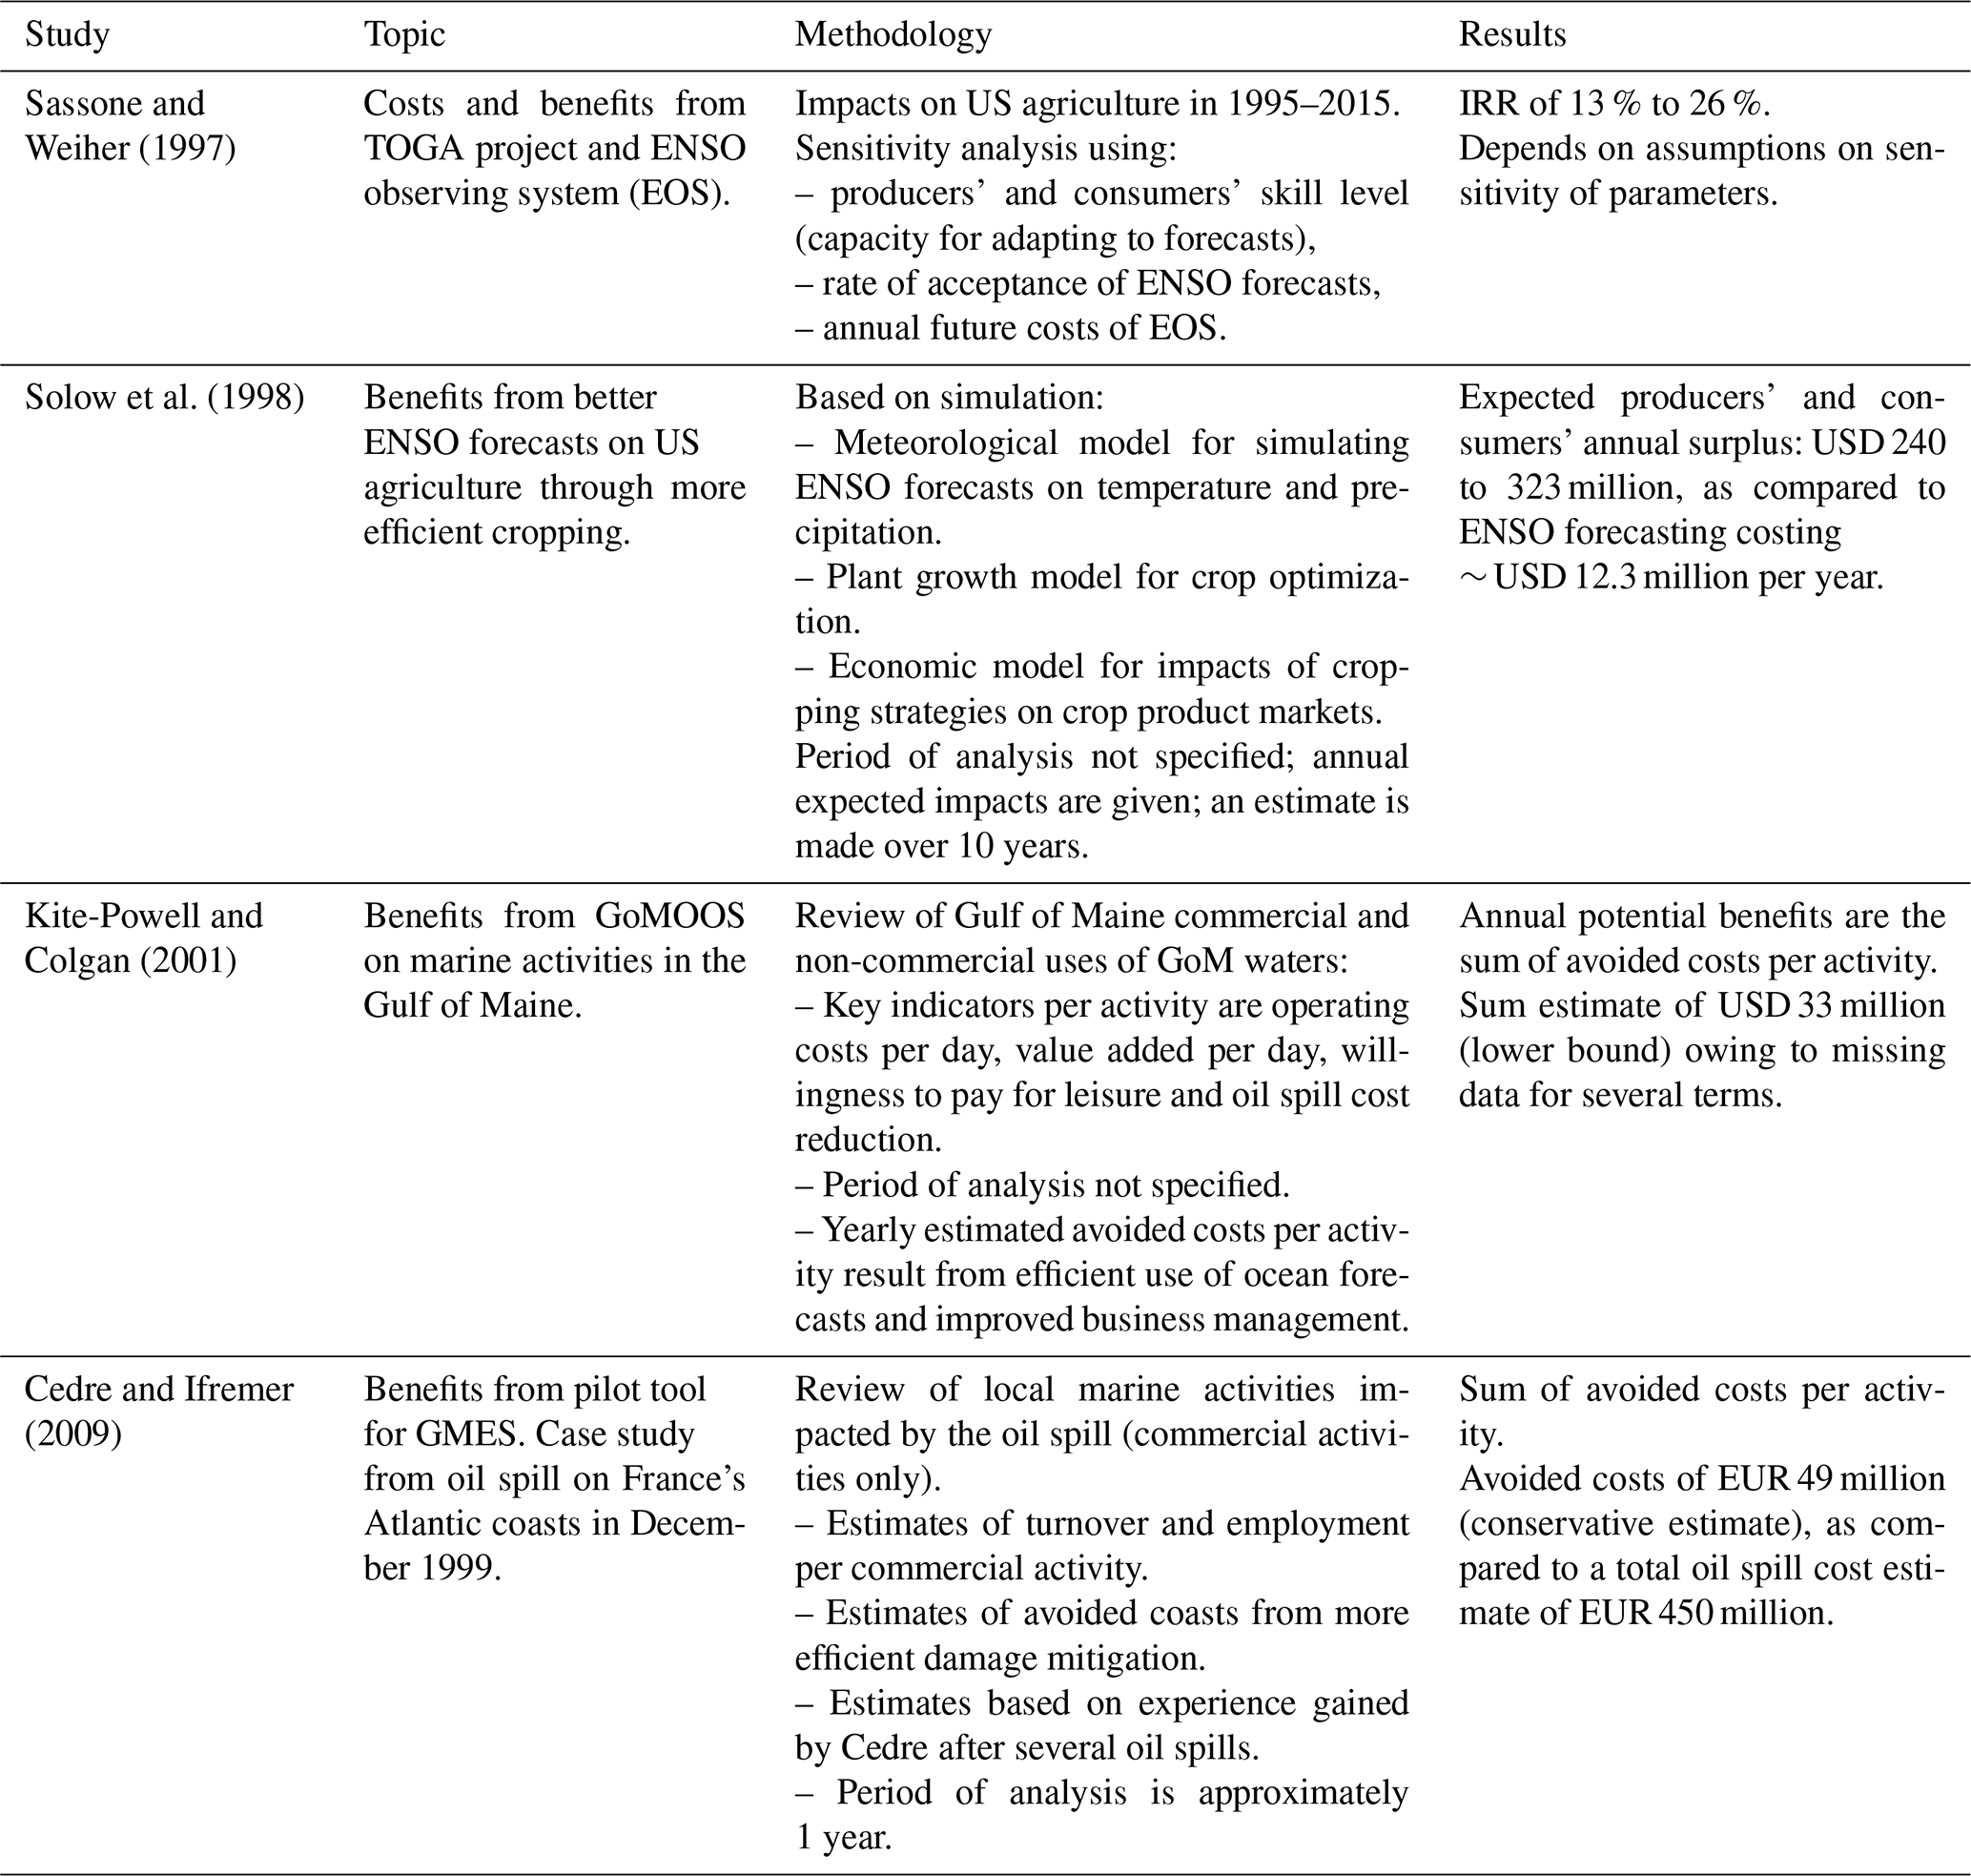
TOGA: Tropical Ocean Global Atmosphere. ENSO: El Niño–Southern Oscillation. GoM: Gulf of Maine. GoMOOS: Gulf of Maine Ocean Observing System. GMES: Global Monitoring for Environment and Security.
The first category (Sassone and Weiher, 1997; Solow et al., 1998) considers a single activity on a country scale, namely the agriculture sector, whose development strongly depends on climatic conditions. In terms of methodology, a systematic analysis of the value of predictions for cropping strategies can be made, based on an economic model of decision making under uncertainty, using long data series. Better ENSO predictions lead to more efficient decisions and increased production, which in turn lead to an increase in the expected economic surplus for farmers. The analysis can be extended to formalizing farmers' gradual acceptance of predictions over a given time period. Gradual acceptance is expressed in terms of an increasing share of the population of farmers using the forecasts. This determines the evolution of the overall economic surplus over time.
The second type of CBAs (Kite-Powell and Colgan, 2001; Cedre and Ifremer, 2009) considers several categories of ENV RI data users, with the spatial scale being limited to a given region. The analysis relies on a diversity of expertise, as several maritime activities are included in the assessment. In the studies of the second type, there is no assumption on how users' strategies adapt to forecasts, given the practical difficulty to make an assessment with specific assumptions on each user category.
In short, one method focuses on the impacts on a single category of users. These users improve their business strategy, using a set of improved observations and predictions: users' responsiveness to predictions is key for explaining how benefits (avoided costs) can be generated. The other method considers several user categories with strategies adapted to improved information. A wide range of expertise is then required to estimate benefits per category.
3.3.3 The question of the feedback impacts of Argo
The above classification of CBAs helps to discuss the methodological issues linked to the assessment of the feedback impacts of Argo, considered as a separate entity.
While the above CBAs analyse the impacts of an entire ocean observing system, an assessment limited to Argo would focus on the specific impacts of a component of the system. The assessment methodology would require a three-step approach: (1) assess the impact of Argo data on ocean models, monitoring and forecasts; (2) describe and assess how improved monitoring and forecast data would impact users' production and consumption strategies; and (3) assess the benefits to users resulting from improved strategies, in terms of increased efficiency and cost savings.
The first step refers to the method outlined in Sect. 3.2.2 on downstream impacts. Observing system experiments can serve to quantify the impacts of Argo in terms of forecasting accuracy, measured by the mean error of forecasts. The experiments considered in Sect. 3.2.2 show that Argo data significantly improve ocean circulation models and forecasts, but these experiments were carried out within short time periods (within a given year or even a given month). They depend on ocean models and data assimilation methods, and quantitative results should not be generalized. It is therefore difficult to draw general conclusions from the available studies, without, as suggested by Oke et al. (2015a) and Turpin et al. (2016), additional quantitative results from further experiments.
For the second step, it is necessary to analyse Argo users' sensitivity to improved ocean forecasts and their willingness to use new information. The assessment would require a baseline scenario describing user behaviour under a non-Argo ocean observing system. To our knowledge, quantitative information is missing on such sensitivity that would require data on users' behaviour. In terms of methodology, it remains to be seen whether the statistical model used by Solow et al. (1998) can be adapted to several categories of user with different behaviour towards improved weather and ocean forecasts.
The third step requires estimating how new information elements, as produced by Argo data, would impact users' benefits (rapid acceptance and the use of new data would better contribute to risk mitigation strategies and increase benefits to users). The approach would require solid expertise on each user category.
Beyond the uncertain feasibility of a CBA on Argo, these methodological remarks give an overview of the material needed for the exercise.
The option proposed in this paper is to subdivide the economic impacts of ENV RIs into upstream, downstream and feedback impacts. The paper provides an overview of the main assessment methods currently used for each impact category. Argo is an example of ocean RI which helps to address a wide spectrum of methodological issues, due to its specificities in terms of equipment and infrastructure and the diversity of data users.
The assessment of upstream economic impacts is an essential step as infrastructure, equipment and maintenance supply are key to the development of ENV RIs and research capacities. The assessment methods require detailed economic data both on upstream supply businesses and ENV RI demand. Data availability is one of the main practical difficulties, especially in cases where information is limited by commercial confidentiality.
The methods of downstream impact assessment depend on the uses of ENV RI data products at the different stages of the data supply chain, including observational data collection, environmental monitoring services and customized value-added services. The methods examined in this paper are mainly based on non-monetary performance indicators. A key issue of this category of assessment is the need for analysing correlations between performance indicators, the demand for ENV RI data and the size of the value-added service segment. In other terms, performance indicators are useful to analyse data quality in detail, but there is a need for broadening the scope of the approach and assessing the impacts of ENV RI performance on the overall data and service supply chain.
The selected examples of feedback impact assessment are based on CBAs. They help to compare benefits to society with ENV RI costs. The entire data supply chain associated to an ENV RI is involved in these impacts: it provides more knowledge about the environment to research and monitoring services and forecasts to end users, who benefit from gains in efficiency and risk avoidance capacity. The complex challenge is now to design methods to assess the feedback impacts of ENV RI additional components, as exemplified by the current and future expansion of Argo. This raises the question of the economic information available to characterize the different steps of the incremental development of ENV RIs in terms of performance of the data products and services, the size of environmental data markets, and end users' production and consumption strategies.
Illustrated above are the numerous methodological issues. The recommendations drawn from this review concern (1) the need for more detailed data on upstream supply businesses and a monitoring of ENV RIs' purchases; (2) the need to analyse correlations between performance indicators and demand for data; and (3) the need to improve knowledge about environmentally sensitive user categories and their responsiveness to the availability of improved environmental data.
In this respect, it will be useful to analyse in more detail the data requirements from research, not only in terms of the amount of ENV RI data but also in terms of the type, quality and frequency of the data required. In the operational domain, more information on the impacts of new data on users' behaviour may come from insurance markets and new risk coverage instruments. Inter alia, they may provide information on the interrelationships between categories of environmental risks and demand for data per user category. They may become a source of information for improving the methodological framework.
No other datasets than those presented in the cited studies and articles have been used for preparing the present article.
The author declares that there is no conflict of interest.
The author is grateful to the referees for their helpful comments which led to significant improvements in this article and to Alison Chalm (Ifremer) who reviewed a late version. He is grateful to the Coriolis, Euro-Argo ERIC office, E-AIMS and JERICO project teams for providing useful material. The ENVRI PLUS project made it possible to carry out the work summarized in the present article.
This article is a summary of a research conducted within the ENVRI PLUS project (grant no. 654182) funded by the European Commission H2020 programme.
This paper was edited by Jon Tennant and reviewed by Dwight Owens and Antti Pursula.
Barrow, C., Loveland, R., Terkla, D., Flanagan, T., and Proshina, A.: The marine science and technology industry in New England, Haldey, USA, University of Massachusetts, Donahue Institute, 24 pp., 2005.
Carval, T., Coatanoan, C., and Cancouet, R.: Argo data management report 2018, Coriolis DAC & GDAC. Ifremer/IRSI/ISI-DTI/RAP-18-102, 41 pp., https://doi.org/10.13155/58109, 2018.
Cedre and Ifremer: INTERRISK. Estimation of avoided consequences of the crisis linked to the setup of project tools, D6-4, WP 600, Task 5, 14 pp., Brussels, 2009.
ESFRI (European Strategy Forum on Research Infrastructures): Roadmap 2018, Strategy Report on Research Infrastructures, August 2018, Milano, Università degli Studi di Milano, 229 pp., 2018.
Euro-Argo European Research Infrastructure Consortium: Strategy for evolution of Argo in Europe, EA-2016-ERIC-STRAT, Brest, France, Euro-Argo ERIC, 67 pp., https://doi.org/10.13155/48526, 2017.
European Commission, Directorate-General Internal Market, Industry, Entrepreneurship and SMEs: Digital Transformation Monitor, Big Data in Earth Observation, 7 pp., Brussels, European Commission, July 2017.
GODAE OceanView Science Team: Strategic Plan 2015–2020, Exeter, UK, GODAE OceanView Project Office, 54 pp., 2014.
Groupe interministériel sur la politique de diffusion des données d'observation de la Terre à partir de l'espace: Politique de diffusion des données d'observation de la Terre à partir de l'espace, Paris, Ministère de l'Industrie, des Postes et Télécommunications et du Commerce extérieur, 78 pp., 1995.
Kite-Powell, H. L. and Colgan, C. S.: The potential economic benefits of coastal ocean observing systems: The Gulf of Maine, Washington, National Oceanic and Atmospheric Administration, Office of Naval Research, Woods Hole Oceanographic Institution, 13 pp., 2001.
MENESR (Ministère de l'Education nationale, de l'Enseignement supérieur et de la Recherche): Politique de diffusion des données d'observation de la Terre, Paris, 78 pp., 2004.
OECD (Organisation for Economic Co-operation and Development): Reference framework for assessing the scientific and socio-economic impact of research infrastructures, DSTI/STP/GSF(2019)/FINAL, March 2019, Paris, OECD, 50 pp., 2019.
Oke, P. R., Larnicol, G., Fujii, Y., Smith, G. C., Lea, D. J., Guinehut, S., Remy, E., Alfonso Balmaseda, M., Rykova, T., Surcel-Colan, D., Martin, M. J., Sellar, A. A., Mulet, S., and Turpin, V.: Assessing the impact of observations on ocean forecasts and reanalyses: Part 1, Global studies, J. Oper. Oceanogr., 8, s49–s62, https://doi.org/10.1080/1755876X.2015.1022067, 2015a.
Oke, P. R., Larnicol, G., Jones, E. M., Kourafalou, V., Sperrevik, A. K., Carse, F., Tanajura, C. A. S., Mourre, B., Tonani, M., Brassington, G. B., Le Henaff, M., Halliwell Jr., G. R., Atlas, R., Moore, A. M., Edwards, C. A., Martin, M. J., Sellar, A. A., Alvarez, A., De Mey, P., and Iskandarani, M.: Assessing the impact of observations on ocean forecasts and reanalyses: Part 2, Regional applications, J. Oper. Oceanogr., 8, s63–s79, https://doi.org/10.1080/1755876X.2015.1022080, 2015b.
PwC: Copernicus Market Report. Issue 1, 96 pp., November 2016, Luxembourg, Publication Office of the European Union, https://doi.org/10.1787/3ffee43b-en, 2016.
Reilly, K., Cusack, C., Fernández, V., Buch, E., and Ott, M.: Atlantic Ocean Observing Networks: cost and feasibility study, AtlantOs project-633211, D1.4, Galway, Marine Institute, 84 pp., 2018.
Rémy, E. and Le Traon, P.-Y.: Final synthesis report, E-AIMS, D3.341, Brest, Ifremer, 9 pp., 2015.
Riser, S. C., Freeland, H. J., Roemmich, D., Wijffels, S., Troisi, A., Belbéoch, M., Gilbert, D., Xu, J., Pouliquen, S., Thresher, A., Le Traon, P.-Y., Maze, G., Klein, B., Ravichandran, M., Grant, F., Poulain, P.-M., Suga, T., Lim, B., Sterl, A., Sutton, P., Mork, K.-A., Vélez-Belchí, P. J., Ansorge, I., King, B., Turton, J., Baringer, M., and Jayne, S. R.: Fifteen years of ocean observations with the global Argo array, Nat. Clim. Change, 6, 145–153, https://doi.org/10.1038/nclimate2872, 2016.
Roemmich, D., Alford, M. H., Claustre, H., Johnson, K., King, B., Moum, J., Oke, P., Owens, W. B., Pouliquen, S., Purkey, S., Scanderbeg, M., Suga, T., Wijffels, S., Zilberman, N., Bakker, D., Baringer, M., Belbeoch, M., Bittig, H. C., Boss, E., Calil, P., Carse, F., Carval, T., Chai, F., Conchubhair, D. Ó., d'Ortenzio, F., Dall'Olmo, G., Desbruyeres, D., Fennel, K., Fer, I., Ferrari, R., Forget, G., Freeland, H., Fujiki, T., Gehlen, M., Greenan, B., Hallberg, R., Hibiya, T., Hosoda, S., Jayne, S., Jochum, M., Johnson, G. C., Kang, K., Kolodziejczyk, N., Körtzinger, A., Le Traon, P.-Y., Lenn, Y.-D., Maze, G., Mork, K. A., Morris, T., Nagai, T., Nash, J., Naveira Garabato, A., Olsen, A., Pattabhi, R. R., Prakash, S., Riser, S., Schmechtig, C., Schmid, C., Shroyer, E., Sterl, A., Sutton, P., Talley, L., Tanhua, T., Thierry, V., Thomalla, S., Toole, J., Troisi, A., Trull, T. W., Turton, J., Velez-Belchi, P. J., Walczowski, W., Wang, H., Wanninkhof, R., Waterhouse, A. F., Waterman, S., Watson, A., Wilson, C., Wong, A. P. S., Xu, J., and Yasuda, I.: On the Future of Argo: A Global, Full-Depth, Multi-Disciplinary Array, Front. Mar. Sci., 6, 439, https://doi.org/10.3389/fmars.2019.00439, 2019.
Sassone, P. G. and Weiher, R. F.: Cost benefit analysis of TOGA and the ENSO observing system, in: Operational oceanography: the challenge for European co-operation, edited by: Stel, J. H., Behrens, H. W. A., Borst, J. C., Droppert, L. J., and van der Meulen, J. P., Proceedings of the First International Conference on EuroGOOS, 7–11 October 1996, The Hague, Elsevier Oceanography Series, 62, 36–50, 1997.
Solow, A. R., Adams, R. F., Bryant, K. J., Legler, D. M., O'Brien, J. J., McCarl, B. A., Nayda, W., and Weiher, R.: The Value of improved ENSO prediction to US Agriculture, Climatic Change, 39, 47–60, 1998.
Turpin, V., Remy, E., and Le Traon, P. Y.: How essential are Argo observations to constrain a global ocean data assimilation system?, Ocean Sci., 12, 257–274, https://doi.org/10.5194/os-12-257-2016, 2016.
The “Classification of Economic Activities in the European Community” (referred to by its French acronym, NACE) is a hierarchical classification of EU economic activities with 21 sections, 88 divisions, 272 groups and 615 “classes”. Member states' National Statistical Institutes develop national versions of the NACE adapted to their respective economies.
Cedre is a French state agency created in 1978 after the oil spill from the Amoco Cadiz oil tanker. It provides technical advice and expertise to French and foreign authorities and businesses in charge of responses to accidental marine pollution, particularly oil spills.
IRR is a discount rate at which a project, given its yearly costs and benefits, has a net present value of cumulated cash flows of zero at the end of a given time period. If the real discount rate is expected to be less than IRR over a period to come, real benefits are expected to exceed real costs at the end of the period.