the Creative Commons Attribution 4.0 License.
the Creative Commons Attribution 4.0 License.
 | 16 Sep 2024
The weather today rocks or sucks for my tree: exploring the understanding of climate impacts on forests at high school level through tweets
Jan C. Schubert
Annette Debel
Steffen Höhnle
Kathy Steppe
Sibille Wehrmann
Achim Bräuning
With the progression of global warming, impacts on the human sphere will undoubtedly increase. One prominent example at mid-latitudes is the stress on forests caused by climate change, which the BayTreeNet project (https://baytreenet.de/, last access: 30 July 2024) addresses from an interdisciplinary viewpoint. Scientists from physical climatology, dendroecology, and educational research collaborate to examine how long-term changes in weather patterns affect the state of trees, and how the atmosphere–tree relation can be used to the advantage of improving the communication of climate change effects to, in particular, high school students. This article presents a 1-week case study for the summer of 2021, when a distinct variability in weather patterns induced significant tree responses. The students of seven selected partner schools commented on the measured tree and weather data, which were available in real time, in the form of tweets and in conjunction with their educational geography program. The analyses of the tweets reveal that the students succeed in verbalizing the measured weather and, furthermore, manage to draw links between the stem diameter changes in trees and the weather variability. Problems arise with the use of less perceivable variables like the sap flow in the trees; also, the student posts exhibit shortcomings in establishing causal connections. Hence, the case study points to a discrepancy between describing basic environmental information and appreciating or understanding the underlying mechanistic links. This point will serve to refine future classroom concepts and, moreover, to enhance the communication of climate change effects on forests to the general public.
- Article
(1708 KB) - Full-text XML
- BibTeX
- EndNote


As the evening arrives, so does prime-time TV and one show with it – the daily weather forecast. “The world's most-watched science show” is, therefore, a statement that has appeared in the public and in the media. The implied importance of weather news has even increased with the rise of new, internet-based technologies over the past 20 years, which have led to a multiplication of weather information services. A related scientific study in the US concluded, unsurprisingly, that “weather forecasts are a daily part of the lives of the vast majority of the U.S. public” (Lazo et al., 2009, p. 775). The roots of this circumstance go far back in time – think of Aristotle's treatise Meteorologica or the century-long association of weather with the divine, which reflect the general desire of humans to understand the weather. The side effect of this deeply anchored interest is a familiarity of the public with some central (scientific) terms like high pressure, front, and cyclone and a sense of what they mean in practice for local weather phenomena or, generally speaking, for impacts (e.g., on one's own daily life, on health, or on the environment). The scientific synthesis of these terms is expressed in the systematic study of daily large-scale weather patterns in the atmosphere, which was mostly developed for central Europe in the 1940s–1950s and has become known by its German term, Großwetterlage (see, for example, James, 2007, for a short historical overview). Although the scientific concept as well as the daily consumption of the topic in public media refer to the weather, meaning the state of the atmosphere ranging from at a short moment in time to over a few days, there is also a climate dimension. Consider that certain weather patterns become less or more frequent over decades and longer time periods. The consequences will be a change in the seasonal or annual characteristics of airflow patterns (which we call the large-scale atmospheric circulation) and hence a change in the surface climate at locations within reach of the weather patterns. This relation is the starting point for connecting weather patterns to our changing climate, which has been studied extensively in recent research (see Sect. 2). What is also important is that the scientific weather pattern term mostly encapsulates the distribution of air pressure centers and the resultant large-scale circulation modes. These atmospheric dynamics are also embodied by the elements that appear on weather maps in the daily news or on our cell phones, such as the letters H or L and wind arrows, introducing the public to the basics of an important climate change aspect. The present article originates from a transdisciplinary project that aims to exploit the omnipresence of weather information in today's world and the increasing public awareness of climate change impacts on the environment, ecosystems, and human health.
In this context, a prominent impact case is the response of forests to climate change. Trees are important organisms for forest ecosystems and society as they provide ecological services, and tree-ring research (dendrochronology) is a well-established discipline to assess the impacts of climate on tree growth and to reconstruct climate conditions of the past. Although a number of concepts and tools have been developed for introducing the basics of tree-ring research in different formats to the public, such as articles or videos (e.g., Davi et al., 2022), there is hardly any tool to monitor the effects of weather on tree performance in real time and to get the relevant explanations for the climatic background. Here, we target this gap by making real-time weather and tree data available to high schools in conjunction with their geography programs in order to investigate the characteristics of climate change communication and education at the high school level. While this provides the general motivation, Sect. 2 explains the specific circumstances as well as the structure of the research and the article.
The transdisciplinary project mentioned is called BayTreeNet, and it was described in a recent publication from a conceptual viewpoint (Bräuning et al., 2022). The project was established in response to the evidence of increasing drought stress on forests in Bavaria in the most recent decades (Debel et al., 2021) and, hence, presents an effort to generate more knowledge on this threat with regard to future climates. BayTreeNet tackles the topic from the perspectives of three special fields. Physical climatology, dendroecology, and educational research collaborate, with the overarching goal of increasing public awareness and preparedness for stress on forest ecosystems under climate change, which must build on solid communication and education on the problem. Besides the transdisciplinary basis, a novel facet of BayTreeNet is to look at the climate–forest interaction at the scale of weather patterns (henceforth GWL, according to the German term, Großwetterlage, introduced in Sect. 1), which adds value to the traditional approach of relating forest responses to more aggregated climate data (e.g., monthly or annual mean values). The GWL resolution, in turn, provides the connecting link to the public weather information (Sect. 1) and is therefore a promising starting point for enhancing dissemination and education in the given context.
In the physical climatology sub-project, GWLs in the past and in the future and their manifestation at the local level are examined with the help of meteorological observations and climate modeling. An important initial result was the generation of a new climate data set for Bavaria (1987–2018) with a very high resolution in space (Collier and Mölg, 2020). The dendroecology sub-project relies on a network of measurement sites over Bavaria, where important tree growth variables are monitored (Sect. 3.1). A first study using these data concluded that the tree growth–climate relationships show an elevation dependency and, moreover, have not been constant over the past 5 decades (Debel et al., 2021). The core of the educational sub-project, in turn, is a collaboration with high schools in the vicinity of the measurement sites. Their students (grades 10 and 11 and 15–17 years old) observed the weather and tree growth data in real time, which is enabled by an accessible interface on the project web page (https://baytreenet.de/, last access: 30 July 2024), and subsequently translated their interpretation of the trees' physiological responses to simple Twitter (now known as X) posts. This translation embodies the educational aspect and provides the data for the communication research of the present study.
Individually, the three mentioned scientific fields can build on the rich literature with regard to the present topic. Investigations in climatology have, for instance, targeted the role of GWLs for health, extreme events, and hydrological and ecological processes (Bissolli and Dittmann, 2001; Post et al., 2002; Clark and Brown, 2013; Loikith et al., 2017; Psistaki et al., 2020; Zong et al., 2022). Given the concept's history (Sect. 1), central Europe has always been a focus (e.g., Riediger and Gratzki, 2014; Herrera-Lormendez et al., 2022). In dendroecology, studies on the dependence of tree growth on climatic variables in central Europe have an equally long history; some major recent focus points were, for example, how summer temperature and rainfall variability affect the growth of European tree species (Debel et al., 2021; Dulamsuren et al., 2017; Friedrichs et al., 2009; Kraus et al., 2016) and, finally, contributions from the field of educational research investigated, among other things, the incorrect or insufficient ideas of students. For example, several conceptual models of the causes of the anthropogenic greenhouse effect have been identified among students, which contradict scientific explanations (including the wrong explanation of the greenhouse effect via the hole in the ozone layer) and can hinder learning processes (Choi et al., 2010). With respect to consequences of climate change, it was shown that students can name a variety of examples but have major problems with spatial differentiation (Boyes and Stanisstreet, 1993; Leiserowitz et al., 2021). Similar results were shown to concern many adults as well (Dove, 1996).
However, to our knowledge, no scientific project has brought together the three disciplines for the purpose of fostering communication and education regarding the important topic of forest response to climate change. In the present article, we make a first effort to synthesize the multidisciplinary data through a 1-week case study for the early summer of 2021. The main goal is to examine what level of understanding exists among high school students about the forest–atmosphere interactions by considering the associated Twitter data. Our working hypothesis is that students are successful at translating weather data into words in a basic sense (henceforth called “verbalizing”), yet more difficulties exist with verbalizing tree data and, in particular, with correctly describing the relationships between weather and tree data. This hypothesis is derived from the considerations that weather reports and conversations about the weather are a part of the students' everyday life (see Sect. 1), while the terms related to the state of trees are much less known, so students have less practice in verbalizing information on tree growth. Hence, linking weather and tree data represents the greatest challenge and involves a comparatively high complexity.
To realize our approach, we selected a week with obvious variability in weather patterns and tree responses and, at the same time, with a relatively high number of student tweets. Since identifying such a week involved screening the physical-science data as well, we first present the climatological and dendroecological input from our project in Sect. 3; this is a preparatory step that is needed to comprehend the entire study. The actual communication (educational) research is then presented in Sect. 4 before the conclusions in Sect. 5.
3.1 Data and methods
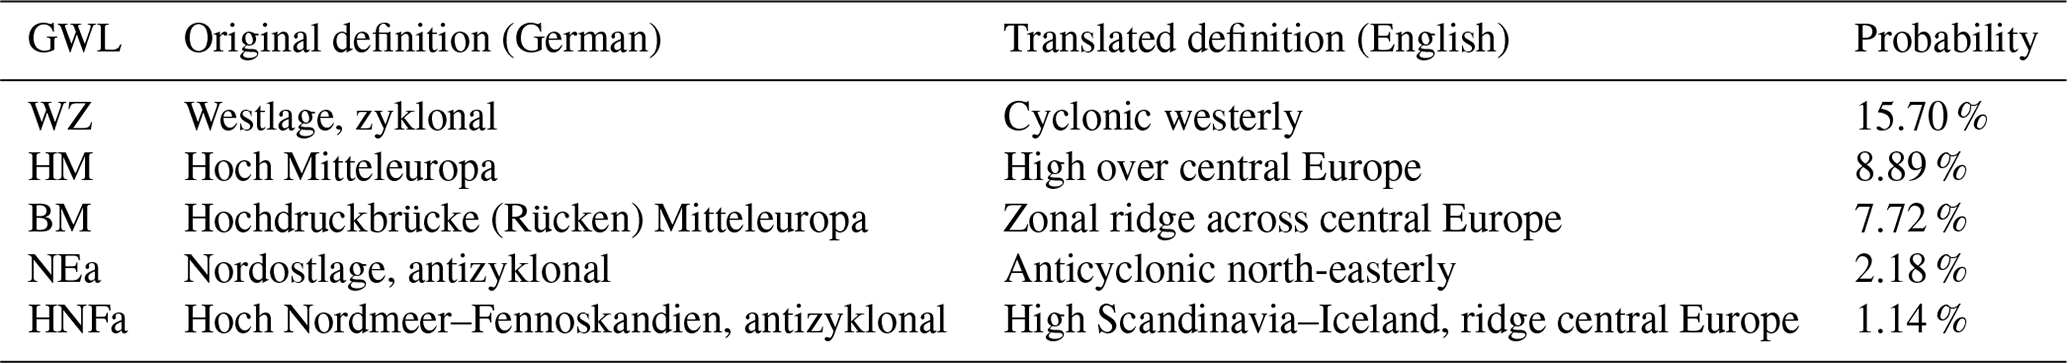
Weather pattern classification. In climatology, daily values of sea-level pressure and geopotential height at 500 hPa (roughly the mid-troposphere level) are the typical input variables for the classification of GWLs. The most common and popular classification was introduced and published by Hess and Brezowsky in 1952 (Hess and Brezowksy, 1952) in the catalogue of GWLs in Europe (see James, 2007), which contains daily weather patterns since 1881. The national German Meteorological Service (DWD) has been using this classification since then. The manual classification of Hess and Brezowsky yields 29 types of GWL, which are characterized by the air pressure pattern, cyclonicity, main direction of large-scale airflows, and vorticity (Werner and Gerstengarbe, 2010). The distribution, intensity, and characteristics of high- and low-pressure systems define the different types of GWL, which need to last at least 3 consecutive days. GWL types show different occurrence probabilities during the year and vary among the seasons, and each GWL can bring significantly different weather to certain regions and locations in Europe. Table 1 summarizes some relevant aspects of the traditional GWL scheme, which is the basis for the present study.
Table 1Some examples of definitions of the 29 GWLs (frequent ones and relevant ones for our study) in original German and translated into English after James (2007) and their mean annual probabilities (1881–2008) after Werner and Gerstengarbe (2010).
Wood formation detection. In the dendroecology sub-project, we have established a dendroecological network of 11 study sites (initially 10) to monitor responses of forest ecosystems to changing climate dynamics at different temporal resolutions. While long-term growth changes, adaptations of the wood anatomical structure, and adaptation of intrinsic water use efficiency are assessed at decadal to annual timescales, cambial growth dynamics and stem diameter variations are monitored at interannual to even hourly resolution. While these dendroecological sample sites are located inside forests, an additional monitoring method detects tree responses to changes in the environment in real time. For this purpose, single trees close to each sample site were equipped with an internet-based logger and sensors to measure sap flow and stem diameter variations. The sap flow sensor measures the sap flow transport rates (cm3 h−1) from the roots to the crown (Smith and Allen, 1996; Steppe et al., 2010, 2015; Vandegehuchte and Steppe, 2012). The point dendrometer registers stem diameter changes (in mm) caused by the reversible shrinking and swelling of living stem cells in 20 min intervals. These are visible as daily cyclic stem diameter variations, the amplitudes of which inform us about the water status of the tree (Deslauriers et al., 2007; Drew and Downes, 2009; Steppe et al., 2015). In addition, the dendrometer records the irreversible growth of the xylem and phloem by the formation of new xylem (wood) and phloem (bark) cells, which becomes apparent as a long-term trend of increasing the stem diameter superimposed onto the daily radial variations. While under humid conditions, the long-term trend is positive, tree stems may shrink in diameter to a certain extent under drought conditions. The mentioned sensors were developed by the research group at Ghent for the initiative TreeWatch.net, details on which can be found in Steppe et al. (2016).
3.1.1 Data preparation
These two high-precision instruments indicate the individual trees' responses to varying GWLs and the associated weather conditions, such as, for example, a heavy rain event or a heat wave. The measured data are transmitted in real time to the PhytoSense cloud service, which is a tool for data storage, analysis, processing, and running model simulations to visualize the trees' hydraulic function and carbon status (Steppe et al., 2016). Finally, the processed data are sent to the project homepage (https://baytreenet.de/, last access: 30 July 2024), where the physiological data of each “talking tree” are graphically displayed. At the same time, information about the current weather at each site, e.g., precipitation and temperature, is available on the homepage. This includes a map of central Europe, with the current flow patterns at the 500 hPa (∼ 5 km) and 850 hPa (∼ 1.5 km) geopotential height levels, and a weather map indicating the location of fronts. Therefore, the short-term responses of trees to weather and long-time tree growth become detectable and displayable.
3.2 Results: weather variability and tree response
Calendar week 22 in the early summer of 2021 (31 May to 6 June) was deemed appropriate for this case study. In this week, two GWLs were present: NEa (anticyclonic north-easterly) on Monday, Saturday, and Sunday (31 May and 5 and 6 June) and HNFa (High Scandinavia–Iceland, ridge central Europe) from Tuesday to Friday (1 to 4 June). Both GWLs are typical weather types for the early summer season and show their maximum likelihood in May (HNFa) and June (NEa). Measured against the full year, they occur at a probability of 1.41 % (NEa) and 2.18 % (NEa) (see Table 1). The two GWLs belong to anticyclonic types, and they typically induced the highest average air temperatures in the recent past. For example, HNFa shows a deviation of +4.36 °C in the daily mean air temperature with reference to the period of 1951–1978 (Werner and Gerstengarbe, 2010). Considering precipitation, both GWLs coincide with drier conditions on average; however, the drying signal is not as significant as the warming signal.
These average anomalies are consistent with the air temperature characteristics in June 2021, as seen in the measurements at the official DWD weather stations. In this month, particularly high temperatures were recorded throughout Germany, and daily anomalies of up to +4.5 °C (compared to the 1961–1990 mean) occurred locally. For southern Germany, the situation was very similar. In the case study week, the air temperature anomaly increased over time until 3 and 4 June, when it reached the maximum departure of +4.9 °C (same reference period), and it subsequently decreased until the end of the week. These characteristics are also reflected in four stations close to our tree sites (Fig. 1), which were selected on the basis of reliable tree data and sufficient Twitter posts. Precipitation at the 35 DWD weather stations in southern Germany shows a steep increase from 3 June, with its maximum on 5 June and a subsequent decrease on 6 June. At three of the four sites investigated, a precipitation event is recorded on 5 June with values up to 20 mm (Wunsiedel), while at the fourth site (Veitshöchheim), this occurs 1 d later with a value of more than 30 mm (Fig. 1).
To summarize the case study week, strong positive air temperature anomalies were measured in southern Germany and Bavaria (after cold phases in May), reaching their maximum roughly in the middle of the week. Shortly after this temperature maximum, precipitation occurred after several days of drought. Thus, the selected 1-week window was characterized by a transition to warmer and wetter conditions.
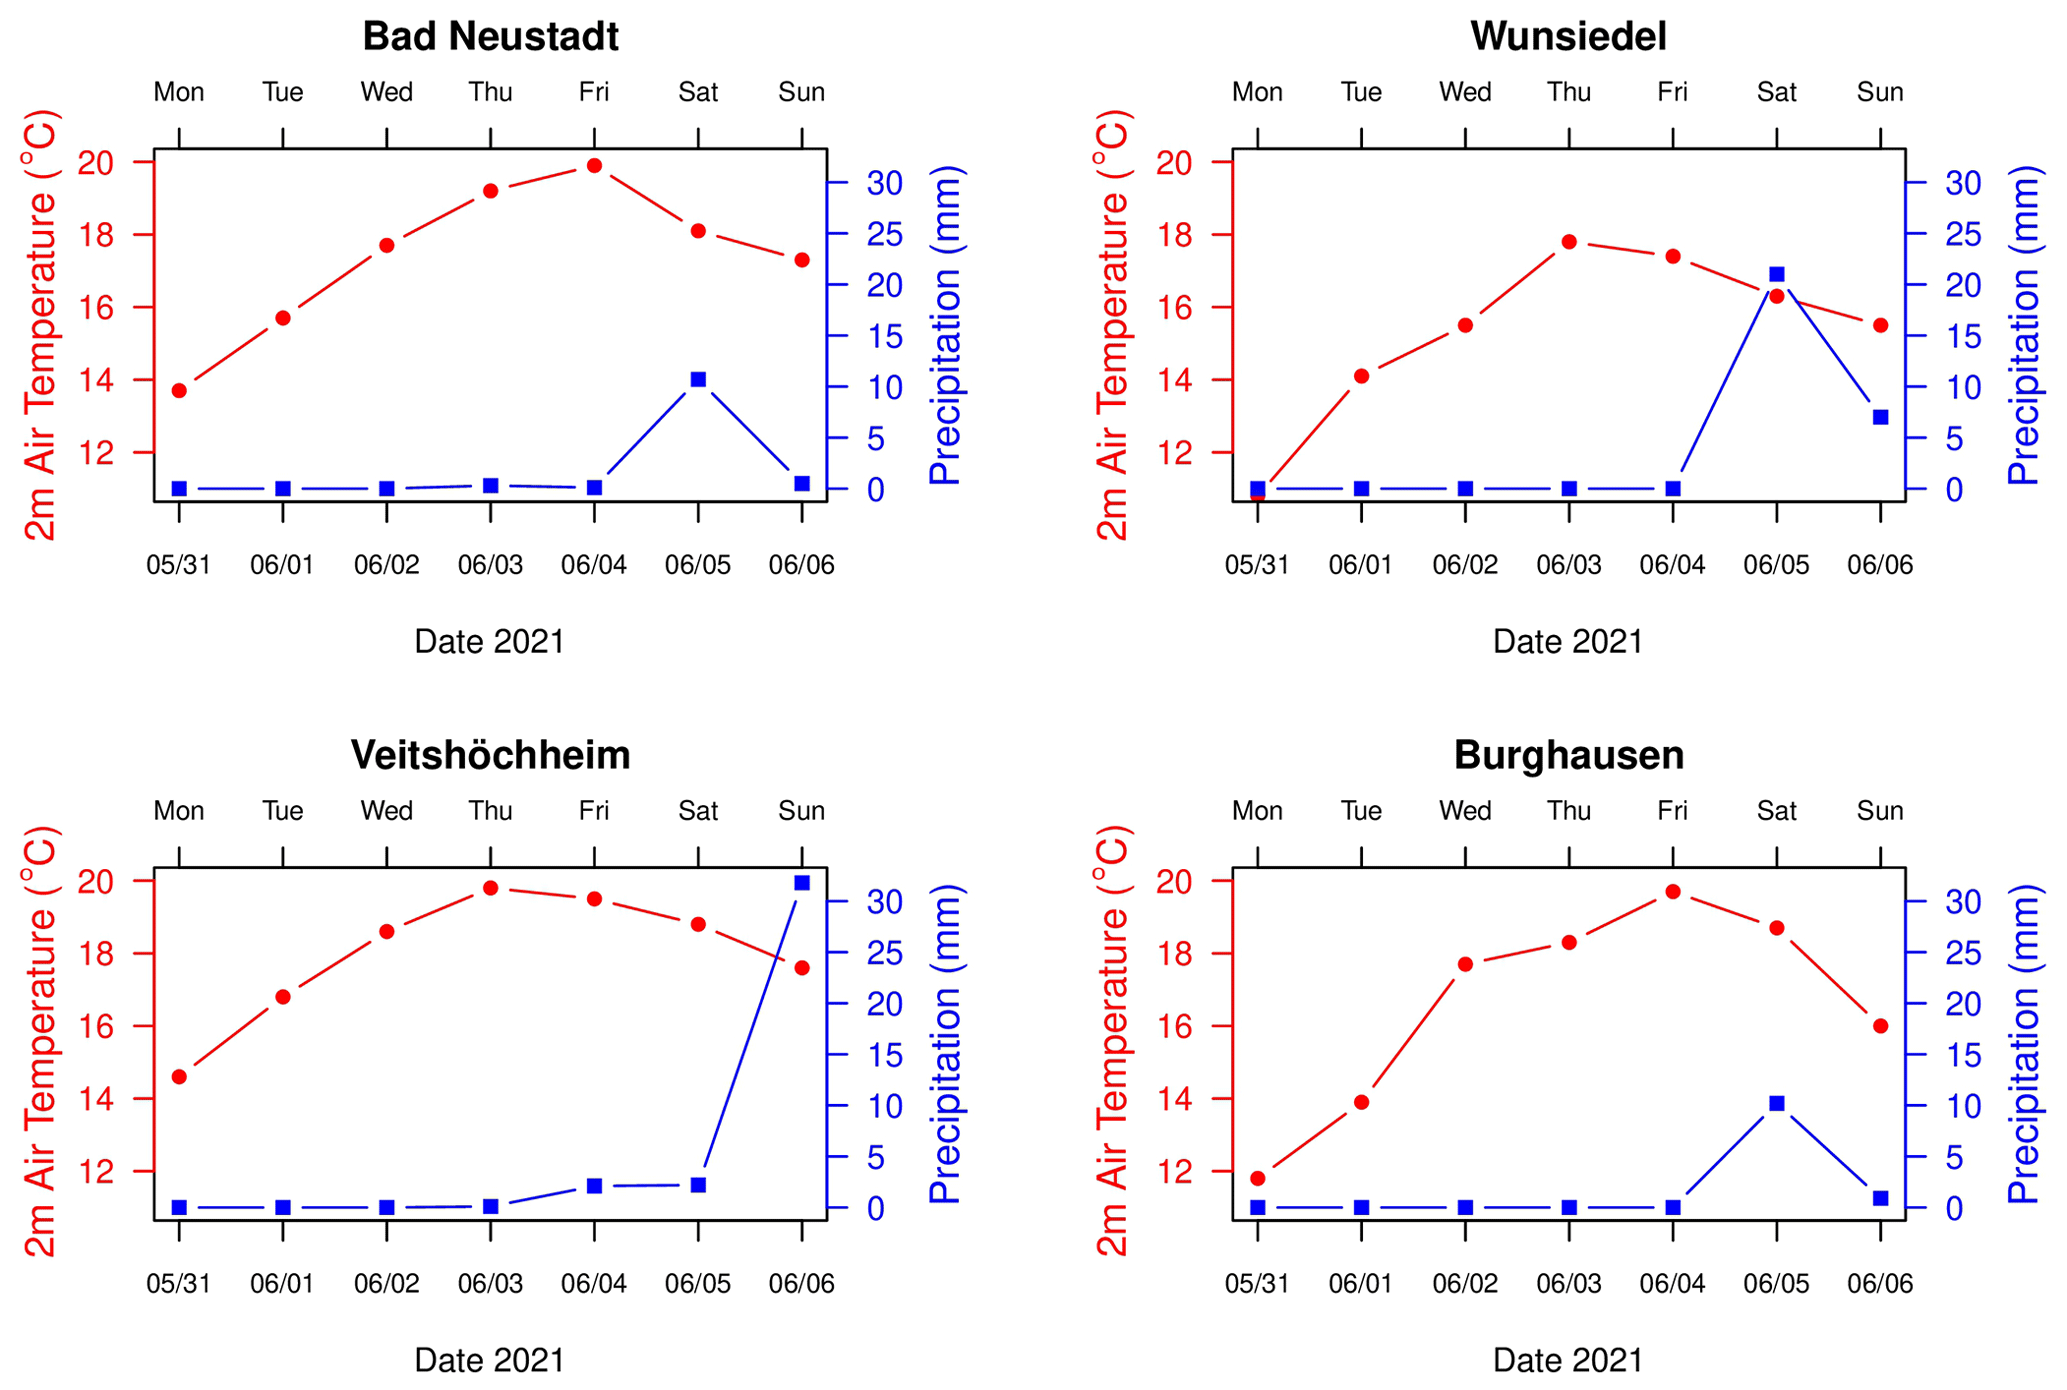
Figure 1Air temperature (dots) and precipitation (rectangles) at 2 m at four selected weather stations in Bavaria during calendar week 22 of the year 2021 (data from DWD).
How did these atmospheric conditions affect the sample trees? In general, most talking trees showed similar responses to the prevalent weather. The tree responses only differed in the timing between different locations since the rain events happened asynchronously between sites, as discussed above.
From 1 to 4 June, the influence of the HNFa weather pattern (with its dry and warm weather conditions) led to characteristic tree physiological response patterns (e.g., Steppe et al., 2015) that indicate sufficient water supply without water shortage (Fig. 2). Initiated by transpiration and regulated by the stomata, the water transport from the roots to the crown started shortly after sunrise. Consequently, the sap flow rate increased rapidly in the early morning, peaked around noon, and remained at a high level until the evening. After sunset, the sap flow rate dropped to the pre-dawn level, showing minimum values in the early morning hours before the beginning of the new day's cycle.
The dendrometers recorded daily cycles of diameter changes, mainly due to the repeated shrinking and swelling of the stem caused by the depletion and replenishment of the stem water stored in wood and bark tissues. Stem diameters decreased in the morning, shortly after sunrise, since photosynthesis started and water transpired through the open stomata. As long as transpiration persisted and water flowed from the roots to the crown, the water reserves in the stem depleted and the stem diameter shrank. After sunset, the stem diameter began to increase again due to the cessation of transpiration and the refilling of water reserves in the stem (Steppe et al., 2006). Beside these daily cycles, the maximum stem diameters increased day to day because of irreversible stem growth driven by turgor and formation of new xylem cells.
With the occurrence of rather strong rain events later in the week, both data series show a significant change (Fig. 2). On the one hand, the sap flow rate of most (7 out of 10) trees did not increase to the same degree as in the days before, and, furthermore, the sap flow of all talking trees decreased earlier around midday. A high cloud cover fraction and high air humidity reduced transpiration; hence, the stem water transport declined during and after the rain event. On the other hand, the talking trees overwhelmingly showed a sharp increase in diameter shortly after the rainfall. Moreover, the diameter curve showed no decline during the daytime, pointing to continuous refill of the internal water storage pools that were emptied during the preceding dry period. Thus, higher air humidity and less vertical water transport caused intensified water storage in stem cells. As a result, the cells got water-saturated, and the depletion effect (causing a decrease in diameter) was mitigated.
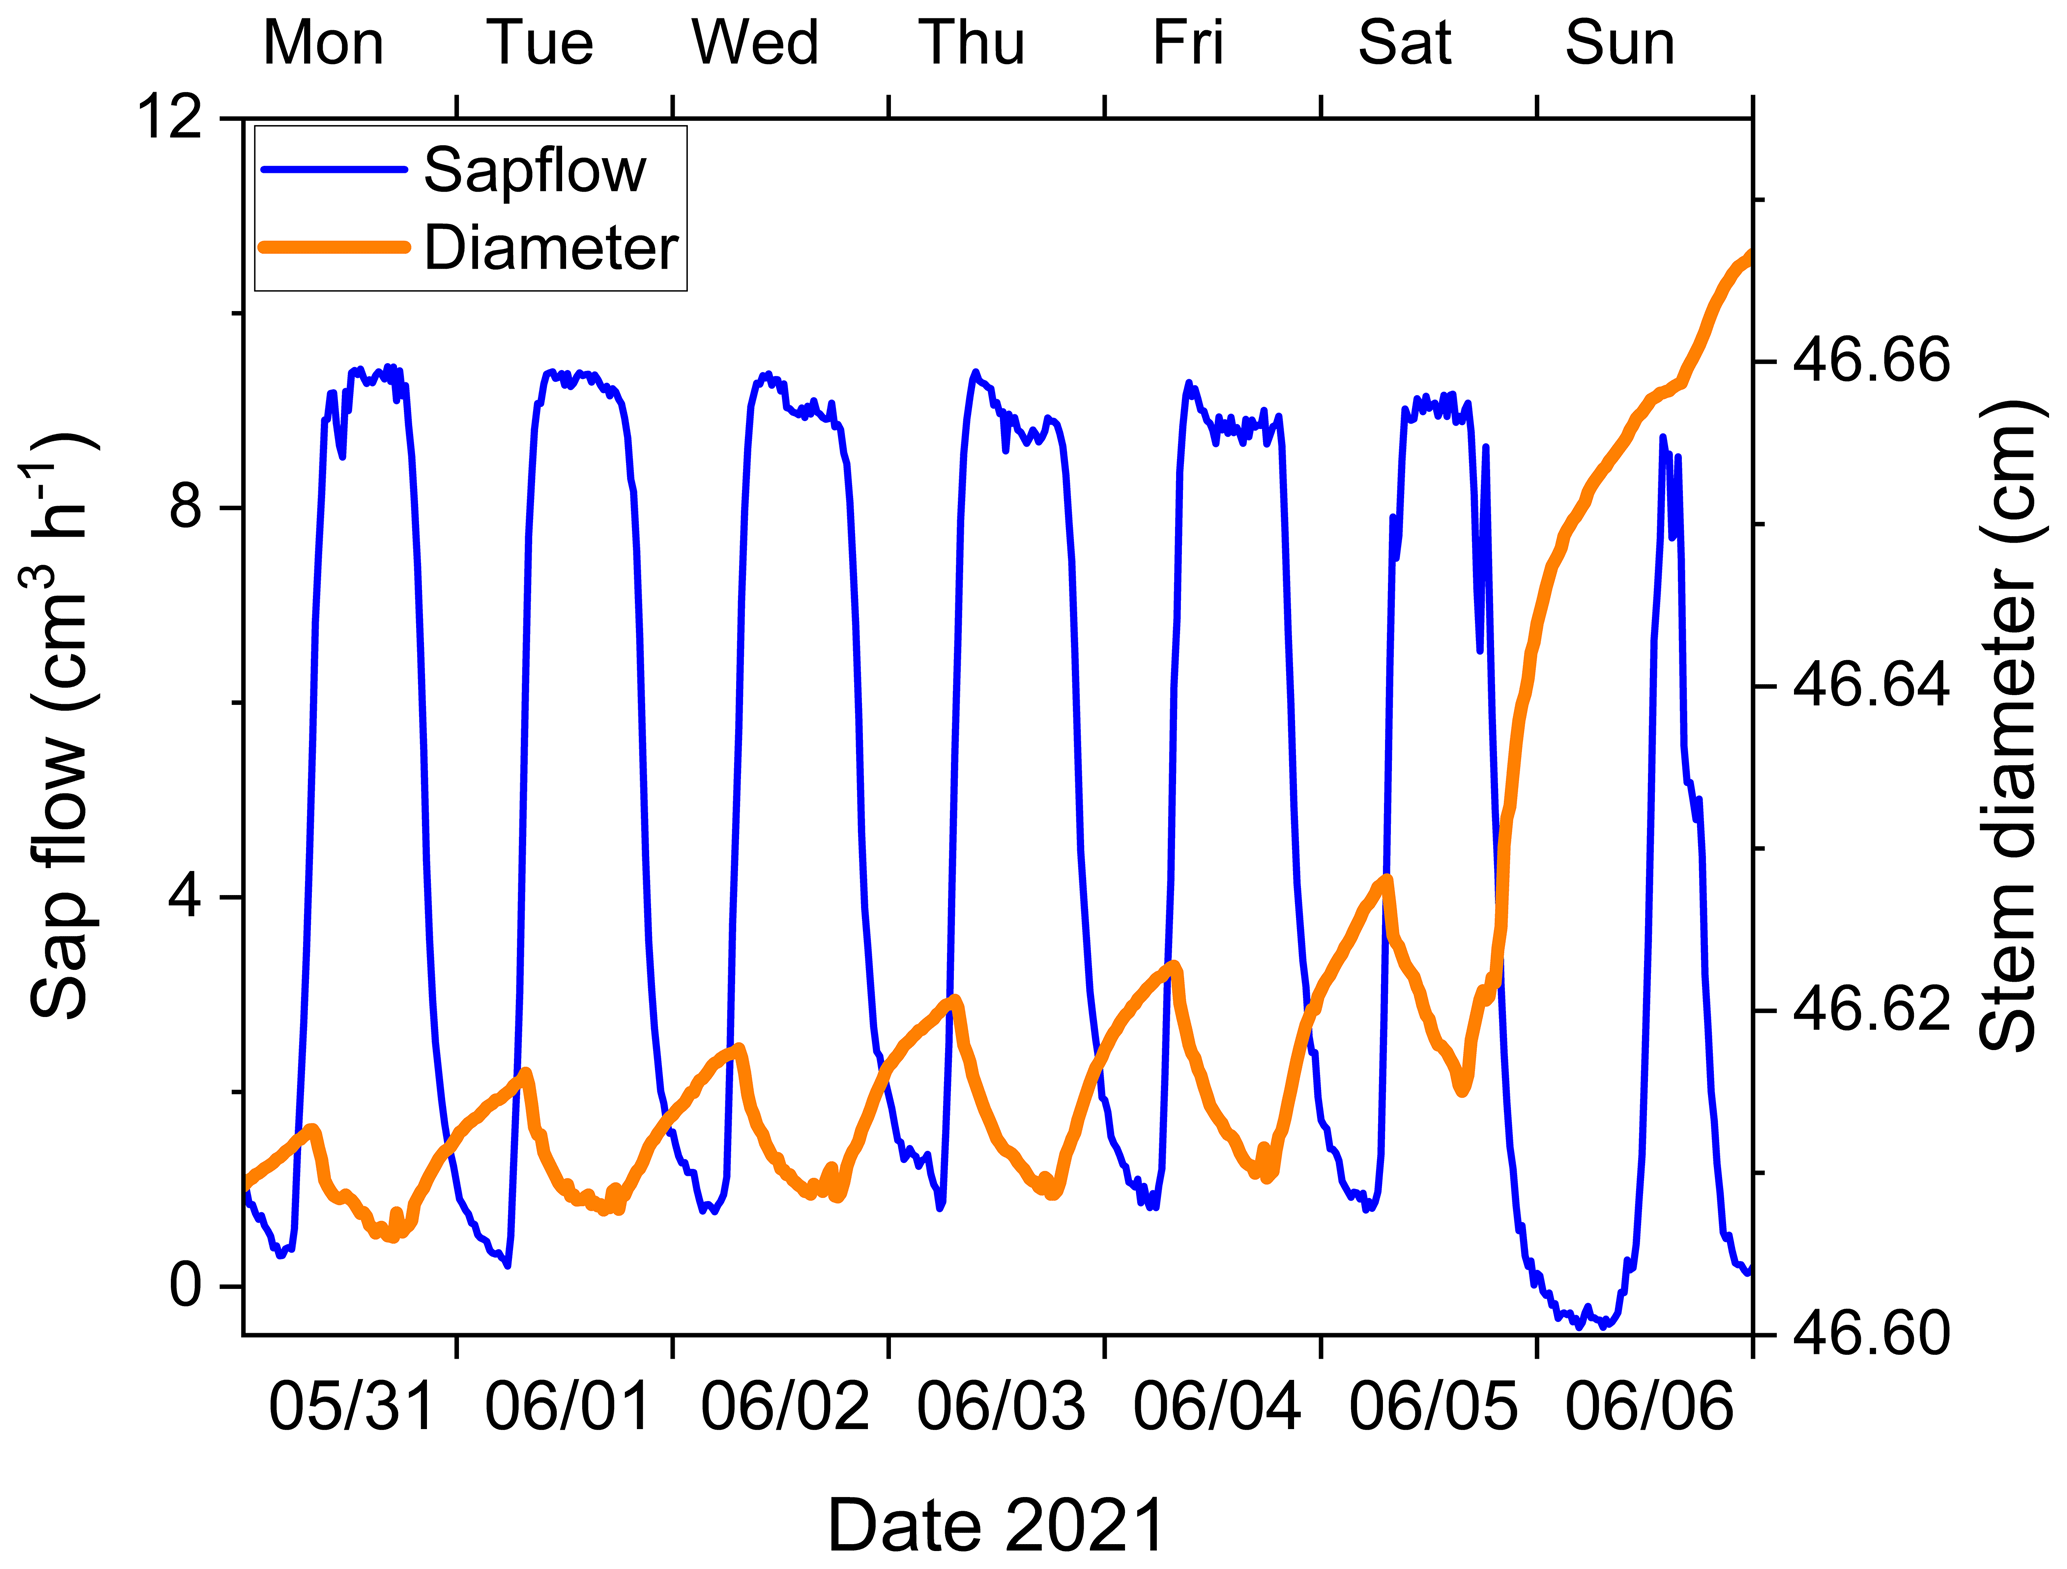
Figure 2Stem diameter variations and sap flow rates of Tilia platyphyllos at Burghausen as an example of tree response during the period 31 May to 6 June 2021. Note that from 5 to 6 June, precipitation occurred, leading to a strong increase in stem diameter.
4.1 Methodology
We developed a half-day introductory workshop for the participating students and held it on site at each school (∼ 200 students at 10 schools initially). When the Covid-19 pandemic began, we converted the workshop into a self-study course that could be completed online. The participating groups of students changed every school year; each group took part in the course at the beginning. In terms of content, the course aimed to build up a basic understanding of GWLs as well as of tree growth conditions as these aspects play a marginal role in the curriculum and, therefore, there was little previous knowledge to refer to. In addition, exercises were included on how to interpret tree data – in particular, what does (high/low) sap flow mean and what is meant by the variation in the stem diameter of a tree? Together with the available information on current weather patterns, the students at each participating school were asked to translate the information on the tree's state as well as the connections with the weather situation into linguistic messages in the form of tweets: short, concise, and in everyday language. To practice this, exercises and examples (using current data) were included in the introductory workshop.
The participating schools dealt with the challenge of organizing working with the talking trees beyond the regular (curriculum-related) classes in different ways depending on the local situation. For this reason, the mentoring of the students after the end of the introductory workshop as well as the organization (e.g., when which students at the respective school took over the tweeting) were carried out by supervising teachers at each school. At some schools, a selected class was responsible for tweeting, while at other schools a group of voluntary students from different classes was formed to write the tweets. In addition, at some places, individual students were responsible for the tweets for a short period of time, and there was a change after 2 weeks, while at other schools, individual students tweeted for much longer. In this context, it should be noted that we asked the students to tweet as regularly as possible. As the school year progressed, the mentoring teachers tried to motivate the students by reminding them to tweet and pointing out the importance of the task. However, it was always the case that tweeting was an additional activity that was not part of the regular lessons, was not included in the grading, and was voluntary. Many students wrote the tweets in their free time, and tweeting continued at many schools even during school vacations.
The fundamental decision to use Twitter in this project was based on several reasons. Firstly, the central task was to convert data into language, which fits well with Twitter as a primarily language-based medium. Secondly, the limited number of characters per message that Twitter had implemented at the time of the project required concise writing, with a focus on the central aspects. At the same time, Twitter enables simple, low-threshold communication between users, which fit in well with the idea of letting the trees communicate with each other. In addition, it seemed easier to attract the attention of a wider public via Twitter than via conventional websites. Other social media, such as TikTok, would have probably been closer to the students' everyday lives, but the focus on visual or auditory content would have been less suitable for the project's objectives.
For the present case study, we analyzed the students' tweets during the carefully selected week in the early summer of 2021 (Sect. 3) with one guiding question: to what extent are the tweets (as linguistic translations of tree data and weather data) appropriate for the subject? The methodological procedure for evaluating the tweets involved several steps. As part of the preparation for the data analysis, the tree data as well as the tweets for all sites were reviewed, and sites where central data were missing were excluded. For the investigated period, one site was excluded due to missing tree data (Bad Reichenhall; sensor error) and another site was too because no tweets were made (Ettal). One more site (Immenstadt) could not be considered because tweets were only available for 3 d and, in addition, the tree data provided only limited meaningful information as the tree on site was dying.
For the remaining seven sites, the weather data and the tree data were prepared in the form of diagrams (e.g., Sect. 3) and the students' tweets were converted to an editable version suitable for coding. Emojis that did not influence the statement but were merely illustrative in nature were not considered in this process. Several evaluation or analysis steps followed, oriented in line with the principles of a thematic analysis (Braun and Clarke, 2006):
-
Becoming familiar with the data. Through repeated and close reading of the tweets and also against the background of weather data and tree data (as described in Sect. 3.2), an overview and a deeper understanding of the tweets were created by the researchers. This also involved description of the frequencies of tweets per site and per day.
-
Coding with initial codes. The data were coded according to five deductive categories. These included statements about (i) weather, (ii) growth/stem diameter, and (iii) sap flow. In addition, statements in which students (iv) combined two or more of these categories (for example, effects of weather on tree growth/stem diameter) were coded in a separate category. The same was true for (v) statements in which there was an exchange between students from different tree sites.
-
Search for patterns and salient features in the categorized data. Within the categories, statements were screened for characteristic commonalities or patterns. In addition, conspicuous features were examined. The guiding principle here was a comparison with the scientific basis, i.e. the weather data and tree data in the form available to the students on our homepage. This interpretative step was initially undertaken independently by two researchers, who then compared the interpretations and attempted to reach a consensual interpretation in the event of discrepancies. The results of this step were, in turn, presented and discussed in the working group, which is linked to the goal of reducing subjectivity that is present in interpretative steps.
-
Results. The results of the analyses and interpretation were summarized, written down, and supplemented in many places with illustrative quotes from the tweets (see Sect. 4.2).
4.2 Results: interpretations by high school students
The initial analysis of the tweets showed that three of the seven schools had at least one tweet for each of the seven days of the study period. For the four other schools, tweets were not available for every day, but for at least 5 d of the study period. In total, the data corpus included 43 tweets (Table 2). All 43 of the tweets contained statements about growth or stem diameter changes, of which 39 contained statements about sap flow and 37 contained statements about weather. In 13 tweets, connections were made between at least two of the three elements. A sample tweet is shown in Fig. 3.
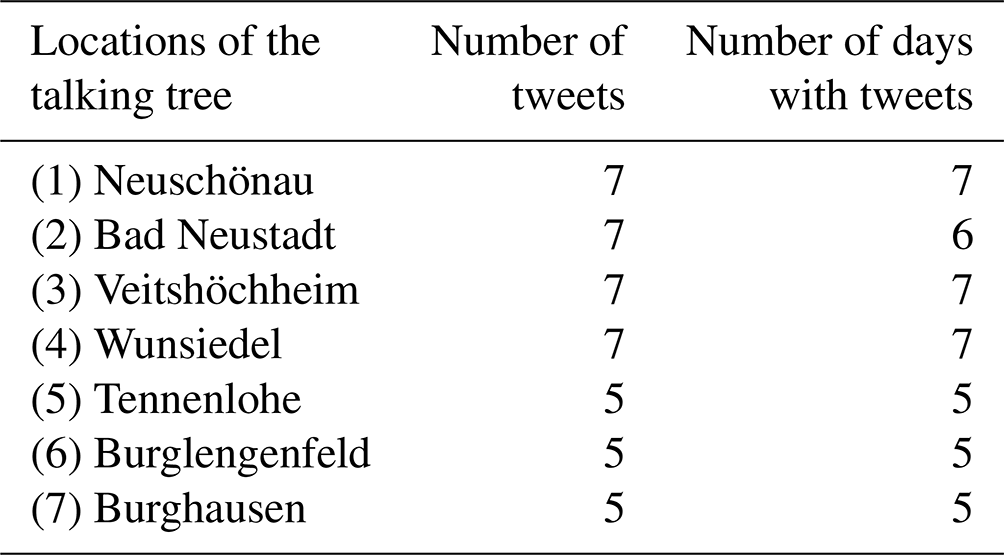
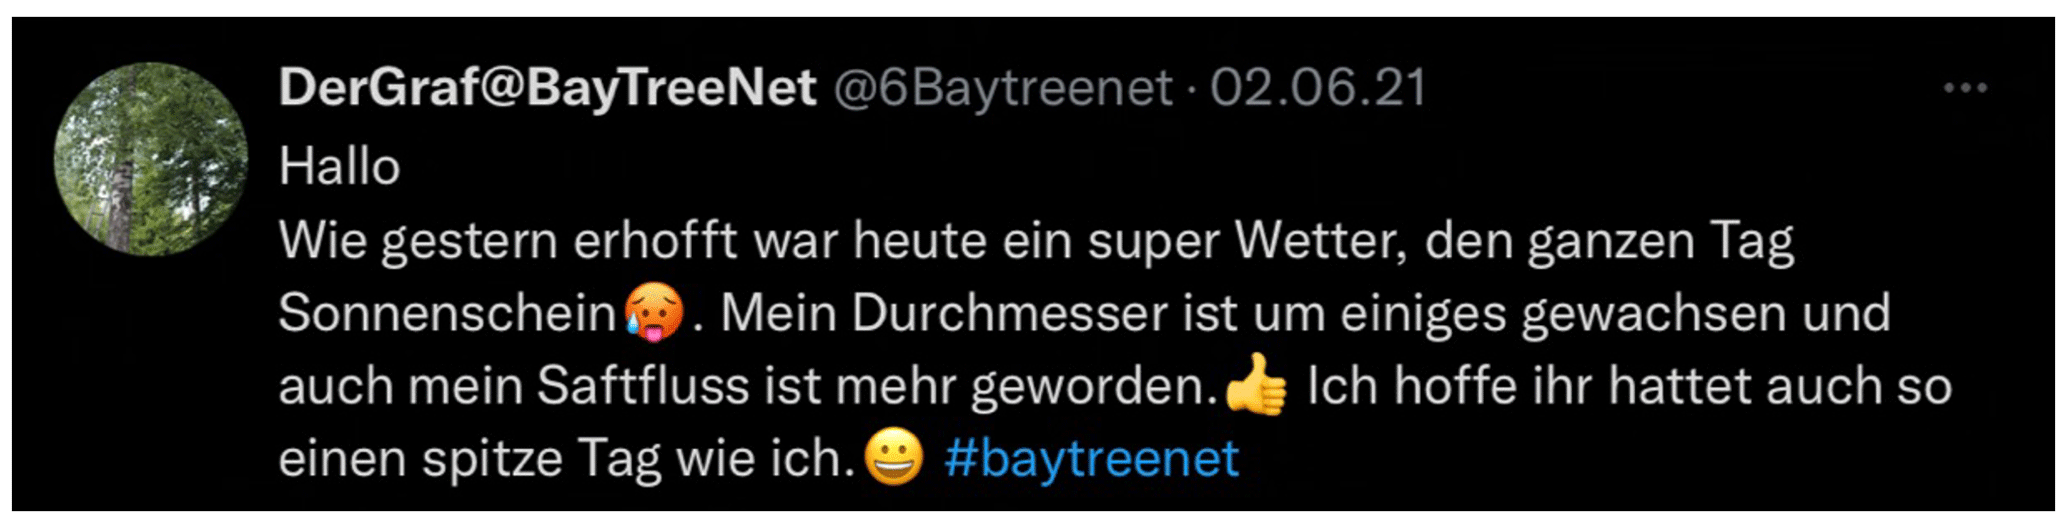
Figure 3Sample tweet for illustrative purposes at the Neuschönau location, meaning “Hello. As hoped for yesterday, today the weather was great, sunshine all day. My diameter has grown by quite a bit and my sap flow has also increased. I hope you had a great day like me” (BayTreeNet Neuschönau, 2021).
The following conspicuous features and characteristics were identified during the more in-depth analyses of the tweets.
-
Statements about the weather. The statements about the weather are almost universally in line with the weather data; even the precipitation events that occurred after preceding sunshine are correctly recognized and named.
Heute war wieder ein sonniger Tag [Today was another sunny day] (Wunsiedel)
Bei mir hat es jedenfalls geregnet und gewittert, was das Zeug hält [In any case, it rained and thundered for all it was worth at my place] (Wunsiedel)
In general, with regard to the weather, it can be seen that not all weather elements that are recognizable for the students are consistently addressed in the tweets and, moreover, relevant for the tree responses. Regarding basic weather elements, references to sunshine and cloud cover, to dryness and precipitation, and to cold and warmth would have been possible. In the tweets, however, predominantly only one of these elements was addressed. Only in individual cases were at least two weather elements cited together
Da es heute wieder angenehm warm war, hatte ich trotz Montag gute Laune, auch wenn es heute geregnet hat und es ziemlich bedeckt war. [Since it was pleasantly warm again today, I was in a good mood despite Monday, even though it rained today and it was quite cloudy]. (Tennenlohe)
In addition, at some locations, different weather elements were mentioned when comparing the days. Thus, on some days, there were comments (only) about the temperature, and on other days, (only) about the sunshine.
-
Statements on stem diameter. The growth of the trees or changes in the stem diameter were consistently picked up on in all tweets. The central common feature of most tweets is that a statement was made about the (thickness) growth of the tree stem or, more generally, that the tree had grown. However, the recognition or interpretation of the diurnal fluctuations in the stem diameter seems to be problematic. With very few exceptions, such as the quote that follows, these fluctuations were not discussed at all.
Also so im Laufe des Tages geht es ja mit meinem Durchmesser immer steil bergab, aber ich bin trotzdem ein bisschen gewachsen [Well, my diameter always goes steeply downhill during the course of the day, but I've grown a bit anyway] (Veitshöchheim)
Instead, a single value of the stem diameter was often compared with a single value from the previous day. In some cases, there were incorrect interpretations from a scientific point of view, because it was not the minimum and maximum stem diameter of one day that were compared with those of the previous or next day, but individual values at different times of the day.
-
Statements on sap flow. There is a similar number of tweets on sap flow as on the weather. It is noticeable that the sap flow was more often described in a relatively vague and superficial way compared to the weather and the stem diameter. A typical example of what was frequently found is the following:
Der Sapflow ist gut [The sap flow is good] (Wunsiedel)
With very few exceptions, such as the tweet that follows, diurnal variations in sap flow were not picked up on in the tweets.
Mein Saftfluss war heute Mittag größer als gestern, nur über den Nachmittag hin ist er gefalle [My sap flow was greater today at noon than yesterday, only dropping over the afternoon] (Neuschönau)
Instead, individual values or maximum values of different days were compared (similar to stem diameter).
-
Links between weather, stem diameter, and sap flow. Linkages in the sense of causal relationships between the weather, growth/stem diameter, and sap flow were rarely the subject of tweets. In most cases, the pieces of information on the three areas were rather unrelated to each other.
Hey Freunde. Heute war ja mal endlich Bombenwetter. Mein Saftfluss schießt durch die Decke und ich werde ein bisschen dünner. Ich hoffe euch geht's gut [Hey friends. Today the weather was finally awesome. My sap flow is shooting through the roof and I'm thinning out a bit. I hope you're all well] (Burglengenfeld)
Hallo. Wie gestern erhofft war heute ein super Wetter, den ganzen Tag Sonnenschein. Mein Durchmesser ist um einiges gewachsen und auch mein Saftfluss ist mehr geworden [Hello. As hoped yesterday, the weather was great today, sunshine all day. My diameter has grown by quite a bit and my sap flow has also increased] (Neuschönau)
If links were made, the typical pattern was to start with the weather and go to the diameter or the sap flow.
Aber durch den Regen konnte ich wenigstens wachsen [But at least I was able to grow due to the rain] (Burglengenfeld)
Mein Durchmesser ist durch das tolle Wetter nochmal ein gigantisches Stück gewachsen [My diameter has grown a gigantic amount due to the great weather] (Tennenlohe)
Links between sap flow and diameter were not made.
-
Communication between the tree sites. In many cases, the other sites or the other trees were addressed in the salutation or the closing words – “Servus Freunde” [Hello friends], “Hallöchen meine lieben Mitbäume” [Hello my dear fellow trees], and “Naja wir hören uns dann morgen” [Well, we'll hear from each other tomorrow] (Burghausen). In some cases, questions were also addressed to the other tree sites:
Wie war es denn bei euch? [How was everything going with you?] (Wunsiedel)
In contrast, an explicit mention of such questions as well as of content-related information on tree data and weather data shared by other tree sites occurred with very few exceptions.
Hi Karl. Ich glaube, dein Wunsch nach Regen ist in Erfüllung gegangen [Hi Karl. I think your wish for rain came true] (Wunsiedel)
An exchange on measured values of the level of tree data was not detectable at any site.
In terms of summary and discussion, it can be stated that the students implemented the content of the online introductory course appropriately and well or at least on the formal or surface level. The number of tweets was relatively high (daily) for most schools during the analyzed period, and the tweets commented relatively consistently on the weather, stem diameter/tree growth, and sap flow (as the three key metrics). The change in the weather on 5 June was recognized and commented on. Thus, the central goal of having students verbalize measured data was achieved. With a detailed look at the tweets as well as in comparison with the tree data and weather data available for the respective location and period, it became clear that the tweets were not comprehensive (weather) or only considered parts of the measurement data (growth and sap flow). In particular, the fluctuations in stem diameter and sap flow over the course of the day, considered individually, seem to be too complex for the students to be addressed in their tweets. The connections between sap flow and stem diameter, which are even more complex, were not addressed by the students at any point. In contrast, weather elements were used (although only in a few instances) to show the effects on the trees. This approach is scientifically correct and in line with the students' perceptions: weather and weather elements are known to students from their own experience and from weather reports (see Sect. 1), and they can also feel them with their own senses. In contrast, changes in stem diameter are not perceptible with their own senses or at least not within the resolution that occurred in the case study period. The same applies to the sap flow of trees. Both are only accessible via the sensors and graphical illustrations of the measured values. Starting from the weather, which is familiar and perceptible from everyday life, the students tried to explain the tree data.
The goal of initiating a communicative exchange between students from different tree locations was only partially successful. Although there was almost always mention of other locations, the exchange was almost without exception at a superficial level. However, there was almost no exchange or discussion of weather data or measurement data between the sites. One reason could be that even understanding one's own tree data is challenging and not always successful. Thinking through data from other trees would mean an additional increase in demand and effort.
4.3 Limitations
The results presented are subject to a number of limitations. Firstly, this is a case study in which we looked at a limited time period, which is not necessarily characteristic of other times. The decision on the period examined was deliberately made on the basis of weather and tree data, as the situations at the schools were not homogenous (see Sect. 4.1), the tweeting students changed over time, and the tweets could not be related to individual students. For this reason, the data basis does not allow for an analysis of learning gains over the course of a school year or for similar analyses, which is why we opted for a case study based on the physical-science observations. So, while the tweets can be seen as a random selection to some extent, it remains unclear whether the study period is characteristic of other time periods. In addition, there were technical problems (sensor failure at one site), and not all schools sent out tweets during the week studied.
Besides the fundamental questions about the significance of Twitter in comparison to other social media in students' everyday lives, the medium of Twitter and the associated restriction to a maximum of 140 characters per tweet played a special role. On the one hand, this allowed for the measured values to be verbalized by the students in a condensed manner and one accessible to the interested public. At the same time, discussing profound causal links between tree and weather data as well as a communicative exchange on the measurements between the sites are made more difficult by this format alone. In retrospect, it would have been useful to explicitly encourage students to submit multiple tweets within one day. At the same time, from a realistic perspective, it must be stated that looking at the tree data and tweeting already represented an additional task for the students. This made it difficult to further increase the requirements.
Therefore, overall, the fact that links between weather, stem diameter, and sap flow and between tree locations occur very infrequently cannot be clearly or solely attributed to comprehension problems or the like; one reason may also be the format (140 characters). Although in some places it can be assumed that there were indeed difficulties in comprehension, it can be seen as positive that the students succeeded in transferring the tree data into short tweets in everyday language.
If we circle back to the introduction of this article (Sect. 1), the 1-week period in summer 2021 was a good choice in the sense that it showed ample weather variability. Warming in the first half was followed by heavy rain events at our study sites, which induced significant tree responses. These were characterized by a growth in stem diameter and a high sap flow rate, while pronounced diurnal cycles were superimposed onto these weekly tendencies. In connection with the tweet data, a first idea of how high school students understand the relationship between atmospheric variability and tree responses can be shaped.
The results demonstrate that students put a focus on weather elements, which underlines the connection of people to daily weather information emphasized in the introduction. Regarding the tree variables, it seems that they pick up the stem diameter changes more easily than sap flow variability. This is not uncommon, and there may be several reasons for it: compared to sap flow, stem diameter is easier to perceive, whereas sap flow is more elaborate and abstract. In addition, trees with trunks of different thicknesses are part of our lifeworld context, and presumably more prior knowledge is available for stem changes than for sap flow. New information can be embedded in existing mental models more easily as long as the new information is consistent with the existing mental model. The extent of the importance of context and prior knowledge is well known in cognitive educational science (for example, Podschuweit and Bernholt, 2020; Witherby and Carpenter, 2022). One common problem irrespective of the tree variable was the appreciation and understanding of the distinct diurnal cycles in stem diameter change and sap flow. In the authors' experience from teaching at the university level, understanding the meaning of such daily cycles (as a form of internal climate variability) appears to be hard in general. Another common problem was that causal relationships between the various variables were hardly ever made except for some basic characteristics of how weather tendencies affect the tree responses. While this represents, without a doubt, a more complex question, the deficiency also suggests that teaching the climate as a physical cause-and-effect system could probably be enhanced at the school level. Altogether, the results confirm our working hypothesis and point to a discrepancy between verbalizing environmental information and drawing mechanistic links.
In the near future, completing the study of systematic GWLs changes over many decades is planned, which will allow the students to relate the topic more strongly to the climate change aspect. We will also attempt to maintain and even to extend the tree network in the future by either a follow-up research project or other means in public education. For future classroom sessions, teaching materials that focus on the relationship between weather conditions and the responses of trees are currently developed and evaluated. These connections are to be worked out both in general and in concrete case studies. For the latter, exemplary periods with tree data and tweets of the students will be included. In addition, further time periods with relevant weather changes and the corresponding tree reactions will be analyzed in order to better assess the robustness of the findings in this case study.
Weather data are openly available from the German Weather Service (DWD). The tree data and associated tweets can be accessed on our website at https://baytreenet.de/ (FAU Erlangen-Nürnberg, 2024) by selecting a study site and adjusting the date range to 31 May to 6 June 2021.
AB, TM, and JCS designed the study and arranged the project funding. AD, JCS, SH, and SW analyzed the data. KS supported the tree sensor data collection. All the authors contributed to the writing and editing of the manuscript, which was coordinated by TM.
The contact author has declared that none of the authors has any competing interests.
Ethical approval for this research was given by the Friedrich-Alexander-University (FAU) Erlangen–Nürnberg ethics committee.
Publisher’s note: Copernicus Publications remains neutral with regard to jurisdictional claims made in the text, published maps, institutional affiliations, or any other geographical representation in this paper. While Copernicus Publications makes every effort to include appropriate place names, the final responsibility lies with the authors.
We thank Katrien Schaepdryver, supported by the Bijzonder Onderzoeksfonds (BOF) research project TreeWatch.net (grant no. 01J07919), and Erik Moerman from Ghent University for their technical support. We also thank the teachers and students of the partner schools for their active participation in this project. And finally, we extend big thanks to the two reviewers and executive editor John K. Hillier for very helpful comments on earlier versions of this paper.
This research was funded by the Bavarian State Ministry of Science and Arts as part of the Bavarian Climate Research Network (bayklif).
This paper was edited by Katharine Welsh and reviewed by two anonymous referees.
BayTreeNet Neuschönau [BayTreeNet]: Hello. As hoped for yesterday, today was great weather, sunshine all day. My diameter has grown by quite a bit and my sap flow has also increased. I hope you had a great day like me, Twitter, https://x.com/6baytreenet?s=43 (last access: 23 November 2023), posted: 19:30, 2 June 2021.
Bissolli, P. and Dittmann, E.: The objective weather type classification of the German Weather Service and its possibilities of application to environmental and meteorological investigations, Meteorol. Z., 10, 253–260, https://doi.org/10.1127/0941-2948/2001/0010-0253, 2001.
Boyes, E. and Stanisstreet, M.: The “Greenhouse Effect”: children's perceptions of causes, consequences and cures, Int. J. Sci. Educ., 15, 531–552, https://doi.org/10.1080/0950069930150507, 1993.
Braun, V. and Clarke, V.: Using thematic analysis in psychology. Qual. Res. Psychol., 3, 77–101, https://doi.org/10.1191/1478088706qp063oa, 2006.
Bräuning, A., Debel, A., Collier, E., Höhnle, S., Mölg, T., Schubert, J.C., Thieroff, B., and Wehrmann, S.: BayTreeNet: Sprechende Bäume als Schnittstelle von Klimadynamik, Dendroökologie und Bildung für nachhaltige Entwicklung in Bayern, Mitt. der Fränk. Geogr. Ges., 67, 177–188, 2022.
Choi, S., Niyogi, D., Shepardson, D. P., and Charusombat, U.: Do Earth and Environmental Science Textbooks Promote Middle and High School Students' Conceptual Development About Climate Change?, B. Am. Meteorol. Soc., 91, 889–898, https://doi.org/10.1175/2009BAMS2625.1, 2010.
Clark, R. T. and Brown, S. J.: Influences of Circulation and Climate Change on European Summer Heat Extremes, J. Climate, 26, 9621–9632, https://doi.org/10.1175/JCLI-D-12-00740.1, 2013.
Collier, E. and Mölg, T.: BAYWRF: a high-resolution present-day climatological atmospheric dataset for Bavaria, Earth Syst. Sci. Data, 12, 3097–3112, https://doi.org/10.5194/essd-12-3097-2020, 2020.
Davi, N., Pringle, P., Fiondella, F., Lockwood, J., and Oelkers, R.: Online labs to introduce undergraduate students to scientific concepts and practices in tree-ring research, J. Geosci. Educ., 70, 73–84, https://doi.org/10.1080/10899995.2021.1927567, 2022.
Debel, A., Meier, W. J. H., and Bräuning, A.: Climate signals for growth variations of F. sylvatica, P. abies, and P. sylvestris in southeast Germany over the past 50 years, Forests, 12, 1433, https://doi.org/10.3390/f12111433, 2021.
Deslauriers, A., Rossi, S., and Anfodillo, T.: Dendrometer and intra-annual tree growth: What kind of information can be inferred?, Dendrochronologia, 25, 113–124, https://doi.org/10.1016/j.dendro.2007.05.003, 2007.
Dove, J.: Student Teacher Understanding of the Greenhouse Effect, Ozone Layer Depletion and Acid Rain, Environ. Educ. Res., 2, 89–100, https://doi.org/10.1080/1350462960020108, 1996.
Drew, D. and Downes, G. M.: The use of precision dendrometers in research on daily stem size and wood property variation: A review, Dendrochronologia, 27, 159–172, https://doi.org/10.1016/j.dendro.2009.06.008, 2009.
Dulamsuren, C., Hauck, M., Kopp, G., Ruff, M., and Leuschner, C.: European beech responds to climate change with growth decline at lower, and growth increase at higher elevations in the center of its distribution range (SW Germany), Trees, 31, 673–686, https://doi.org/10.1007/s00468-016-1499-x, 2017.
FAU Erlangen-Nürnberg: baytreenet, https://baytreenet.de/, last access: 30 July 2024.
Friedrichs, D. A., Trouet, V., Büntgen, U., Frank, D. C., Esper, J., Neuwirth, B., and Löffler, J.: Species-specific climate sensitivity of tree growth in Central-West Germany, Trees, 23, 729–739, https://doi.org/10.1007/s00468-009-0315-2, 2009.
Herrera-Lormendez, P., Mastrantonas, N., Douville, H., Hoy, A., and Matschullat, J.: Synoptic circulation changes over Central Europe from 1900 to 2100: Reanalyses and Coupled Model Intercomparison Project phase 6, Int. J. Climatol., 42, 4062–4077, https://doi.org/10.1002/joc.7481, 2022.
Hess, P. and Brezowsky, H.: Katalog der Grosswetterlagen Europas, Berichte des Deutschen Wetterdienstes in der US-Zone, 39 pp., 1952.
James, P. M.: An objective classification method for Hess and Brezowsky Grosswetterlagen over Europe, Theor. Appl. Climatol., 88, 17–42, https://doi.org/10.1007/s00704-006-0239-3, 2007.
Kraus, C., Zang, C., and Menzel, A.: Elevational response in leaf and xylem phenology reveals different prolongation of growing period of common beech and Norway spruce under warming conditions in the Bavarian Alps, Eur. J. Forest Res., 135, 1011–1023, https://doi.org/10.1007/s10342-016-0990-7, 2016.
Lazo, J. K., Morss, R. E., and Demuth, J. L.: 300 Billion served. Sources, Perceptions, Uses, and Values of Weather Forecasts, B. Am. Meteorol. Soc., 90, 785–798, https://doi.org/10.1175/2008BAMS2604.1, 2009.
Leiserowitz, A., Roser-Renouf, C., Marlon, J., and Maibach, E.: Global Warming's Six Americas: a review and recommendations for climate change communication, Curr. Opin. Behav. Sci., 42, 97–103, https://doi.org/10.1016/j.cobeha.2021.04.007, 2021.
Loikith, P. C., Lintner, B. R., and Sweeney, A.: Characterizing Large-Scale Meteorological Patterns and Associated Temperature and Precipitation Extremes over the Northwestern United States Using Self-Organizing Maps, J. Climate, 30, 2829–2847, https://doi.org/10.1175/JCLI-D-16-0670.1, 2017.
Podschuweit, S. and Bernholt, S.: Investigating network coherence to assess students' conceptual understanding of energy, Educ. Sci., 10, 1–20, https://doi.org/10.3390/educsci10040103, 2020.
Post, P., Truija V., and Tuulik, J.: Circulation weather types and their influence on temperature and precipitation in Estonia, Boreal Environ. Res., 7, 281–289, 2002.
Psistaki, K., Paschalidou, A. K., and McGregor, G.: Weather patterns and all-cause mortality in England, UK, Int. J. Biometeorol., 64, 123–136, https://doi.org/10.1007/s00484-019-01803-0, 2020.
Riediger, U. and Gratzki, A.: Future weather types and their influence on mean and extreme climate indices for precipitation and temperature in Central Europe, Meteorol. Z., 23, 231–252, https://doi.org/10.1127/0941-2948/2014/0519, 2014.
Smith, D. M. and Allen, S. J.: Measurement of sap flow in plant stems, J. Exp. Bot., 47, 1833–1844. https://doi.org/10.1093/jxb/47.12.1833, 1996.
Steppe, K., De Pauw, D. J. W., Lemeur, R., and Vanrolleghem, P. A.: A mathematical model linking tree sap flow dynamics to daily stem diameter fluctuations and radial stem growth, Tree Physiol., 26, 257–273, 2006.
Steppe, K., De Pauw, D. J. W., Doody, T. M., and Teskey, R. O.: A comparison of sap flux density using thermal dissipation, heat pulse velocity and heat field deformation methods, Agr. Forest Meteorol., 150, 1046–1056, https://doi.org/10.1016/j.agrformet.2010.04.004, 2010.
Steppe, K., Sterck, F., and Deslauriers, A.: Diel growth dynamics in tree stems: linking anatomy and ecophysiology, Trends Plant Sci., 20, 335–343, https://doi.org/10.1016/j.tplants.2015.03.015, 2015.
Steppe, K., von der Crone, Jonas, S., and de Pauw, D. J. W.: TreeWatch.net: A Water and Carbon Monitoring and Modeling Network to Assess Instant Tree Hydraulics and Carbon Status, Frontiers Plant Sci., 7, 993, https://doi.org/10.3389/fpls.2016.00993, 2016.
Vandegehuchte, M. W. and Steppe, K.: Sapflow+: a four-needle heat-pulse sap flow sensor enabling nonempirical sap flux density and water content measurements, New Phytol., 196, 306–317, https://doi.org/10.1111/j.1469-8137.2012.04237.x, 2012.
Werner, P. C. and Gerstengarbe, F. W.: PIK Report, Katalog der Großwetterlagen Europas (1881–2009), Potsdam-Institut FÜR Klimafolgenforschung, https://www.pik-potsdam.de/en/output/publications/pikreports/.files/pr119.pdf (last access: 11 September 2024), 2010.
Witherby, A. E. and Carpenter, S. K.: The rich-get-richer effect: Prior knowledge predicts new learning of domain-relevant information, J. Exp. Psychol. Learn., 48, 483–498, https://doi.org/10.1037/xlm0000996, 2022.
Zong, L., Yang, Y., Xia, H., Gao, M., Sun, Z., Zheng, Z., Li, X., Ning, G., Li, Y., and Lolli, S.: Joint occurrence of heatwaves and ozone pollution and increased health risks in Beijing, China: role of synoptic weather pattern and urbanization, Atmos. Chem. Phys., 22, 6523–6538, https://doi.org/10.5194/acp-22-6523-2022, 2022.
- Abstract
- Introduction and general motivation
- Specific context and goals
- Physical-science basis
- Communication and educational research
- Conclusions and outlook
- Data availability
- Author contributions
- Competing interests
- Ethical statement
- Disclaimer
- Acknowledgements
- Financial support
- Review statement
- References