Articles | Volume 7, issue 3
https://doi.org/10.5194/gc-7-161-2024
Special issue:
https://doi.org/10.5194/gc-7-161-2024
GC Insights
 | Highlight paper
 | 
06 Aug 2024
GC Insights | Highlight paper |  | 06 Aug 2024

GC Insights: Communicating long-term changes in local climate risk using a physically plausible causal chain

Ed Hawkins, Nigel Arnell, Jamie Hannaford, and Rowan Sutton
Abstract

Directly linking greenhouse gas emissions or global warming to experiences of local climatic changes is a potentially important communication tool. Using observations, we develop a physically plausible “causal chain” visualisation to demonstrate the connections between global carbon dioxide emissions and local climate events. We highlight how increased flood risk in one river basin in the UK could be discussed with people directly affected by recent floods.

It is unequivocal that human activities are warming the climate (IPCC, 2021). This type of global assessment is critical for those needing to make decisions on mitigating against the risks of ongoing climatic changes but is potentially less relevant when communicating to individuals about how climate change may directly affect them.

The effects of climate change will often feel most “real” during an extreme event, such as a flood or heatwave, especially when significant harm is caused. The process of linking an individual extreme weather event to climate change – event attribution – is now a commonly used and effective tool, often communicated to decision-makers, media, and the public in near-real time (e.g. van Oldenborgh et al., 2021). There is some evidence that the attribution of weather events that are experienced personally can generate climate change concern and change decisions, but this effect may be limited, especially if the attribution conflicts with an individual's prior beliefs (Sambrook et al., 2021).

Here we focus on communicating long-term trends in local climate risks. In this case, it might be people's experience that certain types of extreme event are becoming more frequent or that the consequences are getting worse, for example. We develop a new visual approach using a “causal chain” (e.g.  Niemeijer and de Groot, 2008) as a potential communication tool to highlight how global carbon dioxide emissions, which may feel rather abstract to any individual, affect climate risks that matter to people. To ensure relevance and improve understanding, we consider it is essential for the causal chain to be based on observations and well-understood physical principles rather than, for example, the output of complex climate models. Although we are using the general term “risk” for communication purposes, we mainly focus on the hazard component; changes in exposure and vulnerability are also relevant but are not emphasised here.

Widespread, recent flood impacts have led to increasing concerns over changing UK flood regimes in a warming world (e.g. Hannaford et al., 2021, and references therein). We therefore consider flood risk in one UK river basin as the end-point of the causal chain, but this visual approach could be developed more generally for other types of climate risk and in other countries. The UK is fortunate to have lengthy observation-based datasets of several relevant climate variables available for open use (Hollis et al., 2019).

Figure 1 shows simple, observation-based time series of climate-related changes using the full extent of the available records. Cumulative anthropogenic global carbon dioxide emissions since 1750 have exceeded 2500 Gt CO2 (grey), around 70 % of which are due to burning fossil fuels (Friedlingstein et al., 2023). These emissions, along with those of other greenhouse gases and anthropogenic factors, have caused global temperatures to increase by around 1.2 °C since the era before widespread industrialisation (orange; Morice et al., 2021). The best estimate is that human activities have caused all the observed warming and that global warming will stop when we reach net-zero anthropogenic carbon dioxide emissions, i.e. when cumulative emissions stop increasing (IPCC, 2021).

Global warming is experienced in the UK as a slightly larger change in mean temperature (1.4 °C since 1884; red); land areas warm faster than ocean areas (Byrne and O'Gorman, 2018). There is a corresponding increase in near-surface specific humidity (+7.7 % since 1960; green) as a warmer atmosphere can hold more moisture due to the Clausius–Clapeyron relationship. In turn, this increase in atmospheric water content leads to more intense rainfall (+14 % since 1891; blue) – when it rains, it rains more (e.g. King et al., 2023). This observed increase in UK rainfall intensity occurs in all seasons but is larger in winter than in summer (not shown).

The dashed black lines show the regression of a smoothed version of the global temperature series onto the other observed time series. Note particularly that the signature of the ups and downs of global temperature is also visible in the local, noisier time series over the UK. For example, there is a slight cooling of UK temperatures, and small reductions in rainfall intensity, during the 1950s–1960s when global temperatures also slightly cool. This suggests that variations in global temperature are being directly experienced in the UK; it is notable that the rainfall intensity data are entirely independent from the global temperature data.

Although rainfall intensity could be the end-point in this causal chain, we take a further step to relate the causes of global warming to local impacts and risks by considering the effects on a single river basin. In this example, the annual maximum peak flow for the Ribble River has increased by 44 % over the past 50 years (black; NRFA, 2023). If you live near the Ribble, this is of direct relevance to your own personal flood risk; this river basin experienced severe floods affecting hundreds of homes in the 1980–1981, 2015–2016, and 2019–2020 “water years” (October to September) when the peak flows were largest.

https://gc.copernicus.org/articles/7/161/2024/gc-7-161-2024-f01

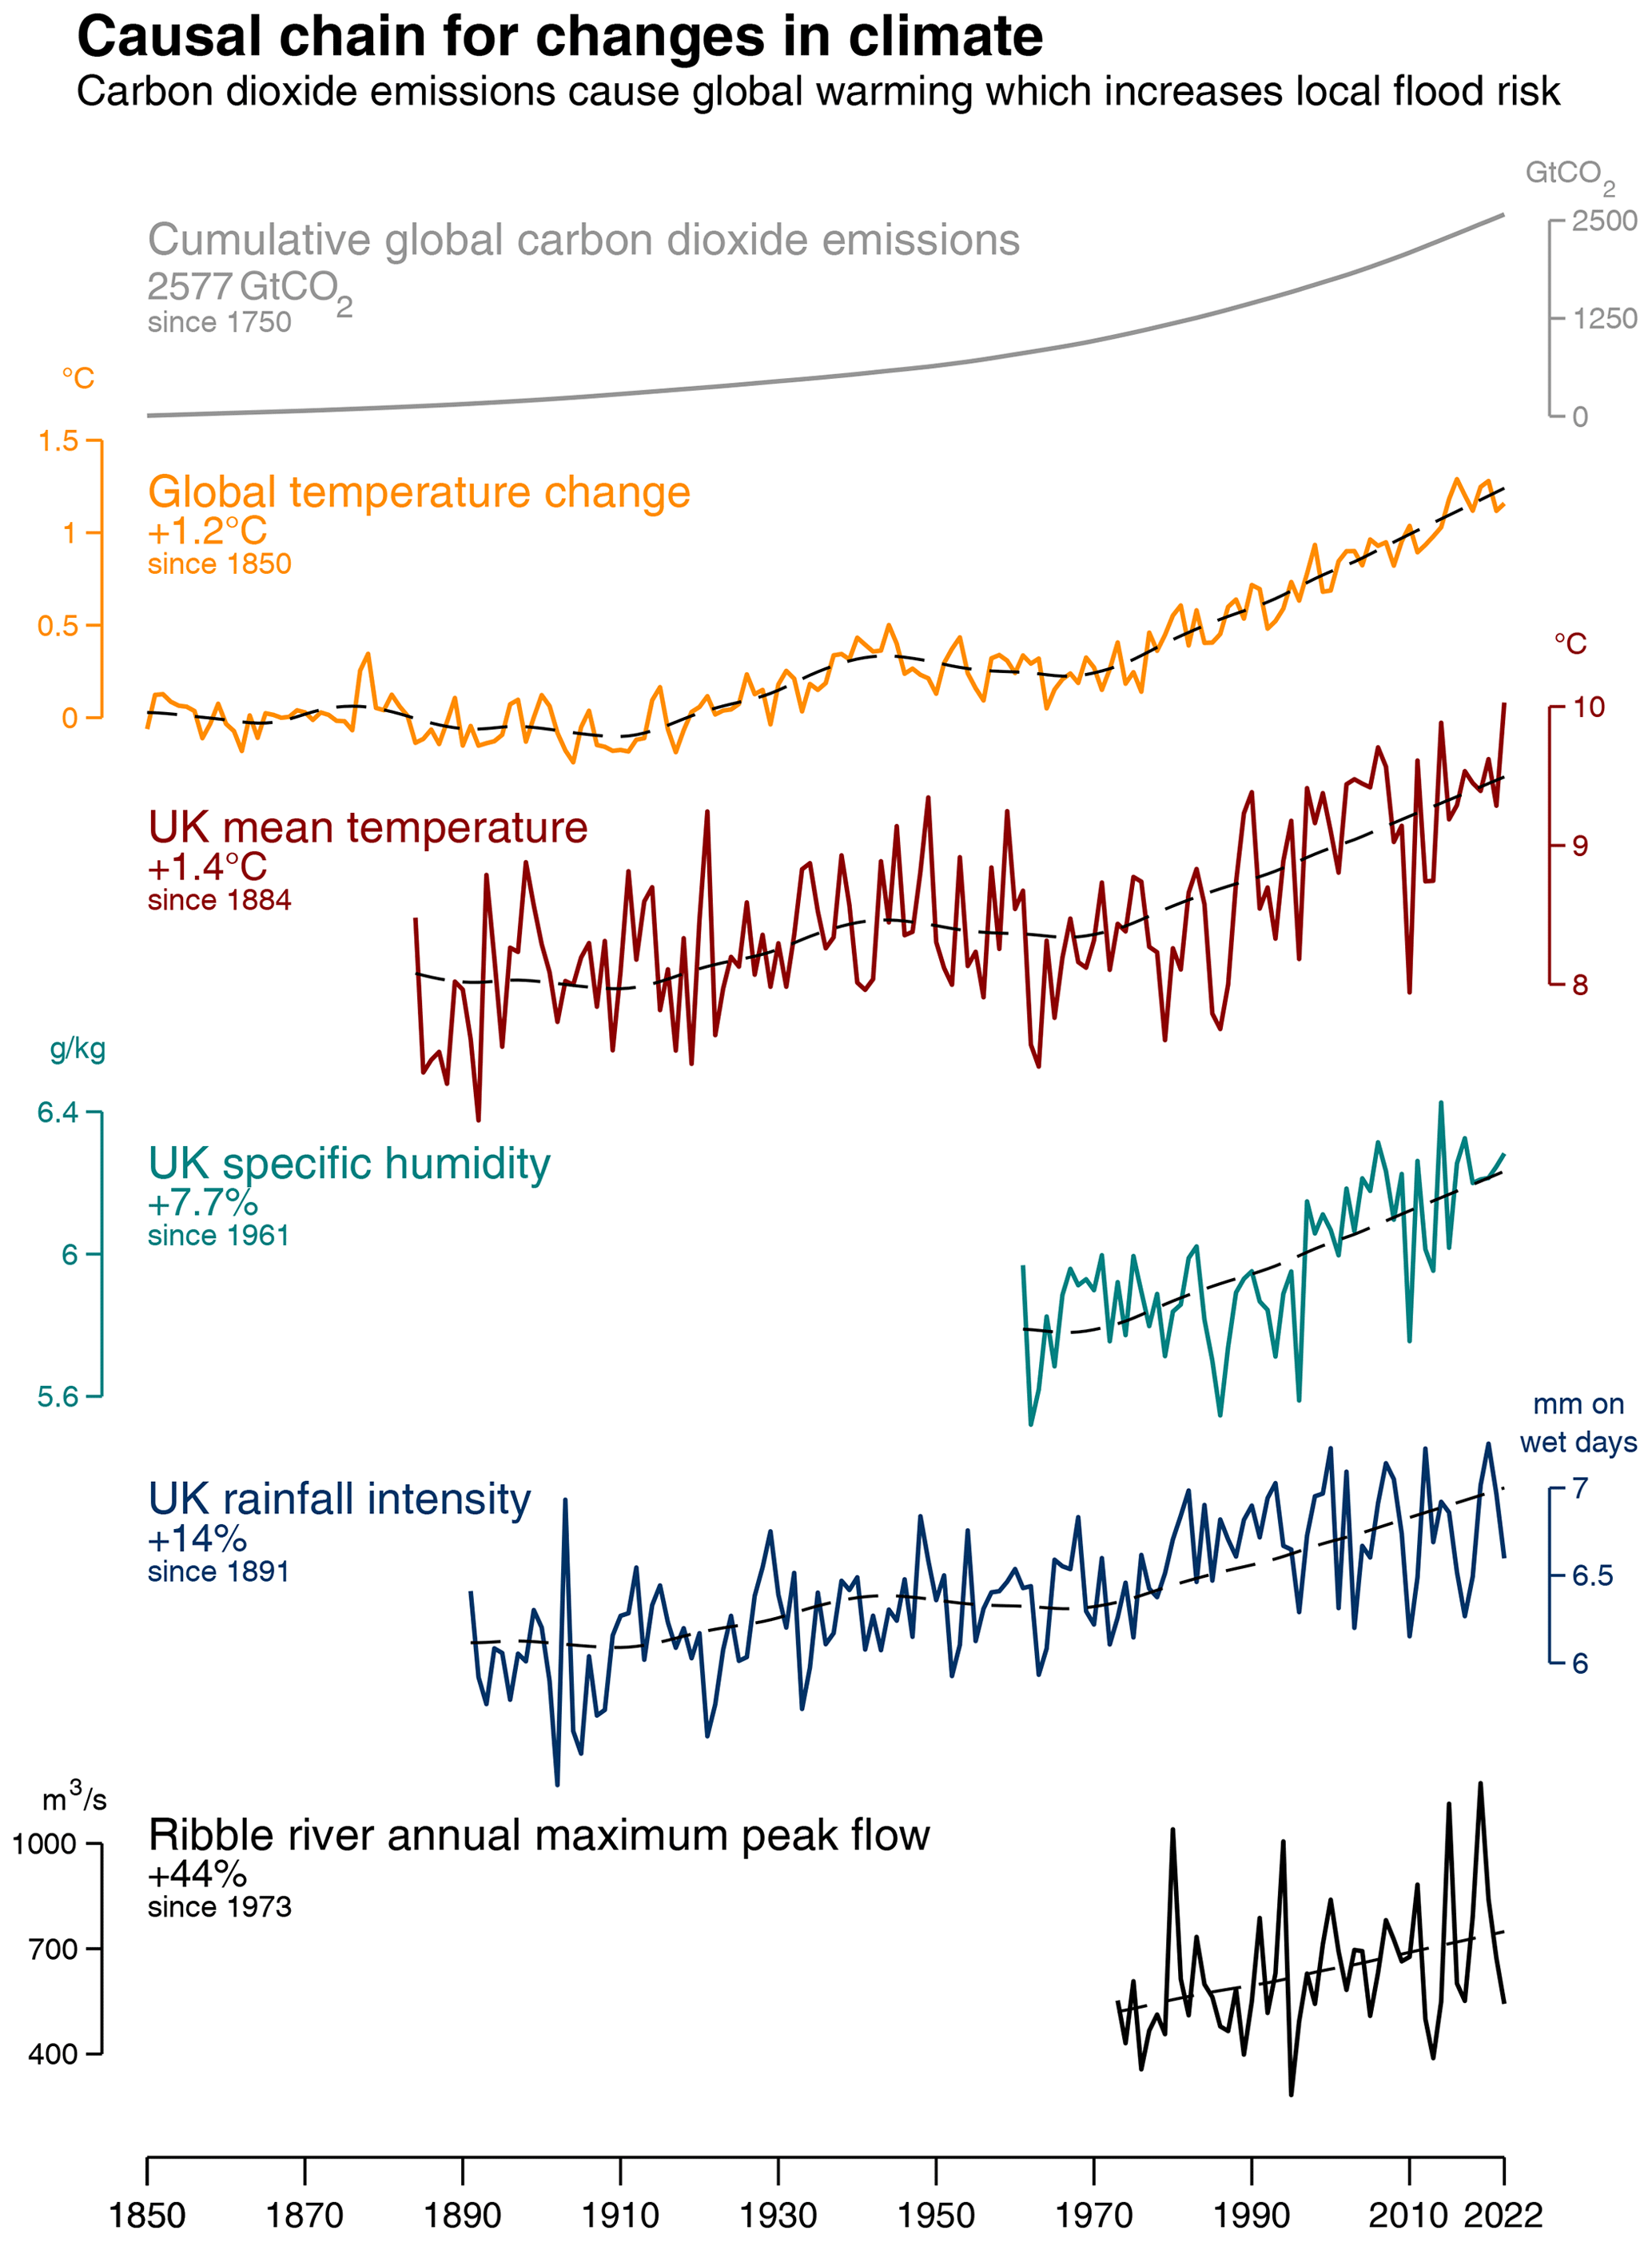
Figure 1An observation-based causal chain from global carbon dioxide emissions to peak flow in the Ribble River. Cumulative anthropogenic global carbon dioxide emissions (grey; Friedlingstein et al., 2023) are causing global temperatures to increase (orange; the 41-year loess smoothed version in dashed black; Morice et al., 2021). Global warming is experienced locally as warmer UK temperatures (red) and increased specific humidity (green) with corresponding increases in rainfall intensity (blue) (all based on data from Hollis et al., 2019). Annual maximum peak flow on the Ribble River has increased in the last 50 years (black; NRFA, 2023). Dashed black lines show regressions onto the smoothed global temperature time series.

Download

One potential implication of this causal chain is that global emissions of carbon dioxide directly increase the risk of flooding from the Ribble River, but there is no formal attribution for that conclusion. However, we note that the links in this causal chain are well studied. The increase in global temperature due to cumulative carbon dioxide emissions has been quantified (IPCC, 2021), and the UK temperature rise has been attributed to anthropogenic factors and global warming (Karoly and Stott, 2006; Hawkins et al., 2020). Increases in specific humidity have been attributed to human influences globally (Willett et al., 2007), and the physical reasons why warming will cause increases in humidity and rainfall intensity are well established (Pfahl et al., 2017), including the Clausius–Clapeyron relationship. A human influence on the risk of specific UK flood events has also been demonstrated (Pall et al., 2011; Schaller et al., 2016; Otto et al., 2018; Kew et al., 2024).

But what about the final link in the chain? There is a robust increase in peak river flows in many UK regions (Hannaford et al., 2021; Slater et al., 2021), and, all else being equal, more intense rainfall will lead to more runoff, higher peak flows, and increased flood risk. However, for any particular river basin, this final link in the chain is highly complex due to the role of catchments in modulating changes in rainfall variability; all else is rarely equal (Hannaford, 2015). The complexities can include the role of antecedent conditions and evaporation, and catchment storage in groundwater or soils that could dampen extreme rainfall increases. Similarly, direct anthropogenic modifications, such as reservoirs, river engineering, or floodplain development can directly influence the flood hazard but may additionally influence exposure and vulnerability. As such, there is often a highly non-linear relationship between trends in extreme rainfall and river flooding, and trends in the former do not always lead to similar responses in the latter (Do et al., 2020).

In our chosen example, the Ribble River is a “benchmark” catchment (Harrigan et al., 2018) as it is largely free of major disturbances and is relatively responsive to rainfall variability given the wetness of the setting, upland terrain, and impermeable geology. Hence, the above complexities are likely to be minimised, and there is reasonable confidence in the link between extreme rainfall and flow responses, although there is a possible role for other local factors such as land use change.

These relatively simple connections between global carbon dioxide emissions, increases in global average temperature, and severe impacts on people could be a useful communication tool to develop further. We suggest that talking through the links in this causal chain may be useful for local decision-makers and the millions of people living with increased flood risk in the UK, such as those in the Ribble valley, to understand how climate change may directly affect them and inform decisions on adaptation. The efficacy of the graphical tool created will be tested in future.

Long observation-based records are extremely useful for communicating that the climate has changed and how this is already affecting people. The extension of this approach to other climate-related hazards such as heatwaves, droughts, storm surges, or wildfires may also be useful, along with expanding to other locations or countries, dependent on data availability. Further work could also develop more complex causal networks or storylines for some of the links in the chain (Niemeijer and de Groot, 2008; Shepherd et al., 2018). However, as with river flows, it will undoubtedly be the last link, towards the impact, that will bring the most complexity.

Data availability

The data in the time series shown are openly available (https://doi.org/10.5281/zenodo.12634210, Hawkins, 2024). The carbon dioxide emissions data are from the Global Carbon Project (Friedlingstein et al., 2023) and are the cumulative sum of the fossil fuel and land-use-related anthropogenic emissions since 1750. The global temperature time series is from HadCRUT5 (Morice et al., 2021) for 1850–2022, and the smoothed version uses a 41-year loess filter. HadUK-Grid (Hollis et al., 2019) provides the UK mean temperature series (1884–2022) and the vapour pressure and sea level pressure series used to derive specific humidity (1961–2022). The rainfall intensity index (1891–2022) is the spatial average of the average rainfall on wet days (>1 mm; often termed SDII), with the underlying gridded daily rainfall data from HadUK-Grid. The Ribble flow data (1973–2022) is measured at Samlesbury (NRFA, 2023) and is shown for water years (defined as October to September and plotted for the year that the October is in).

Author contributions

The paper was conceived by EH with further development by all authors. EH led the paper preparation with editing contributions from all authors. EH prepared the paper figure.

Competing interests

At least one of the (co-)authors is a member of the editorial board of Geoscience Communication. The peer-review process was guided by an independent editor, and the authors also have no other competing interests to declare.

Ethical statement

This article did not contain any studies involving human or animal subjects and did not need to undergo ethical review.

Disclaimer

Publisher's note: Copernicus Publications remains neutral with regard to jurisdictional claims made in the text, published maps, institutional affiliations, or any other geographical representation in this paper. While Copernicus Publications makes every effort to include appropriate place names, the final responsibility lies with the authors.

Acknowledgements

Ed Hawkins and Rowan Sutton have been supported by the UK National Centre for Atmospheric Science.

Financial support

This publication has emanated from research conducted with financial support from a Co-Centre award (grant no. 22/CC/11103). The Co-Centre award is managed by Science Foundation Ireland (SFI), Northern Ireland's Department of Agriculture, Environment, and Rural Affairs (DAERA) and UK Research and Innovation (UKRI) and is supported via the UK's International Science Partnerships Fund (ISPF) and the Irish Government's Shared Island initiative.

Review statement

This paper was edited by Louise Arnal and reviewed by two anonymous referees.

References

Byrne, M. and O'Gorman, P.: Trends in continental temperature and humidity directly linked to ocean warming, P. Natl. Acad. Sci. USA, 115, 4863–4868, https://doi.org/10.1073/pnas.1722312115, 2018. 

Do, H. X., Mei, Y., and Gronewold, A. D.: To what extent are changes in flood magnitude related to changes in precipitation extremes?, Geophys. Res. Lett., 47, e2020GL088684, https://doi.org/10.1029/2020GL088684, 2020. 

Friedlingstein, P., O'Sullivan, M., Jones, M. W., Andrew, R. M., Bakker, D. C. E., Hauck, J., Landschützer, P., Le Quéré, C., Luijkx, I. T., Peters, G. P., Peters, W., Pongratz, J., Schwingshackl, C., Sitch, S., Canadell, J. G., Ciais, P., Jackson, R. B., Alin, S. R., Anthoni, P., Barbero, L., Bates, N. R., Becker, M., Bellouin, N., Decharme, B., Bopp, L., Brasika, I. B. M., Cadule, P., Chamberlain, M. A., Chandra, N., Chau, T.-T.-T., Chevallier, F., Chini, L. P., Cronin, M., Dou, X., Enyo, K., Evans, W., Falk, S., Feely, R. A., Feng, L., Ford, D. J., Gasser, T., Ghattas, J., Gkritzalis, T., Grassi, G., Gregor, L., Gruber, N., Gürses, Ö., Harris, I., Hefner, M., Heinke, J., Houghton, R. A., Hurtt, G. C., Iida, Y., Ilyina, T., Jacobson, A. R., Jain, A., Jarníková, T., Jersild, A., Jiang, F., Jin, Z., Joos, F., Kato, E., Keeling, R. F., Kennedy, D., Klein Goldewijk, K., Knauer, J., Korsbakken, J. I., Körtzinger, A., Lan, X., Lefèvre, N., Li, H., Liu, J., Liu, Z., Ma, L., Marland, G., Mayot, N., McGuire, P. C., McKinley, G. A., Meyer, G., Morgan, E. J., Munro, D. R., Nakaoka, S.-I., Niwa, Y., O'Brien, K. M., Olsen, A., Omar, A. M., Ono, T., Paulsen, M., Pierrot, D., Pocock, K., Poulter, B., Powis, C. M., Rehder, G., Resplandy, L., Robertson, E., Rödenbeck, C., Rosan, T. M., Schwinger, J., Séférian, R., Smallman, T. L., Smith, S. M., Sospedra-Alfonso, R., Sun, Q., Sutton, A. J., Sweeney, C., Takao, S., Tans, P. P., Tian, H., Tilbrook, B., Tsujino, H., Tubiello, F., van der Werf, G. R., van Ooijen, E., Wanninkhof, R., Watanabe, M., Wimart-Rousseau, C., Yang, D., Yang, X., Yuan, W., Yue, X., Zaehle, S., Zeng, J., and Zheng, B.: Global Carbon Budget 2023, Earth Syst. Sci. Data, 15, 5301–5369, https://doi.org/10.5194/essd-15-5301-2023, 2023. 

Hannaford, J.: Climate-driven changes in UK river flows: A review of the evidence, Prog. Phys. Geogr.-Earth and Environment, 39, 29–48, https://doi.org/10.1177/0309133314536755, 2015. 

Hannaford, J., Mastrantonas, N., Vesuviano, G., and Turner, S.: An updated national-scale assessment of trends in UK peak river flow data: how robust are observed increases in flooding?, Hydrol. Res., 52, 699–718, https://doi.org/10.2166/nh.2021.156, 2021. 

Harrigan, S., Hannaford, J., Muchan, K., and Marsh, T. J.: Designation and trend analysis of the updated UK Benchmark Network of river flow stations: the UKBN2 dataset, Hydrol. Res., 49, 552–567, https://doi.org/10.2166/nh.2017.058, 2018. 

Hawkins, E.: Data for Hawkins papers v1.0 (v1.0), Zenodo [data set], https://doi.org/10.5281/zenodo.12634211, 2024. 

Hawkins, E., Frame, D., Harrington, L., Joshi, M., King, A., Rojas, M., and Sutton, R.: Observed emergence of the climate change signal: From the familiar to the unknown, Geophys. Res. Lett., 47, e2019GL086259, https://doi.org/10.1029/2019GL086259, 2020. 

Hollis, D., McCarthy, M. P., Kendon, M., Legg, T., and Simpson, I.: HadUK-Grid – A new UK dataset of gridded climate observations, Geosci. Data J., 6, 151, https://doi.org/10.1002/gdj3.78, 2019. 

IPCC: Summary for Policymakers, in: Climate Change 2021: The Physical Science Basis. Contribution of Working Group I to the Sixth Assessment Report of the Intergovernmental Panel on Climate Change, edited by: Masson-Delmotte, V., Zhai, P., Pirani, A., Connors, S. L., Péan, C., Berger, S., Caud, N., Chen, Y., Goldfarb, L., Gomis, M. I., Huang, M., Leitzell, K., Lonnoy, E., Matthews, J. B. R., Maycock, T. K., Waterfield, T., Yelekçi, O., Yu, R., and Zhou, B., Cambridge University Press, Cambridge, United Kingdom and New York, NY, USA, 3–32, https://doi.org/10.1017/9781009157896.001, 2021. 

Karoly, D. J. and Stott, P. A.: Anthropogenic warming of central England temperature, Atmos. Sci. Lett., 7, 81–85, https://doi.org/10.1002/asl.136, 2006. 

Kew, S. F., McCarthy, M., Ryan, C., Pirret, J. S. R., Murtagh, E., Vahlberg, M., Amankona, A., Pope, J. O., Lott, F., Claydon, O., Coonan, B., Pinto, I., Barnes, C., Philip, S., Otto, F., Wallace, E., Bryant, L., Tranter, E., Singh, R., and Mijic, A.: Autumn and Winter storms over UK and Ireland are becoming wetter due to climate change, Report, Grantham Institute for Climate Change, https://doi.org/10.25561/111577, 2024. 

King, A. D., Reid, K. J., and Saunders, K. R.: Communicating the link between climate change and extreme rain events, Nat. Geosci., 16, 552–554, https://doi.org/10.1038/s41561-023-01223-1, 2023. 

Morice, C. P., Kennedy, J. J., Rayner, N. A., Winn, J. P., Hogan, E., Killick, R. E., Dunn, R. J. H., Osborn, T. J., Jones, P. D., and Simpson, I. R.: An updated assessment of near-surface temperature change from 1850: the HadCRUT5 dataset, J. Geophys. Res.-Atmos., e2019JD032361, https://doi.org/10.1029/2019JD032361, 2021. 

Niemeijer, D. and de Groot, R. S.: Framing environmental indicators: moving from causal chains to causal networks, Environ. Dev. Sustain., 10, 89–106, https://doi.org/10.1007/s10668-006-9040-9, 2008. 

NRFA: National River Flow Archive peak flow data for Samlesbury, https://nrfa.ceh.ac.uk/data/station/peakflow/71001 (last access: 7 January 2024), 2023. 

Otto, F., van der Wiel, K., van Oldenborgh, G. J., Philip, S., Kew, S. F., Uhe, P., and Cullen, H.: Climate change increases the probability of heavy rains in Northern England/Southern Scotland like those of storm Desmond – a real-time event attribution revisited, Environ. Res. Lett., 13, 024006, https://doi.org/10.1088/1748-9326/aa9663, 2018. 

Pall, P., Aina, T., Stone, D. A., Stott, P. A., Nozawa, T., Hilberts, A. G. J., Lohmann, D., and Allen, M. R.: Anthropogenic greenhouse gas contribution to flood risk in England and Wales in autumn 2000, Nature, 470, 382–385, https://doi.org/10.1038/nature09762, 2011. 

Pfahl, S., O'Gorman, P., and Fischer, E.: Understanding the regional pattern of projected future changes in extreme precipitation, Nat. Clim. Change, 7, 423–427, https://doi.org/10.1038/nclimate3287, 2017. 

Sambrook, K., Konstantinidis, E., Russell, S., and Okan, Y.: The Role of Personal Experience and Prior Beliefs in Shaping Climate Change Perceptions: A Narrative Review, Front. Psychol., 12, 669911, https://doi.org/10.3389/fpsyg.2021.669911, 2021. 

Schaller, N., Kay, A. L., Lamb, R., Massey, N. R., van Oldenborgh, G. J., Otto, F. E. L., Sparrow, S. N., Vautard, R., Yiou, P., Ashpole, I., Bowery, A., Crooks, S. M., Haustein, K., Huntingford, C., Ingram, W. J., Jones, R. G., Legg, T., Miller, J., Skeggs, J., Wallom, D., Weisheimer, A., Wilson, S., Stott, P. A., and Allen, M. R.: Human influence on climate in the 2014 southern England winter floods and their impacts, Nat. Clim. Change, 6, 627–634, https://doi.org/10.1038/nclimate2927, 2016. 

Shepherd, T. G., Boyd, E., Calel, R. A., Chapman, S. C., Dessai, S., Dima-West, I. M., Fowler, H. J., James, R., Maraun, D., Martius, O., Senior, C. A., Sobel, A. H., Stainforth, D. A., Tett, S. F. B., Trenberth, K. E., van den Hurk, B. J. J. M., Watkins, N. W., Wilby, R. L., and Zenghelis, D. A.: Storylines: an alternative approach to representing uncertainty in physical aspects of climate change, Clim. Change, 151, 555–571, https://doi.org/10.1007/S10584-018-2317-9, 2018. 

Slater, L. J., Anderson, B., Buechel, M., Dadson, S., Han, S., Harrigan, S., Kelder, T., Kowal, K., Lees, T., Matthews, T., Murphy, C., and Wilby, R. L.: Nonstationary weather and water extremes: a review of methods for their detection, attribution, and management, Hydrol. Earth Syst. Sci., 25, 3897–3935, https://doi.org/10.5194/hess-25-3897-2021, 2021.  

van Oldenborgh, G. J., van der Wiel, K., Kew, S., Philip, S., Otto, F., Vautard, R., King, A., Lott, F., Arrighi, J., Singh, R., and van Aalst, M.: Pathways and pitfalls in extreme event attribution, Clim. Change, 166, 1–27, https://doi.org/10.1007/S10584-021-03071-7, 2021. 

Willett, K., Gillett, N., Jones, P. D., and Thorne, P. W.: Attribution of observed surface humidity changes to human influence, Nature, 449, 710–712, https://doi.org/10.1038/nature06207, 2007. 

Download
Executive editor
This paper creates a visual physically plausible causal chain to communicate long-term changes in local climate risk, using flooding in a UK river basin as an example. This chain places local hazards, such as flooding, within the broader context of global climate change, including factors like global carbon dioxide emissions and temperature changes. It relies exclusively on observations, thereby avoiding the additional uncertainties associated with climate scenarios that might hinder understanding in certain situations. This causal chain idea has the potential to be a powerful communication tool for clearly communicating risks and the contributing factors, engaging with local communities, and addressing common misconceptions like the “Myth of Dry Feet” - a Dutch expression implying that extreme events such as floods only happen elsewhere, and won't happen "here" or "to me". While this chain is created for flood risk in the UK, it has the potential for broader application in various geoscience fields.
Short summary
Climate change can often seem rather remote, especially when the discussion is about global averages which appear to have little relevance to local experiences. But those global changes are already affecting people, even if they do not fully realise it, and effective communication of this issue is critical. We use long observations and well-understood physical principles to visually highlight how global emissions influence local flood risk in one river basin in the UK.
Special issue
Altmetrics
Final-revised paper
Preprint