the Creative Commons Attribution 4.0 License.
the Creative Commons Attribution 4.0 License.
 | 28 Jan 2022
From a virtual field trip to geologically reasoned decisions in Yosemite Valley
Greg M. Stock
Kinnari Atit
This study highlights a geology of Yosemite Valley virtual field trip (VFT) and the companion exercises produced as a four-part educational activity to substitute physical field experiences. The VFT is created as an Earth project in Google Earth Web, a versatile format that allows access through a web browser or Google Earth application with the sharing of an internet address. Many dynamic resources can be used for VFT stops through use of the Google Earth Engine (global satellite imagery draped on topography, 360∘ street-level imagery, and user-submitted 360∘ photospheres). Images, figures, videos, and narration can be embedded into VFT stops. Hyperlinks allow for a wide range of external resources to be incorporated; optional background resources help reduce the knowledge gap between the general public and advanced undergraduate students, ensuring that VFTs can be broadly accessible. Like many in-person field trips, there is a script with learning goals for each stop, but also an opportunity to learn through exploration, as the viewer can dynamically change their vantage at each stop (i.e., guided-discovery learning). This interactive VFT format supports students' spatial skills and encourages attention to be focused on a stop's critical spatial information. The progression from VFT and mapping exercises to geologically reasoned decision-making results in high-quality student work; students find it engaging, enjoyable, and educational.
- Article
(27615 KB) - Full-text XML
- BibTeX
- EndNote


The shifting landscape of the global COVID-19 pandemic in early 2020 brought unprecedented uncertainty and disruption to educators worldwide, particularly field educators (e.g., Arthurs, 2021; Phillips et al., 2021; Walker, 2021). To promote safety and minimize virus spread, many national agencies, local governments, and universities changed the rules and guidelines on a near-weekly basis, often implementing drastic procedural changes with little notice. Against this backdrop 100-plus intensive capstone field geology educational experiences (i.e., summer field courses in the United States) hosted by universities around the world that were scheduled to run over the summer were forced to make a hard choice: do they proceed? Some instructors held out hope of running their course (i.e., a module in the European use), only to have their camping permits denied at the last minute or have shifting regulations cancel their field course altogether. Although a very small minority did actually run in-person courses with clearances and modifications to safely limit COVID-19 exposure (e.g., Rotzien et al., 2021), most instructors shifted to offering alternative courses in a remote or virtual format that would attempt to instill some of the field skills considered essential by employers and graduate advisors.
Field geology educators across the globe began organizing and meeting virtually in March 2020 as a forum on designing remote field experiences and to assess resources readily available for use in remote field geology courses, what could be adapted from instructors' courses, and what could be newly created with enough lead time to be implemented by others. Several working groups coordinated by affiliates of the National Association of Geoscience Teachers (NAGT) sprung up with sub-interests (learning objectives, building a community-based virtual field camp, virtual field trips, virtual worlds, virtual field geophysics, etc.). A clear challenge that repeatedly arose was how to virtually deliver the same depth of learning that in-person field experiences provide.
For the preceding 3 years, the summer field geology course at the University of California, Riverside (UCR), hosted in Owens Valley, California, had a short 1 d exercise in which students were expected to use web-hosted lidar data to map geomorphic features such as debris fans, rockfalls, and glacial moraines in Yosemite Valley. This exercise was followed by a long day of driving over the Sierra Nevada to Yosemite Valley, where students would participate in a multi-stop walk highlighting natural hazards, including floods, rockfalls, and rock avalanches. In post-course surveys students cited the Yosemite activity and visit as one of their favorite aspects of the course, and the students' assessment results (scores) indicate the mapping products produced were some of the highest quality in the course. Out of this background familiarity and the possibility to create a long-lived teaching resource (i.e., with potential for broad international interest and usable with a site visit once in-person field instruction resumed), we developed a four-part geology of Yosemite Valley educational activity (https://serc.carleton.edu/NAGTWorkshops/online_field/activities/237092.html; last access: 11 October 2021), advertised through the main NAGT working group, and made this activity publicly available in May 2020 through the Science Education Resources Center (SERC) website hosted by Carleton College (Fig. 1). This paper is intended to provide an overview of the learning philosophies and technologies employed, with the hope that it promotes the creation of high-quality virtual field trips (VFTs) appropriate for the general public and highlights how VFTs can lead to advanced-level mapping and geologically reasoned decision-making exercises suitable for third-year or fourth-year undergraduate courses.
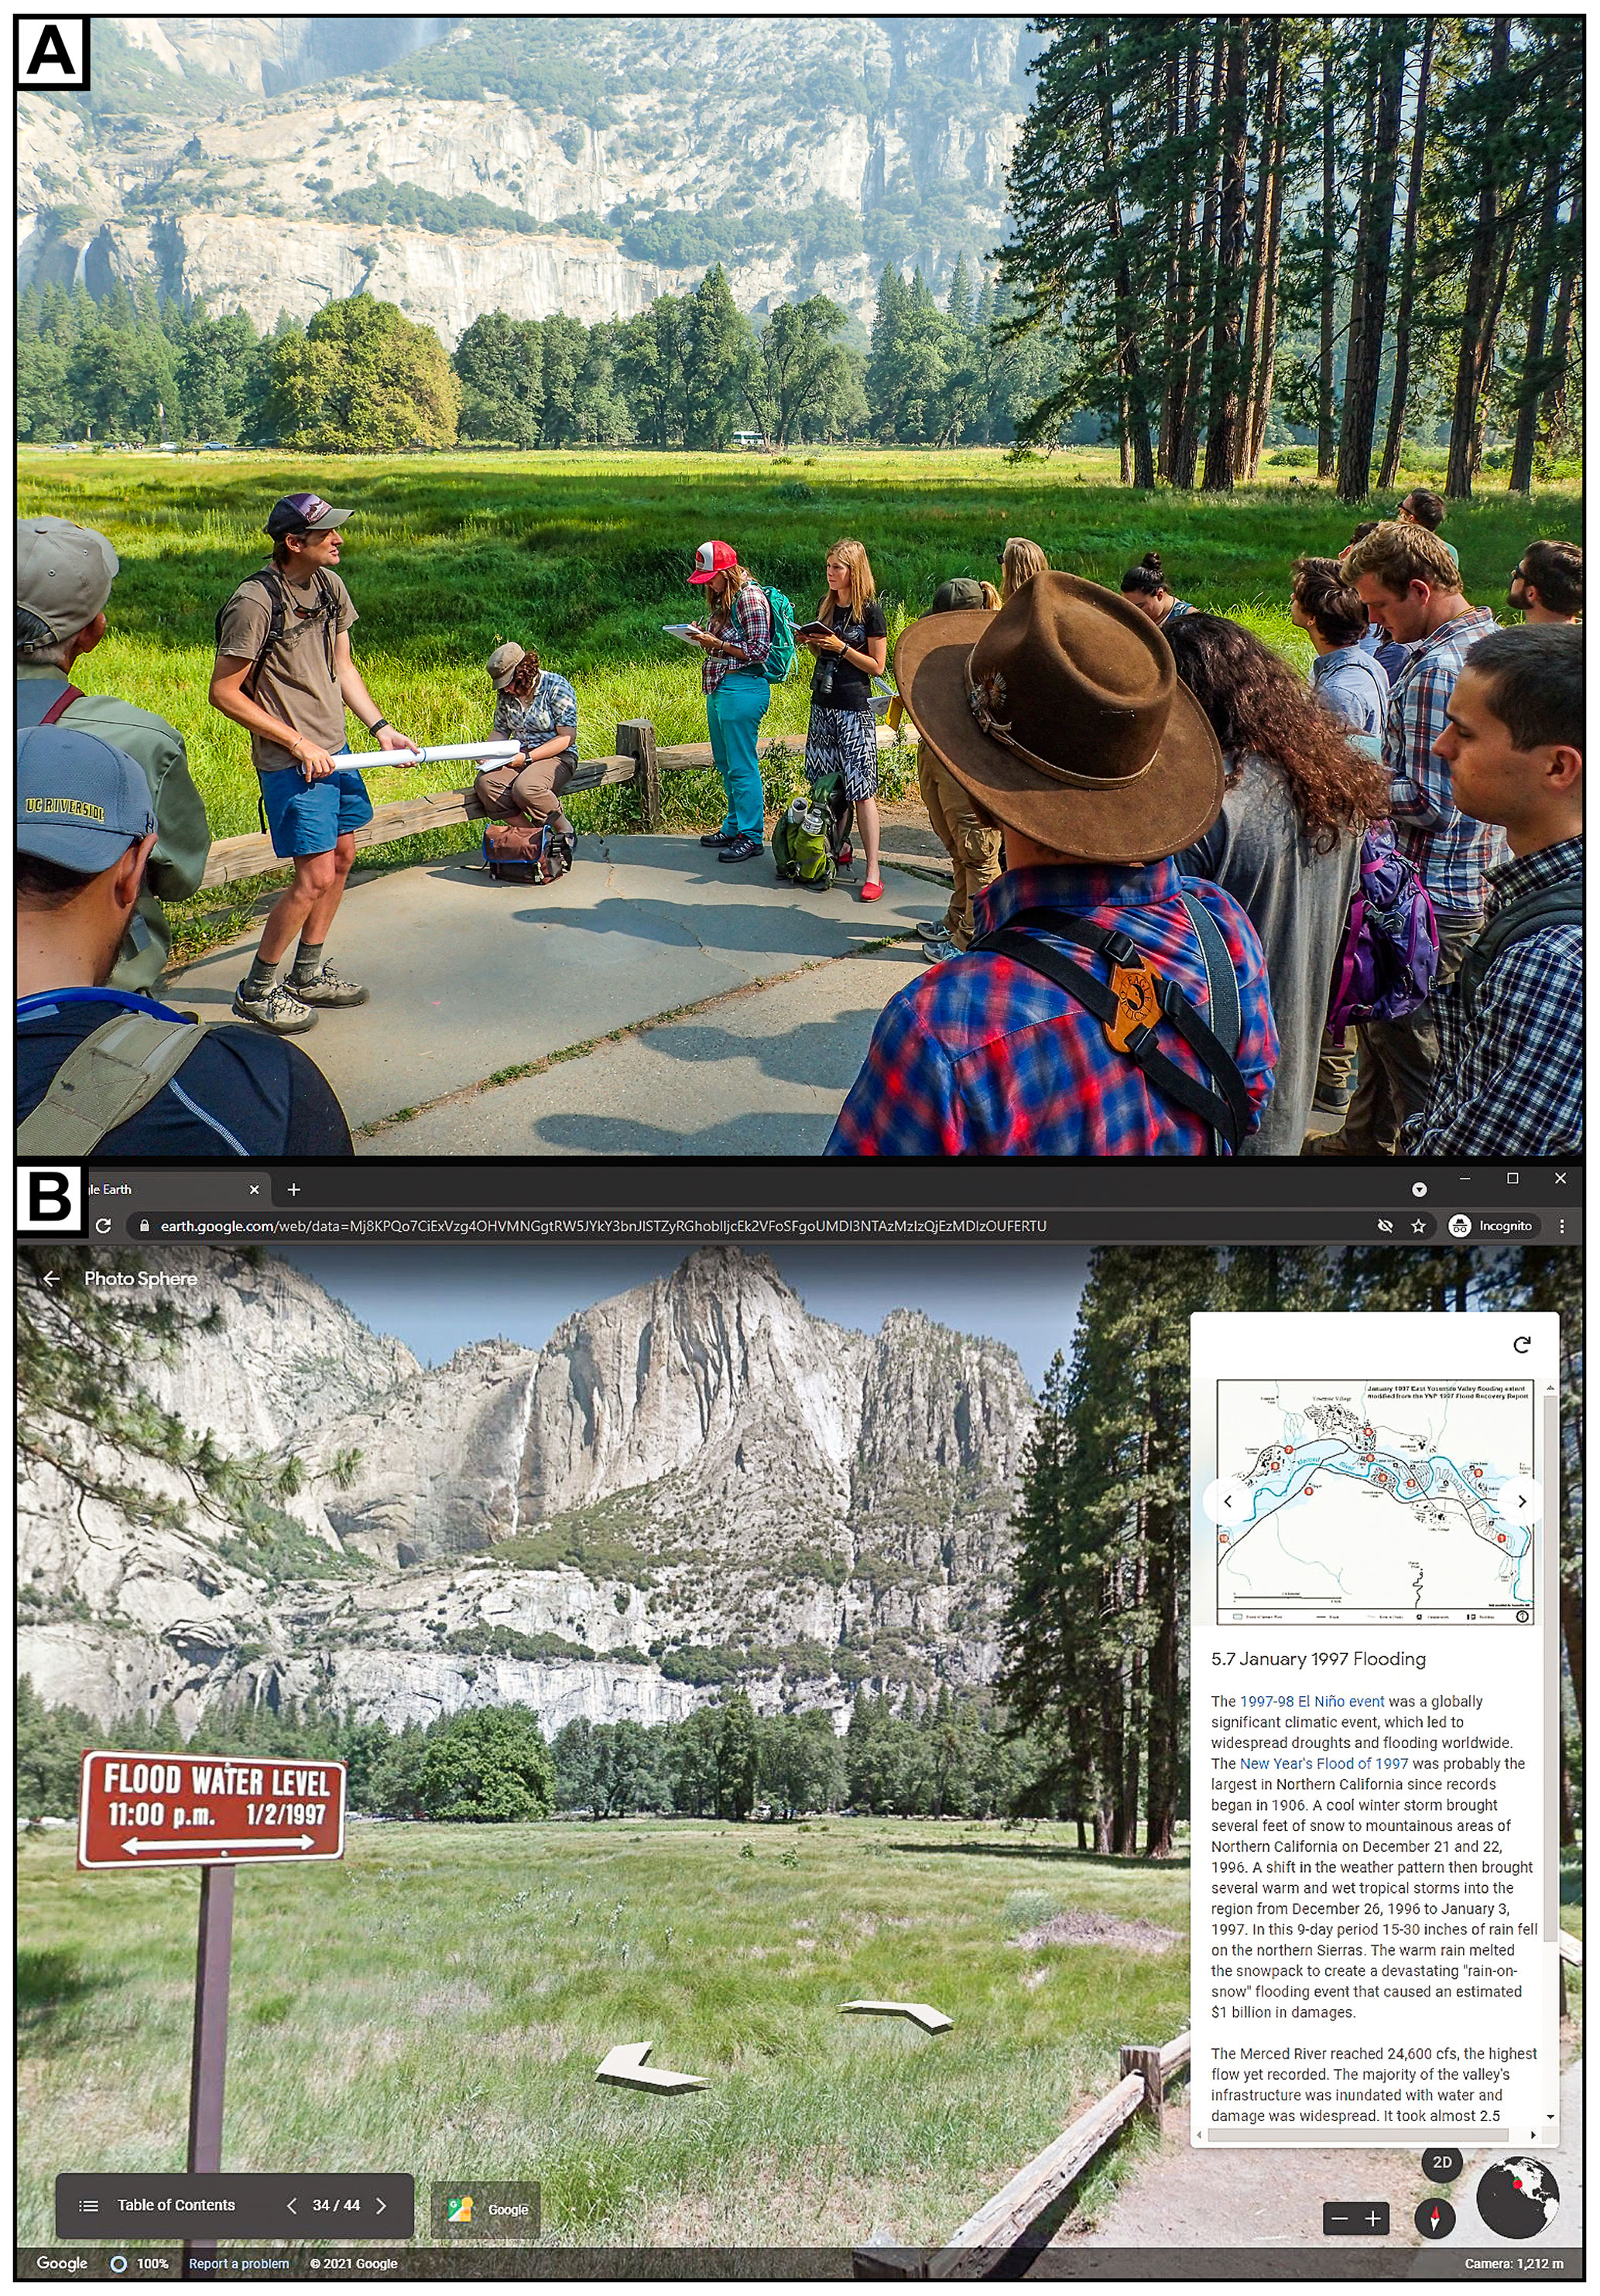
Figure 1From the field to the virtual. (a) Image of students learning about flooding in Yosemite Valley as part of an in-person field trip in 2017. Just to the left of the view is a ∼ 1.5 m tall sign marking the peak flood water level on 2 January 1997 (seen in panel b), which is a striking location to discuss flood hazards as students look over the meadows, trails, and roads that would have been inundated. (b) A corresponding stop in the geology of Yosemite Valley virtual field trip (https://bit.ly/2Zbn3R7, last access: 25 January 2022) that utilizes a precisely chosen © Google Street View orientation and magnification level to provide the same discussion of the 1997 flooding. Students can pan the view to obtain a similar sense of flood inundation around them. Supporting text and hyperlinks are in the sidebar on the right. A historic photo of the flooding event, map of the flooding extent, and a National Park Service (NPS)-produced video on Yosemite rain-on-snow flooding fills the full screen when clicked on. The virtual field trip is an Earth project created with © Google Earth Web and viewed in a © Google Chrome web browser.
Geology of Yosemite Valley is a four-part educational activity that we intentionally designed to be flexible in duration and student knowledge level (Geology of Yosemite Valley, 2022; https://serc.carleton.edu/NAGTWorkshops/online_field/activities/237092.html; last access: 25 January 2022). Full functionality requires a computing device with internet connection, Google Chrome browser, Google Earth Pro desktop, and a trackpad or mouse. The four parts are described in the suggested order of completion, as each part builds on the previous one. Particular detail is given to the virtual field trip (Part I) created through the Projects feature of Google Earth Web, a user-friendly and highly adaptable format with advantages over many other VFT platforms. An overview of Parts II, III, and IV are provided to illustrate how a VFT can be used as background material for more advanced-level mapping and writing exercises.
2.1 Geology of Yosemite Valley virtual field trip
2.1.1 Introduction to Google Earth Web projects
The geology of Yosemite Valley VFT (Geology of Yosemite Valley Virtual Field Trip, 2021; https://bit.ly/2Zbn3R7, last access: 25 January 2022) was created as an Earth project using the Creation Tools available in Google Earth Web accessible via web browser. Google introduced Tour Builder as a beta tool in 2013 as a way to create shareable, place-based narratives with images, text, videos, and links hosted within their Google Earth engine; Tour Builder was discontinued in July 2021, but most of the functionality has been made permanent in Google Earth Web's Creation Tools, which launched in 2019. Creating with Creation Tools requires signing into the web version of Google Earth (preferred browser is Google Chrome) with a Google account (free); all projects are stored in the creator's Google Drive storage system. Much of the functionality will be familiar to users of other Google products (Docs, Sheets, Slides, etc.). A creator can make a project shareable or completely private, collaborate with other creators if they choose, and project changes are immediately saved and updated with an internet connection (i.e., real-time editing; Fig. 2).

Figure 2Creating a VFT Earth project in © Google Earth Web. (a) A view highlighting the interface for editing a project (i.e., VFT). All changes are instantly saved to the cloud (the creator's Google Drive). (b) A view highlighting the interface for editing a feature (i.e., virtual field trip stop). Many customizable options exist.
All created features for a given project appear in a table of contents and can be reordered by the creator but not viewers. A publicly shared project can be downloaded by a third-party user; it can also be copied such that a third-party creator can edit and adapt someone's project as their own (for example, adding their own built-in quiz assessments for their students).
There are three types of features that can currently be added to projects, i.e., full-screen slides, lines or shapes, and place marks.
-
Full-screen slides fill the entire screen and are not geotagged. The creator can upload a background image or video and overlay text with hyperlinks. Because of the lack of geotagging, full-screen slides work best as title slides or interstitial slides that intentionally pull the focus away from the more interactive Google Earth environment (for example, to highlight a figure or concept).
-
Place marks are geotagged points in Google Earth's global environment and are the most versatile feature that can be created. A key advantage of place marks in an Earth project is that not only is the viewer flown to the point on the globe, but the precise view (magnification level, view orientation, and imagery) that the creator selects. The view can be a top-down or oblique 3D vantage of Google Earth's elevation-model-draped satellite imagery or pulled from Google Street View's extensive ground-level photosphere imagery (outward-looking 360∘ magnifiable imagery). User-submitted photosphere imagery can also be incorporated if the use is consistent with their Creative Commons license. VFT creators can use the Google Street View app on a smartphone or tablet to create and submit their own photospheres, which can be readily used as well. The creator can add text, hyperlinks, images, and videos into a sidebar that helps explain the particular view selected for the place mark. There is a more advanced option to directly edit the sidebar's HTML (Hypertext Markup Language) , which allows for custom widths, styles, and the addition of features like audio narration or embedded quizzes.
-
Lines or polygons can be drawn on the standard 3D view of Google Earth with different widths, colors and transparencies, which may be helpful for highlighting a specific feature like a fault or landslide. Similar to the place mark functionality, a sidebar box can have text or images describing the feature, and a custom view can be tagged. Each line appears as an item in the table of contents, so this would be an unwieldy way to annotate many features in a small area (creating and embedding a figure would be more effective). It is not possible to create lines or polygons within a photosphere view.
2.1.2 VFT walk-through
When the viewer (student) clicks on the provided geology of Yosemite Valley web link (https://bit.ly/2Zbn3R7, last access: 25 January 2022) on a computer, the default browser opens an uneditable, view-only version of the project (VFT) in Google Earth Web. On a tablet or smartphone, the Google Earth application is automatically opened if downloaded. The format dynamically adjusts to the size of the window. Clicking or tapping the “Present” button takes you to the first item (i.e., the first virtual field trip stop) in the table of contents and starts what is effectively an interactive slideshow. This VFT moves from the past towards the present, starting with a general overview of Cretaceous geology, bedrock joints, and glaciations and then moves on to active processes like rockfalls and debris fans. The VFT is designed in a format that could be a standalone overview of Yosemite Valley geology but has the second purpose of preparing the student for additional exercises on geomorphic mapping; relatedly, there is a particular emphasis on Quaternary deposits and hazards in the VFT.
At any point, the navigation allows the student to go forward or backward or pull up the Table of Contents to revisit a past stop. To maximize the accessibility to a wide variety of knowledge levels, the text in the VFT is extensively hyperlinked to external web resources like Wikipedia or the U.S. Geological Survey. If a student is familiar with terms such as “subduction zones” or “partial melting”, then they can read on, whereas another student who is not familiar with those terms readily has access to the information needed to understand. A student works through each of the 44 stops, reading the text and connecting the views to the annotated figures and videos provided. In some places, small exercises are suggested, using the built-in measure tool (for measuring area or distance). A student that needs to dive deeper into the hyperlinks and background information will need more time to complete the VFT (∼ 3 h), while a more knowledgeable student may be able to work through it in under 2 h.
Yosemite Valley was a fortunate place to design a VFT, as the heavy visitation and high interest meant that many existing resources could be adapted rather than being newly created. Google Earth's 3D buildings layer (photo-textured 3D models derived from low-flying aerial photogrammetry) in Yosemite Valley is of exceptional quality (it is, for example, able to resolve individual trees or boulders) and on par with current coverage in major cities and other popular outdoor recreation areas. The National Park Service has a wide variety of professionally produced informative YouTube videos on Yosemite, including many on geology topics, that we incorporated with attribution. Similarly, most of the valley's main trails and viewpoints have Google Street View coverage. We created many new figures to best pair with specific vantages (Fig. 3).
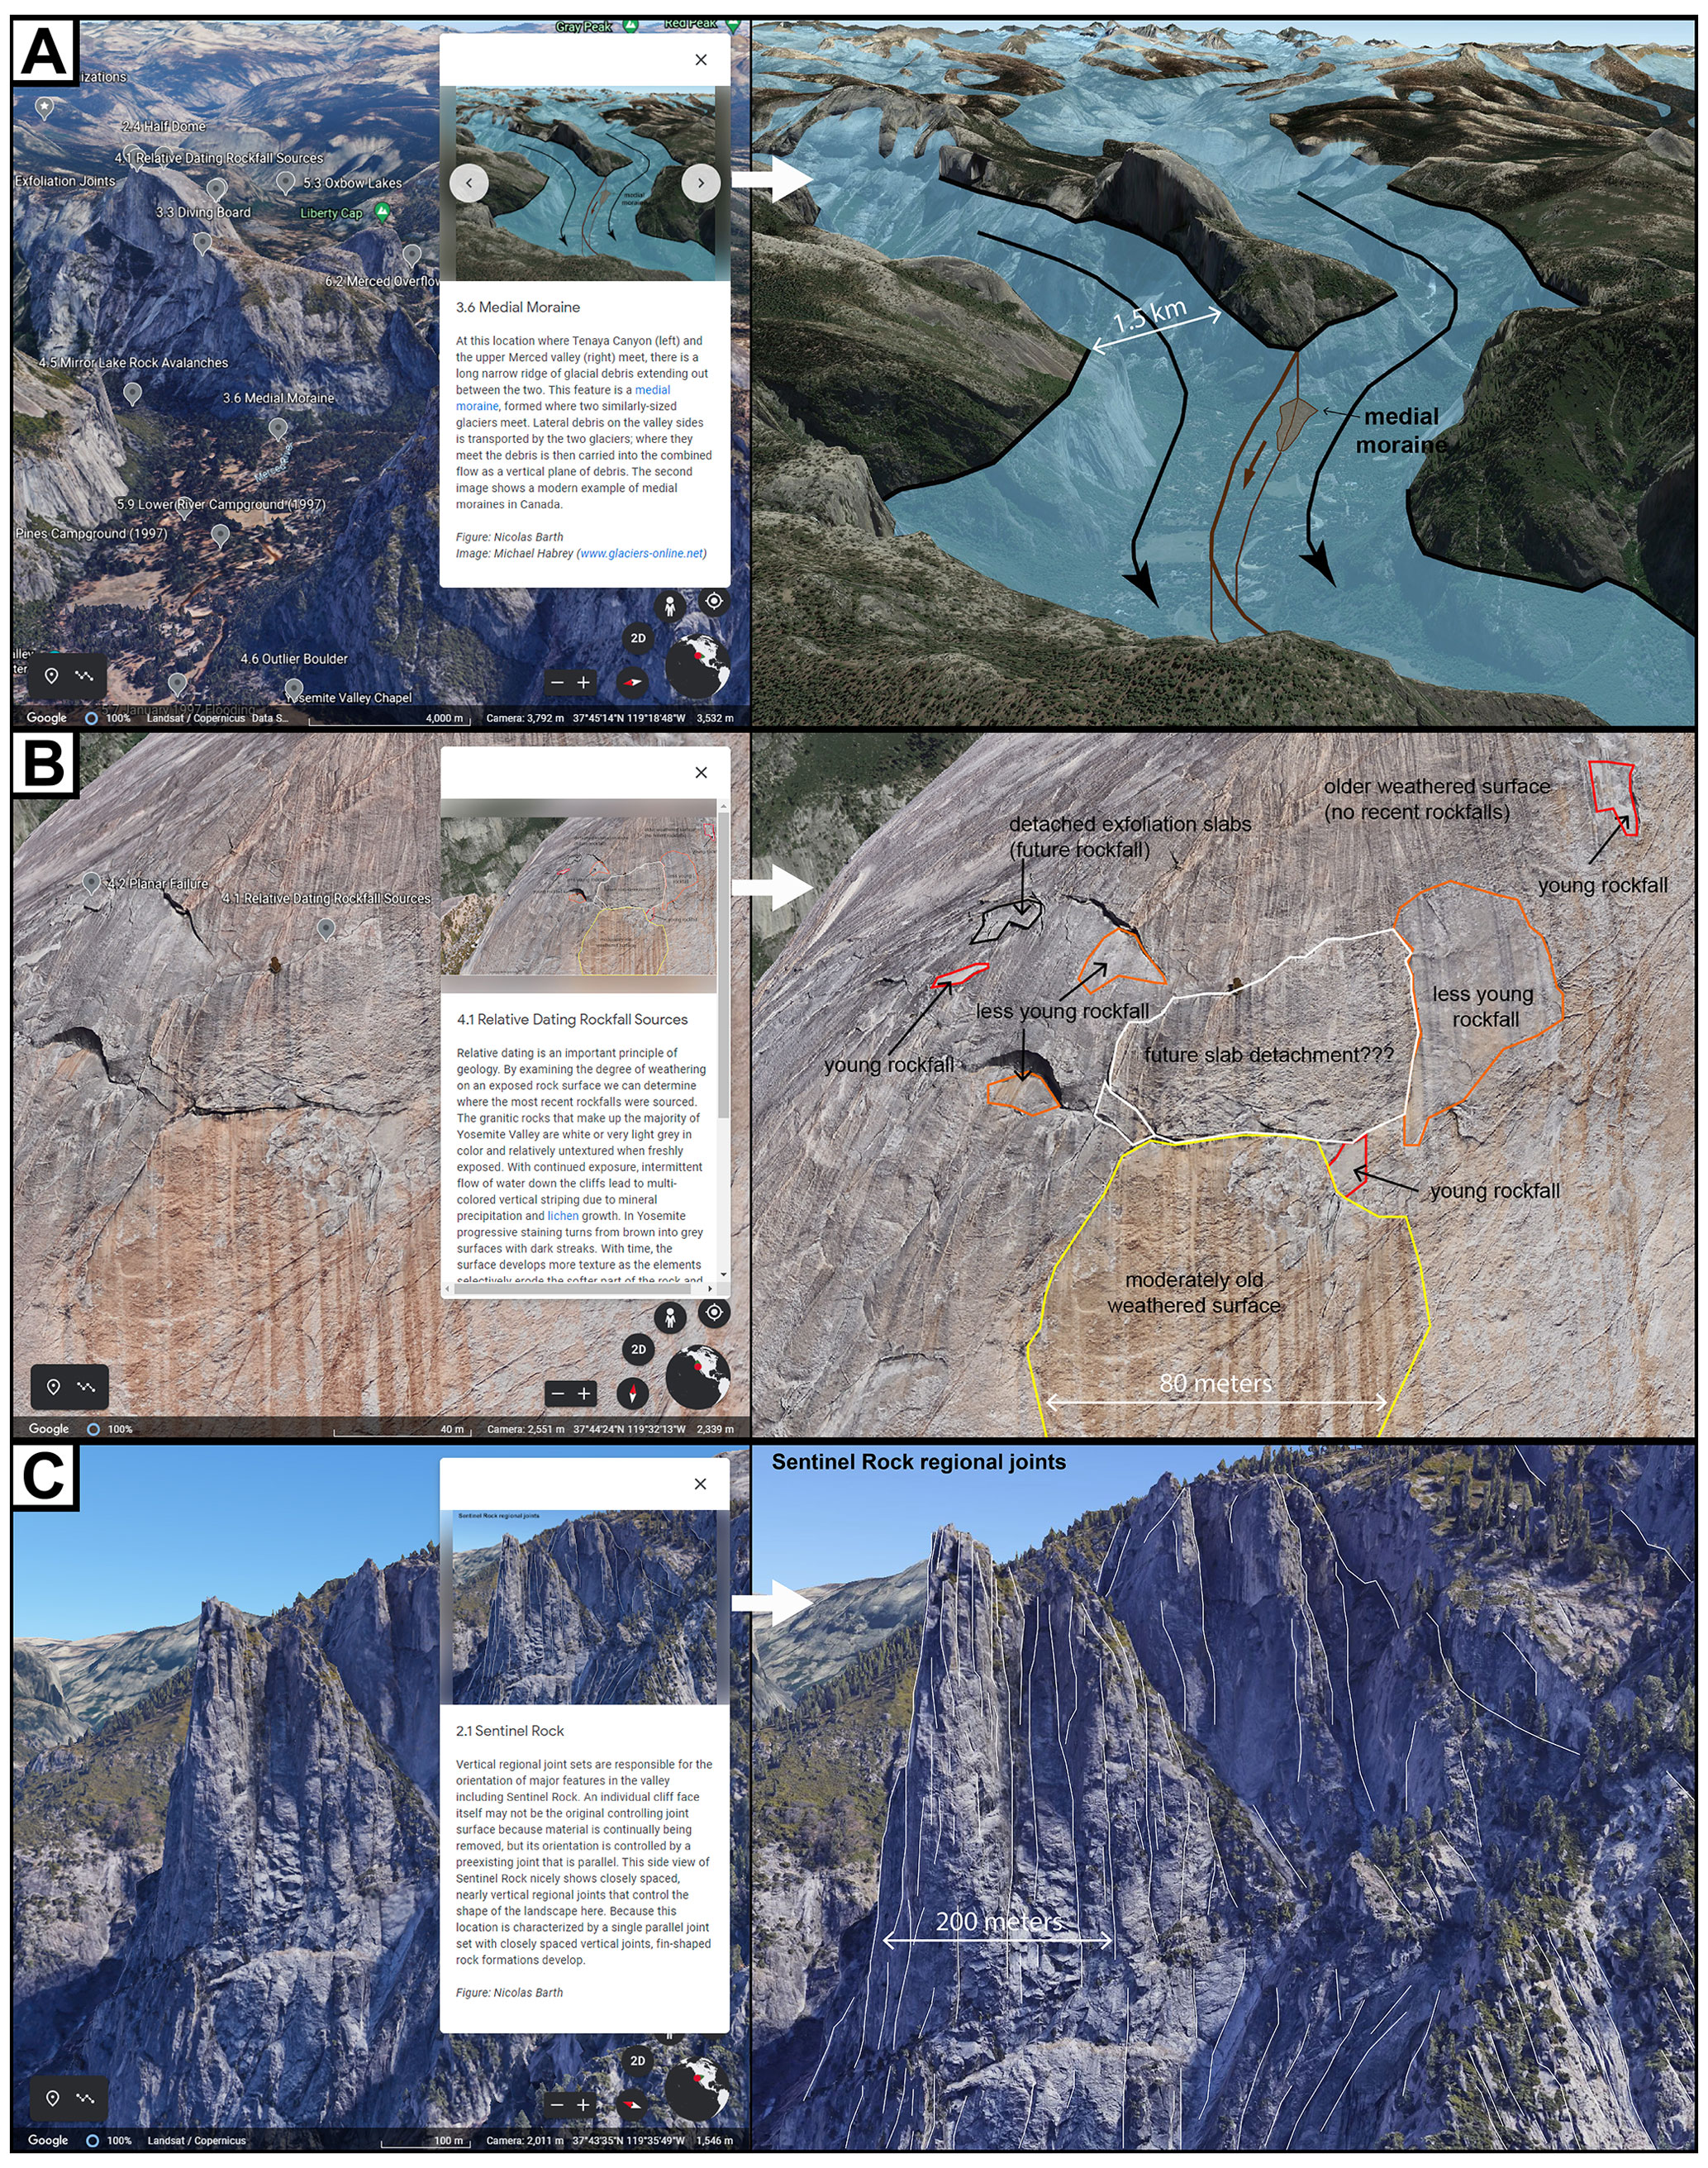
Figure 3VFT stops highlighting learning through guided exploration. Left panels show the VFT stop view in © Google Earth Web; right panels show the corresponding annotated image embedded in the stop's description. VFT stops showcase (a) the medial moraine at the junction of Tenaya Creek and Merced River, (b) exfoliation-related rockfall sources of different ages on the slopes of Half Dome, and (c) regional joints exposed in the cliff faces of Sentinel Rock. By simulating the dynamic view in a figure, the viewer can better visualize the key features emphasized. In each instance, the dynamic view encourages the viewer to magnify the image to see a feature or search the surrounding area for similar features.
To be most broadly applicable, we designed this VFT without any assessment. Students receive participation credit for completing the VFT; if they are less diligent or skip stops, then they are more likely to need to revisit the VFT later to complete the other activity parts. Teachers could create their own quizzes that are hyperlinked at different stops and even link them directly to their records of scores if they have that functionality.
While the VFT could be conducted as a guided tour with an instructor leading the class through the field trip in a lecture format (this would probably take less time), the simplicity of the format and opportunities for deeper learning are greater if students are allowed to guide themselves (1–2 h). Like many in-person field trips, the Google Earth Web project format strikes an effective balance between purpose-driven stops with targeted learning goals and opportunities for learning through exploration. While the particular vantages, text, images, and videos are presented in a structured format to deliberately guide a student, a student can, at any point, break the script by magnifying or rotating their view, walking a trail, or even searching for additional photospheres. Afterwards, the table of contents allows the students to readily rejoin the tour. The mixture of medias and vantages allows for a particularly dynamic and engaging format. Peer reviewers, students, and general public viewers have all praised the VFT format. Creating a VFT using Google Earth Web Creation Tools is intuitive and easily taught; students could create their own VFT as an alternative to an oral, slide-based presentation (e.g., Senger et al., 2021).
2.2 El Capitan cross-cutting relationships exercise
Part II of the activity leverages the novel geologic map of the southeastern face of El Capitan (Putnam et al., 2014, 2015) as an advanced, real-world relative dating exercise. El Capitan is one of the most famous landmarks in Yosemite; it is an imposing, nearly kilometer-high vertical-walled monolith of exposed intrusive rock steeped in the history of rock climbing. With the help of rock climbers and gigapixel photographs, geologists have mapped intrusive units with eight different chemical compositions projected onto a vertical plane with great detail and precision (10 cm accuracy for most contacts). While some of the units may be time-transgressive (e.g., multiple generations of pegmatite dikes) or coeval (overlapping geochronologic ages and gradational contacts), the relationships are consistent enough that students can screenshot a particular region of the map and interpret the relationships to sort the eight units from oldest to youngest (Fig. 4). A solution file is available through the SERC website with verified instructor credentials.
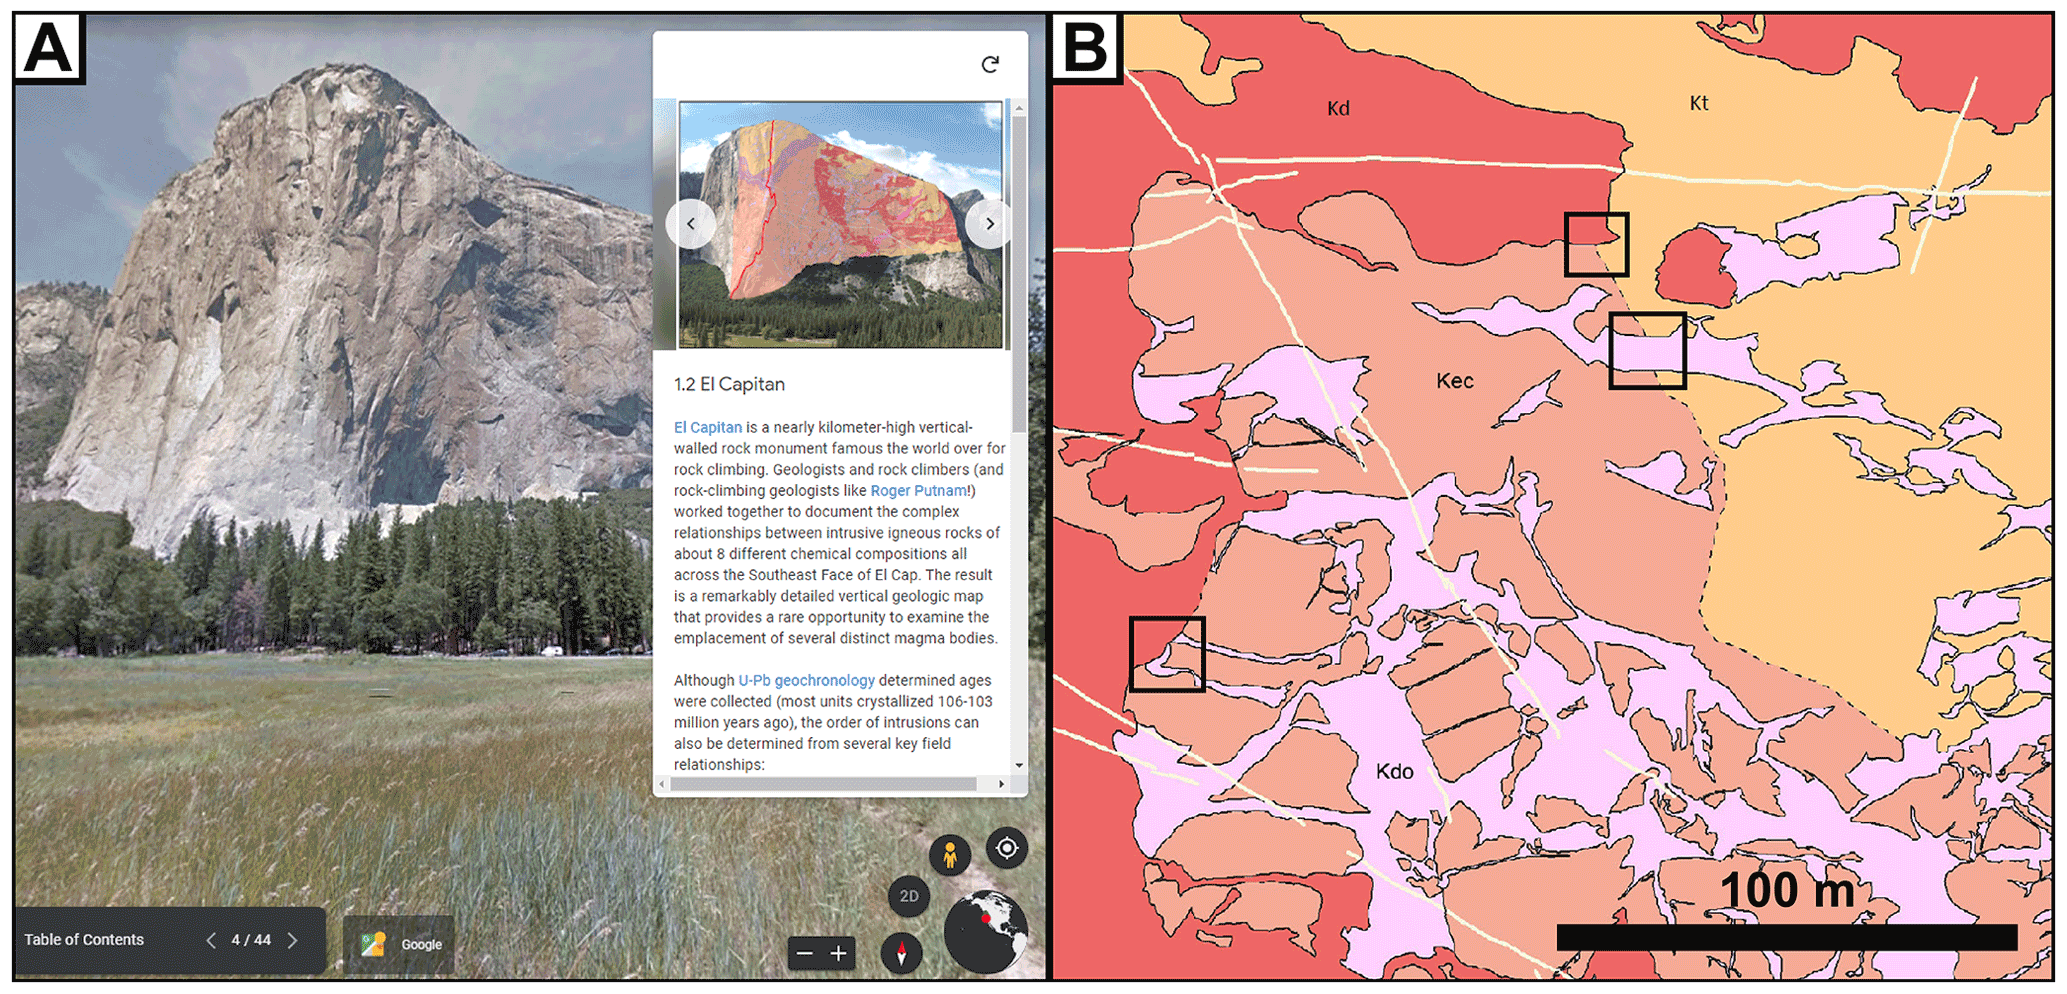
Figure 4Introducing a complex relative dating exercise. (a) A stop on the geology of Yosemite Valley VFT (© Google Earth Web) highlighting the vertical geologic map of El Capitan, created by Putnam et al. (2014), and providing an overview of the knowledge (cross-cutting relationships, law of included fragments, and gradational contacts) necessary to relatively date the intrusive units. (b) An excerpt from the modified Putnam et al. (2014) El Capitan geologic map that students use to determine the relative timing of eight intrusive units. Black boxes highlight three areas that provide unambiguous relationships between two or more units.
With author permission, a version of the geologic map (Putnam et al., 2014) was edited to remove details such as the geologic summary, correlation of mapped units, and geochronology so that students could focus on the mapped relationships. An El Capitan stop on the VFT provides the necessary background that students need to understand the basics of this geologic puzzle exercise. The concepts of cross-cutting relationships, gradational contacts, included fragments, and magma mixing are introduced, using relatable examples where possible (e.g., a cracked phone screen for cross-cutting relationships), and students are provided with an embedded link to download the modified map. Because students could search for the geologic map and companion journal article, this exercise works best as an in-session group exercise with lenient grading. Emphasis should be placed more on the locations the students decide on, to make screenshots to highlight the least ambiguous relationships, and their explanations provided.
Many cross-cutting relationship exercises given to students may involve sorting the timing of layered units, unconformities, folds, faults, and dikes. This El Capitan exercise is made more challenging by focusing on eight intrusive units with limited spatial layering and real-world relationships of varying ambiguity.
2.3 Geomorphic mapping of Yosemite Valley exercise
In Part III of the activity, students are tasked with producing a geomorphic map of the Quaternary (mostly Holocene) surficial deposits in Yosemite Valley using Google Earth Pro (desktop version; Fig. 5). Features to be mapped include deposits of talus (i.e., rockfall), debris fans, rock avalanches, and glacial moraines, as well as river terrace risers. The VFT highlights examples of each of these deposit types with additional background concerning processes and linked hazards (rockfall, flooding, and debris flows), including historic events. All the instructions and data links needed for this mapping exercise are contained within the Google Earth KMZ file provided to students. An example of each deposit type or feature to be mapped is provided to students in the folder structure that they will use to submit their final map (as a KMZ file). Students create their geomorphic map by interpreting web-served high-resolution hillshades (grayscale NW-illuminated representation of surface) derived from unfiltered (i.e., includes trees and buildings) and last return (i.e., bare Earth) airborne lidar data collected in 2006 (e.g., https://doi.org/10.5069/G9GQ6VP3, Yosemite, CA, 2021) and the internal web-served Google Earth satellite imagery built into the Google Earth engine. The different Quaternary features (debris fans, rock avalanches, etc.) have very Distinct textural and slope styles readily distinguishable in the bare-Earth lidar hillshade; once students gain an eye for it, they can efficiently map the 75 km2 Yosemite Valley region.
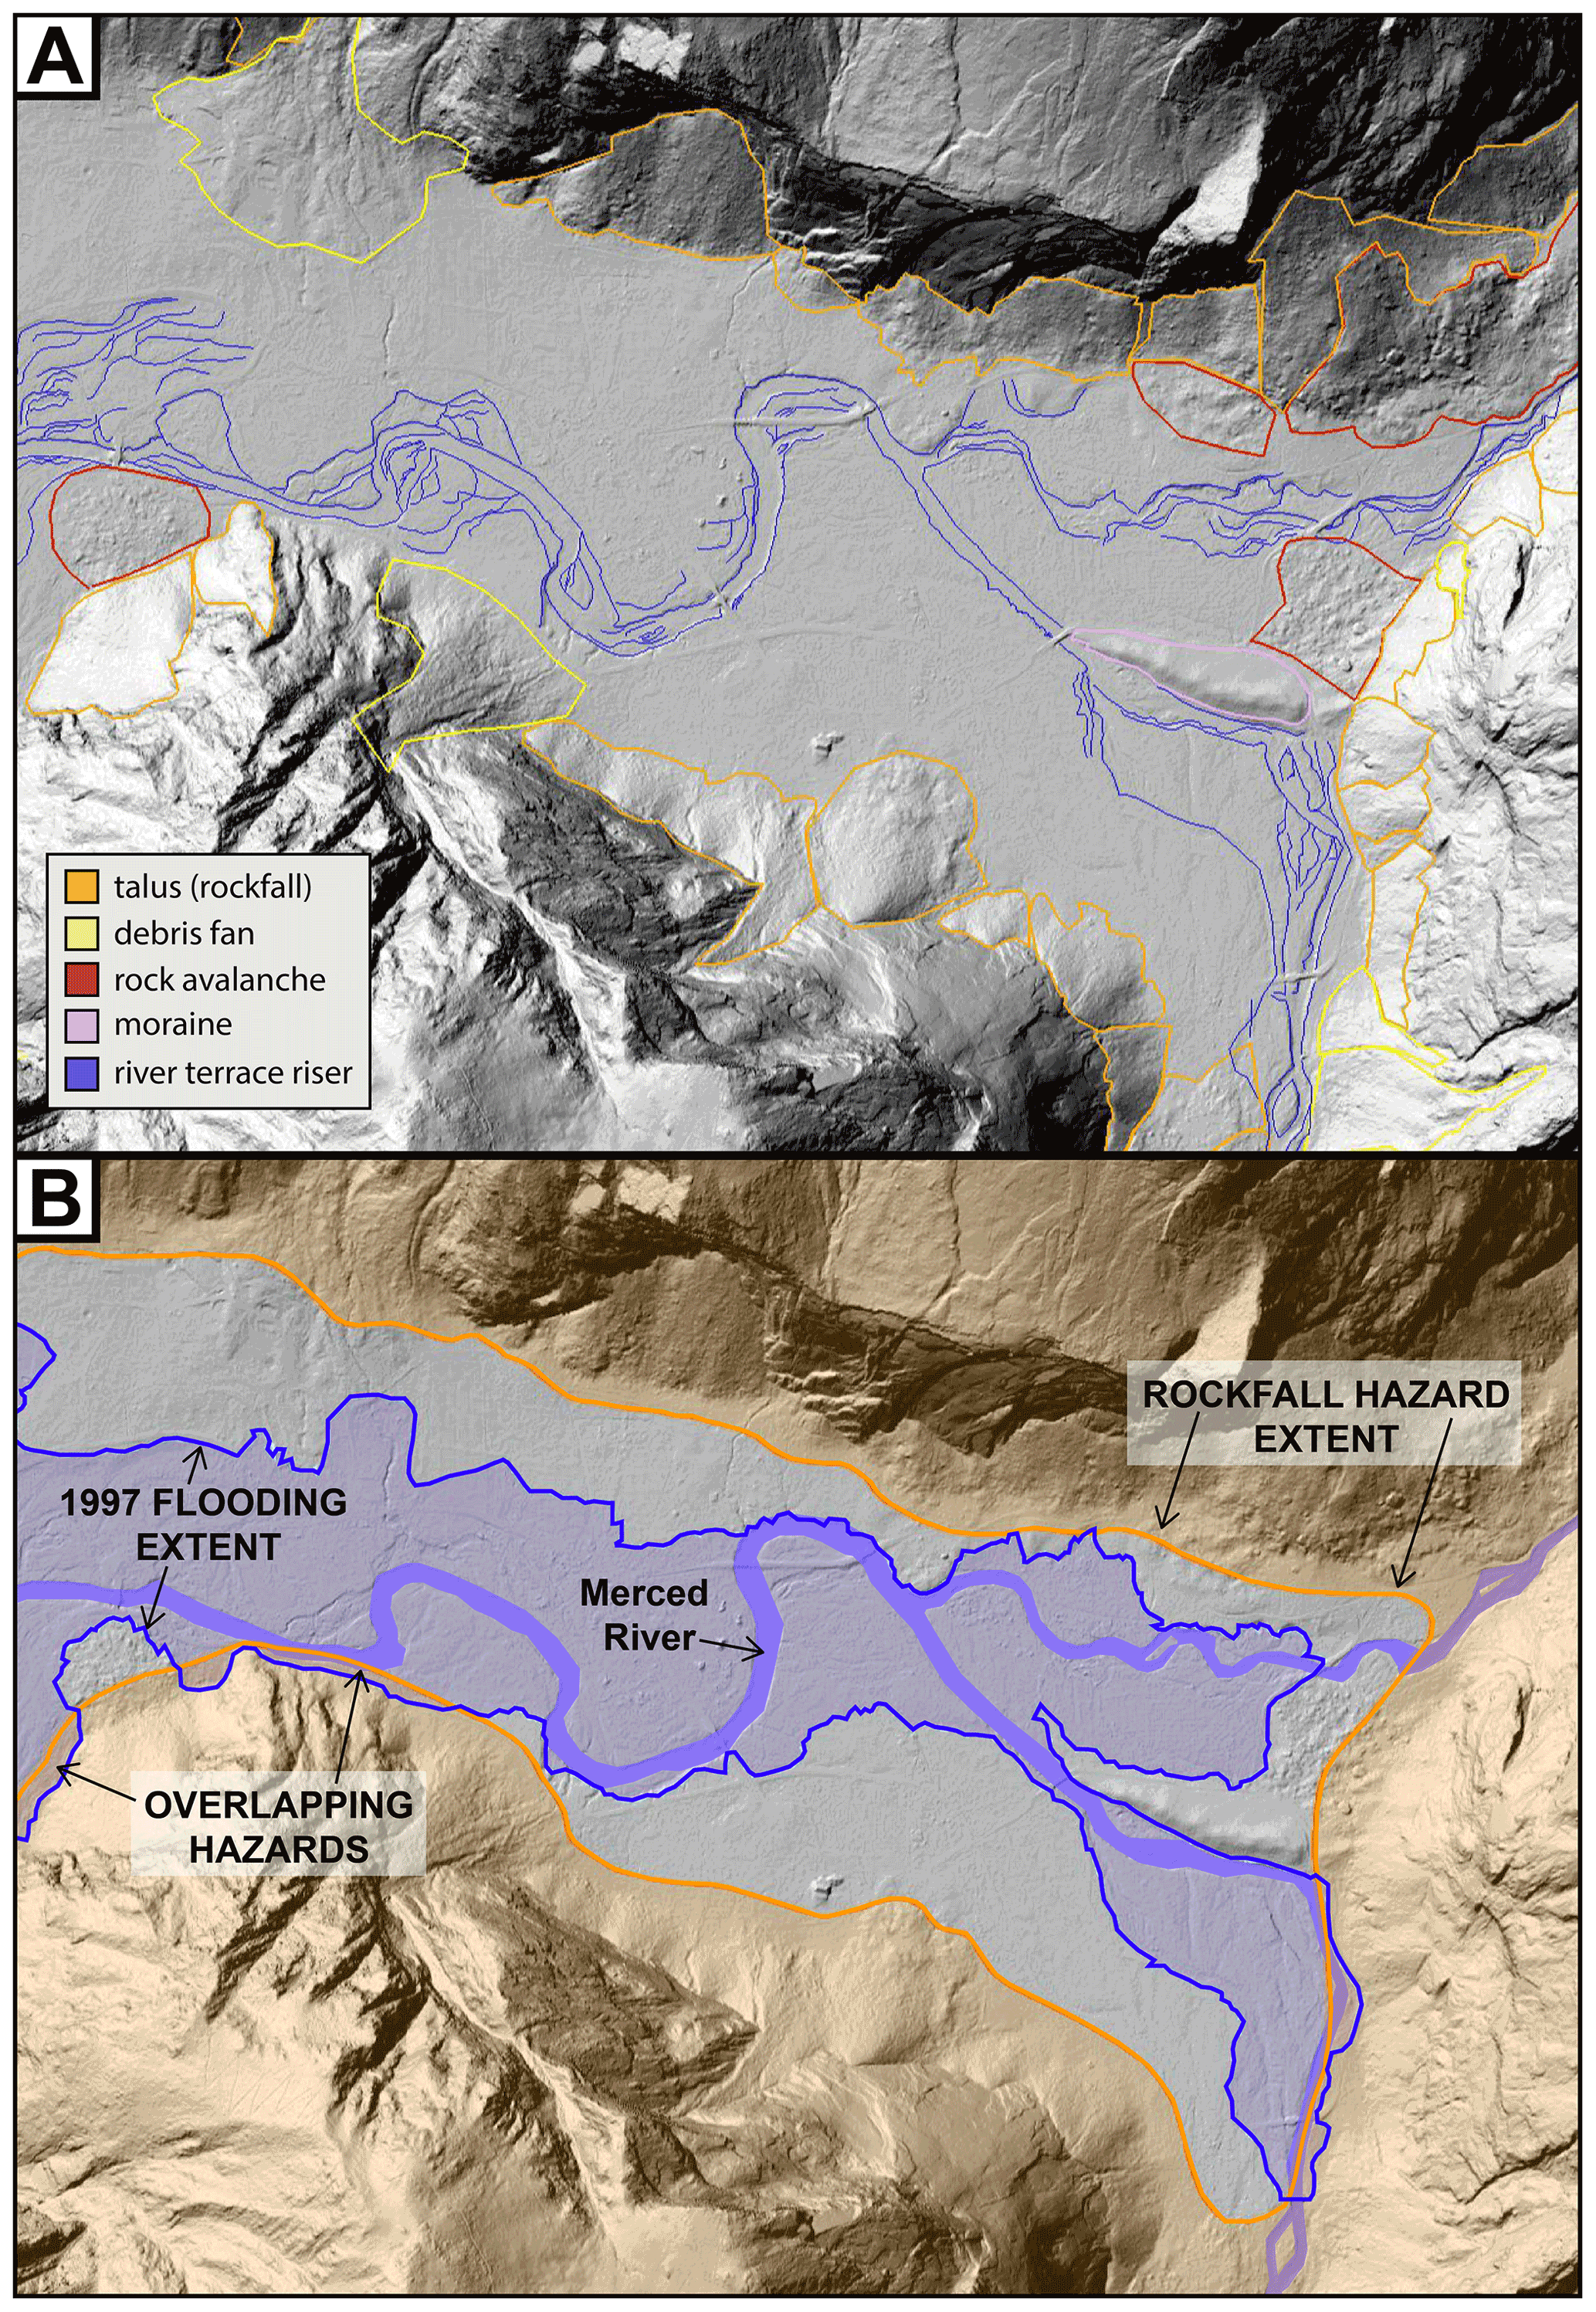
Figure 5From geomorphic mapping to hazard planning. (a) An excerpt from a virtual summer field student geomorphic map, which scored “highly competent” (still room for improvement), submitted as a © Google Earth KMZ file (final product of Part III of the activity). The basemap shown in both panels is a hillshade of bare-Earth airborne lidar data collected by the National Center for Airborne Laser Mapping (NCALM), hosted online by OpenTopography (https://doi.org/10.5069/G9GQ6VP3; Yosemite, CA, 2021). Students use a combination of the lidar visualizations and satellite imagery provided to map deposits based on texture, slope, and valley position. (b) A visualization of two hazard extents utilized by Yosemite National Park and provided to students. The blue line indicates the maximum extent of January 1997 flooding (approximating a 100-year flood). The orange line indicates the expected extent of rockfall hazard within the valley (i.e., beneath the valley walls) from Stock et al. (2014). In Part IV of the activity, students use their geomorphic mapping and these hazard extents to examine the hazards posed to existing infrastructure and identify areas of lower hazard suitable for further development. Geologically based justifications are expected for all of their recommendations. Location, scale, and orientation are deliberately excluded from this figure. The width of valley floor here is ∼ 1 km.
This mapping exercise is most appropriate for an advanced undergraduate course (e.g., geomorphology, applied geology, and capstone field geology). The maps are scored based on correctness, completeness, and neatness; the quality of the work is expected to be comparable to that produced by an entry-level professional geoscientist. An instructor-produced map is available through the SERC website with verified instructor credentials. An entire class's KMZ maps can be added to the instructor's Google Earth, allowing them to efficiently and objectively sort the maps based on quality, check for cheating, and identify obvious gaps in quality that signify score boundaries. From our experience in 2020 and 2021, these maps are among the best products students have produced in UCR's remote summer field alternative courses. In the process of mapping, most students (82 %; 18 out of 22) recognize that nearly all of the valley walls have talus or debris flow deposits at their base; many (64 %; 14 out of 22) recognize the variable density of river terrace risers along the length of the valley.
2.4 Geologically reasoned decision-making in Yosemite Valley exercise
Part IV of the activity builds on the detailed geomorphic mapping the students did in Part III, which, in turn, builds on the knowledge gained in Part I's VFT. In a KMZ file students are provided with, there are the following two real-world hazard extents that Yosemite National Park uses for planning and preparedness: the known extent of the January 1997 flood in the valley, approximating a 100-year flood, and a rockfall hazard extent that considers talus slopes and isolated boulders but not rock avalanches (Stock et al., 2014; Fig. 5). Students immediately recognize that some places in Yosemite Valley are expected to be susceptible to both floods and rockfalls, and that most of the valley floor is susceptible to one of the hazards. Looking at the hazard extents overlain on the Google Earth satellite imagery, students can readily see what existing park infrastructure is within or near the hazard extents.
Students are tasked with using both their geomorphic mapping and the hazard extents to (1) provide recommendations for existing Yosemite Valley infrastructure that could be relocated to a less hazardous location and (2) identify locations that would be suitable for additional development with varying levels of risk (e.g., a hotel, visitor center, storage facility, or parking lot). Students turn in a KMZ file indicating their recommendations and a technical report written as if they were consulting for the park (an oral presentation would be an effective format too). It is emphasized that the recommendations students provide must be well-reasoned and geologically sound. Students should consider the nature of the respective hazards (e.g., rockfalls occur instantly and without warning and can be fatal, whereas floods in the valley are predictable several days out and are rarely fatal) and the facility use (parking lots in flood zones can perhaps be evacuated with limited damage, a seldom-visited storage yard is better near a rockfall hazard zone than a campsite, etc.) when providing their recommendations. Students become particularly invested seeing how the numerous facilities are placed throughout the valley. By the end of the exercise, they gain an appreciation for the limited real estate available for further development in the valley, that natural hazards are an active part of Yosemite Valley, and that there are considerable challenges associated with making decisions that affect the safety of over 4 million people a year.
3.1 Designing virtual field trips with Google Earth Web
The Projects feature of Google Earth Web is a robust and adaptable format for semi-immersive virtual field trips that can be created with relative ease and presented intuitively. Instructors and students alike can learn the basics of project creation in about 15 min, making it an efficient format for instructors and also suitable for students to create their own VFT as part of a course's final project. The VFT can be made readily available on web-connected tablets (via Google Earth) or computers (via web browser such as Google Chrome) using a simple web link. The abundant fair-use imagery available through the Google Earth Engine (topography-draped satellite images, 360∘ street-level images, and user-submitted 360∘ photospheres) often means VFT creators do not have to start from scratch. Using a 360∘ camera or the Google Street View application, the VFT creator can also upload their own photospheres. The ability to not only geotag a field trip stop as a point on a map but also to curate a precise starting view for that stop (e.g., magnification level, oblique 3D vantage, or particular view orientation in a photosphere) allows the creator to draw attention to the vantage most directly relevant to the learning goals for that stop. Text, images, and videos can be added to a sidebar supporting the stop's view; annotated photos of a similar or identical view can be particularly illustrative. However, each stop's view is not fixed, allowing the viewer to explore off-script, which can improve their situational awareness and provide opportunities for independent learning. Advanced creators can customize the HTML for a given HTML stop, providing an opportunity to add custom icons, narration, and built-in quizzes. Though less self-contained, hyperlinks offer an opportunity to send students to external web addresses for background information (e.g., Wikipedia), quizzes or surveys (e.g., Google Forms), and even web-hosted 3D models of outcrops or hand samples (e.g., Sketchfab or V3Geo).
As a result of the COVID-19 pandemic, Google Earth Web VFTs were created for several locations that instructors would otherwise be taking students to for physical field trips, such as Greece (Evelpidou et al., 2021b) and Colorado, USA (Mahan et al., 2021). A notable pre-pandemic general, public-focused implementation of Google Earth Web Earth projects as VFTs is Streetcar 2 Subduction, hosted by the American Geophysical Union (Rowe et al., 2020; https://www.agu.org/streetcar2subduction, last access: 25 January 2022). On their dedicated web page, eight separate Earth projects are linked that cover geological field trips in the San Francisco Bay area, building on the classic field trip guidebook A Streetcar to Subduction and Other Plate Tectonic Trips by Public Transport in San Francisco by Wahrhaftig (1984). While these trips are fully functional as VFTs, they include information on transportation and safety logistics and are designed as self-guided walking tours. Because there is often cellular data reception in these urban-adjacent field trip areas, a self-guided participant can use their GPS position (as a blue dot) to navigate from one stop to the next within the VFT frame and access the text, annotated images, and videos provided at each stop along the way. There is a vast collection of existing field trip guidebooks that could be adapted into immersive VFTs to reach a broader audience. Despite a global pandemic, United States national parks still hosted 237 million visitors in 2020; the top 10 visited parks all prominently feature geology (National Park Service News Release, 2021). One could imagine the value of linking immersive VFTs on park websites to help visitors plan their physical trips and phone-scannable QR codes displayed outside visitor centers that would allow self-guided trips.
Currently, there are several limitations of the Google Earth Web project format that are worth discussion. There is no functionality to add georeferenced layers to a Google Earth Web project, such as a geologic map that could be turned on or off over a landscape or a folder of data points that are distinct from field trip stops. Analysis is limited to measuring distances and areas. Google Earth Web also currently does not have the ability to switch between different imagery dates, a stellar feature on Google Earth Pro (desktop) that better highlights landscape changes (e.g., before and after a wildfire). If there was a more straightforward way to cache all imagery and media related to a project, then the VFT could be taken to remote field locations and actually be used as more of an interactive field trip guide. At the moment there does not seem to be a way to directly embed 3D models into Google Earth Web project sidebars; we attempted to embed web-hosted Sketchfab, SketchUp, and 3D PDF models but were blocked by script or cookie permissions. The ability to add an embedded 3D scan of a rock sample or a detailed outcrop model would likely add to a VFT viewer's experience (these can still be hyperlinked, though). Adapting the Google Earth Web project format to Google Earth VR would certainly boost the immersiveness of a VFT but at the cost of being a less accessible format for many due to the specialized equipment currently needed for virtual reality (VR; e.g., Hagge, 2021). For public outreach efforts and student engagement, it would also be beneficial if statistics could be accessed about the number of viewers and how long they viewed the VFT. Google Earth has been around for over 20 years, and software development continues to actively be supported, but, as with any format, longevity is not guaranteed.
3.2 Comparison to other VFT formats
ArcGIS Online allows multiple layers of vector data to be viewed on a single customizable map interface (though currently custom raster layers are not supported) and provides the ability to analyze and filter the data (e.g., West and Horswell, 2018); however, this format does not really support a presented or guided structure, and so additional resources are needed to support a VFT. ArcGIS StoryMaps, best characterized as a map-centric dynamic web page, is another adaptable format suitable for geographically oriented tours or narratives (for VFT examples, see Evelpidou et al., 2021a; Senger et al., 2021). StoryMaps offers a more structured and less immersive VFT option than Google Earth Web projects. Other more specialized formats exist on pay-to-create software platforms. StoryMaps GPS (e.g., California State University Fullerton's Yosemite Fire and Ice tour at https://www.travelstorys.com/tours/154/Yosemite%20National%20Park, last access: 25 January 2022; Gutierrez and Guinto, 2021) offers a similar presented format to Google Earth Web, with an overview map and field stops that can be selected from a table of contents, but lacks the key ability to associate a discrete view with each stop.
Arizona State University hosts many publicly accessible VFTs built in the Smart Sparrow software platform (Mead et al., 2019; https://vft.asu.edu/, last access: 25 January 2022). These trips are largely photosphere-centric, with built-in links to video and image pop-ups and links to additional photosphere stops; the result is an immersive experience with high production value (there are even ambient bird sounds) in a completely self-contained format. Several educators have been experimenting with using video game platforms (e.g., Minecraft, https://itch.io, last access: 25 January 2022) to allow exploration-based field simulations in both scanned real-world sites and fictional environments (Needle et al., 2021; Rader et al., 2021); these formats typically require more commitment on the part of the educators to design and implement but can be engaging, allow interaction between students, and mimic the freedom of mapping a region for the first time. VR experiences offer the most immersive VFT possibilities by allowing the viewer to have the virtual environment surround them (e.g., Peterson et al., 2020; Hagge, 2021; Métois et al., 2021); unfortunately, the specialist VR goggles, software, and computer are likely unavailable to most students at home, and students will almost certainly need to take turns in a classroom setting. Arguably one of the more flexible formats for presenting VFTs remains a custom HTML web page; this format allows embedding of maps (e.g., ArcGIS Online and Google My Maps) and 3D outcrop or rock sample models (e.g., Sketchfab), as well as external web links or links to download supporting materials (e.g., Bond and Cawood, 2021).
3.3 Building effective learning through VFTs
Undoubtedly, a major advantage of VFTs is their immediate accessibility to locations around the globe and beyond. Additionally, VFTs through Google Earth provides opportunities for students to participate in cognitively engaging and interactive learning experiences, which have been found to improve student outcomes in STEM (science, technology, engineering, and mathematics) courses (Freeman et al., 2014; National Research Council, 2011). In a recent meta-analysis synthesizing the findings from 225 studies, Freeman and colleagues (Freeman et al., 2014) found that interactive and active learning experiences, such as those provided by VFTs, are better for students' STEM learning than pedagogical experiences that rely heavily on didactic instruction (e.g., lecture-based instruction).
VFTs using Google Earth allow students to engage in guided-discovery learning (Mayer, 2004). Virtual learning environments based solely on discovery learning allow students to independently explore and solve problems with little to no guidance (Lee and Anderson, 2013; Mayer, 2004). However, one drawback to this type of learning environment is that it can be a source of extraneous cognitive load, especially when it comes to users with limited knowledge about geology and conducting fieldwork. Cognitive load refers to the load that performing a particular task imposes on the cognitive system (e.g., Paas and Van Merrienboer, 1994; Sweller, 2011). The amount of information one's cognitive system can process at a given moment is limited. Thus, the presentation of too much information, some of which is unnecessary information when it comes to solving the task, can result in artificially increasing the cognitive resources needed to process the relevant content. This is referred to as extraneous cognitive load by Sweller (2010), and it results in decreasing the efficiency and efficacy of the learner's cognitive system (see the review of cognitive load theory by Paas et al., 2010). With the aim of reducing the learner's cognitive load, the embedded instructional prompts that the Google Earth VFT format affords enables the instructor to promote a guided discovery of the environment by allowing for the integration of direct instruction into discovery learning (e.g., Lee and Anderson, 2013; Mayer, 2004). This direct instruction provides students with the scaffolding (i.e., additional learning supports that can eventually be decreased with increasing ability) necessary to navigate and learn from such a perceptually and information-rich environment (e.g., Lee and Dalgarno, 2011).
Google Earth-based VFTs are also an effective means to scaffold students' spatial skills. Spatial skills are a set of cognitive skills that enable us to manipulate, organize, reason about, and make sense of spatial relationships in real and imagined spaces (e.g., Atit et al., 2020; Newcombe and Shipley, 2015; Uttal et al., 2013). Field geology heavily relies on the use of spatial skills, as the goal is to use present-day spatial properties to infer the geologic history of a region (e.g., Atit et al., 2020; Shipley and Tikoff, 2016). In particular, identifying the relevant spatial properties in the field requires the geologist to focus their attention on the critical spatial information (e.g., the orientation of a bedding plane). Focusing attention on the important spatial information involves actively ignoring many other aspects of the scene (e.g., the size of the minerals, the fault slightly offsetting the layers, and the talus pile at the base of the outcrop as these geologic features are not pertinent to the problem at hand). The spatial skills used to identify relevant information for further cognitive processing is called disembedding in the geosciences (Manduca and Kastens, 2012; Reynolds, 2012) and selective attention in psychology (Moran and Desimone, 1985). Novices find disembedding to be difficult (Coyan et al., 2010; Shipley and Tikoff, 2016). Google Earth allows the user to remove the extraneous irrelevant information from the scene, thereby bolstering geologically relevant disembedding tasks for novice users.
3.4 From general public VFT to geologically reasoned decisions
Through our geology of Yosemite Valley activity, we provide an example of how a VFT can be designed to be approachable to a broad general public audience and, at the same time, serve as background information for an advanced undergraduate student mapping project. Hyperlinking technical words to external resources is an invaluable way of unobtrusively broadening the target audience. Distilling VFT stops to the most critical learning goals (especially with annotated images and videos) and encouraging interaction with the immersive view at the stop likely increases learning and engagement. Designing exercises that require students to utilize a combination of data they create (e.g., mapping) and real-world data (e.g., hazard data and stream gauge data) to justify decisions trains them to develop professional skills and increases their investment in the task. The progression from VFT to mapping to professional-style consultant report produced the highest quality work of any of the eight activities and exercises covered in UCR's 2020 and 2021 virtual summer field geology course offerings. Student feedback (n=10) collected through an anonymous web survey in the 2021 offering indicates that the geology of Yosemite Valley activity garnered the most positive response. In total, 50 % of the class said the activity was their favorite component of the course, and 60 % said they learned the most from it; no student thought it was their least favorite or that they learned the least from it (unfortunately, no anonymous feedback was collected from students in 2020).
The Projects feature of Google Earth Web is a robust and adaptable format to create rich and engaging virtual field trips with relative ease. The abundant fair-use imagery built into the Google Earth Engine (satellite images, 360∘ street-level images, and user-submitted 360∘ photospheres) allows for immersive stops that enable creators to point to specific features but also encourages viewers to learn by exploration, mimicking an advantage of in-person field trips. Many media types can be directly embedded (images, videos, and narration) or hyperlinked (websites, 3D models, quizzes, etc.) to customize the VFT presentation and adapt it to a broad range of knowledge levels ranging from the general public to advanced undergraduate students. Where cellular coverage exists, this VFT format can also be used for self-guided field trips. When properly implemented, a general public-oriented VFT can be used as background for mapping exercises, which, in turn, can be used to encourage students to support geologically reasoned decision-making.
All components of the activity underlying this study are available at the publicly accessible Geology of Yosemite Valley web page hosted on the NAGT Teaching with Online Field Activities website (https://serc.carleton.edu/NAGTWorkshops/online_field/activities/237092.html, last access: 25 January 2022; Barth, 2020).
NCB conceived and created the teaching exercises. NCB led writing of the paper and created the figures. GMS contributed content and expertise to the teaching exercise and provided edits to the paper. KA contributed the pedagogical discussion (Sect. 3.3) to the paper.
The contact author has declared that neither they nor their co-authors have any competing interests.
Publisher's note: Copernicus Publications remains neutral with regard to jurisdictional claims in published maps and institutional affiliations.
This article is part of the special issue “Virtual geoscience education resources”. It is not associated with a conference.
The authors wish to acknowledge Allen Glazner, for his critical review of the VFT's scientific content. Rachel Atkins, Ryan Petterson, Alberto Pizzi, Nadia Salvatore, and Ben van der Pluijm are thanked, for their early peer review that improved the VFT's functionality. Our thanks are extended to Christopher Atchison, Anne Egger, Basil Tikoff, Kurt Burmeister, and Katherine Ryker, for spearheading the joint NAGT-IAGD Designing Remote Field Experiences effort, and to the participants in the Virtual Class-Related Field Trips working group. The authors are grateful to the journal peer reviewers, Christian Haug Eide and Jessica Helen Pugsley, whose suggestions improved the paper.
This paper was edited by Simon Buckley and reviewed by Christian Eide and Jessica Pugsley.
Arthurs, L. A.: Bringing the Field to Students during COVID-19 and Beyond, GSA Today, 31, 28–29, https://doi.org/10.1130/GSATG478GW.1, 2021.
Atit, K. A., Uttal, D. H., and Stieff, M.: Situating Space: Using a Discipline-Focused Lens to Examine Spatial Thinking Skills, Cognitive Research: Principles and Implications, 5, 19, https://doi.org/10.1186/s41235-020-00210-z, 2020.
Barth, N.: Geology of Yosemite Valley, University of California-Riverside, https://serc.carleton.edu/NAGTWorkshops/online_field/activities/237092.html (last access: 25 January 2022), 2020.
Bond, C. E. and Cawood, A. J.: A role for virtual outcrop models in blended learning – improved 3D thinking and positive perceptions of learning, Geosci. Commun., 4, 233–244, https://doi.org/10.5194/gc-4-233-2021, 2021.
Coyan, J., Busch, M., and Reynolds, S.: Using eye tracking to evaluate the effectiveness of signaling to promote disembedding of geologic features in photographs, Spatial Cognition 2010: Doctoral Colloquium, 2010.
Geology of Yosemite Valley: https://serc.carleton.edu/NAGTWorkshops/online_field/activities/237092.html, last access: 25 January 2022.
Geology of Yosemite Valley Virtual Field Trip: https://earth.google.com/web/@37.73678425,-119.58078081,1418.42744788a,93163.53588265d,35y,0h,0t,0r/ data=MicKJQojCiExVzg4OHVMNGgtRW5JYkY3bnJlSTZyR GhoblljcEk2VFo6AwoBMA?authuser=0, last access: 24 August 2021.
Gutierrez, J. and Guinto, I.: Yosemite: A Story of Fire and Ice, TravelStorysGPS, available at: https://www.travelstorys.com/tours/154/Yosemite%20National%20Park, last access: 24 August 2021.
Evelpidou, N., Karkani, A., Komi, A., Giannikopoulou, A., Tzouxanioti, M., Saitis, G., Spyrou, E., and Gatou, M.-A.: Interactive virtual fieldtrip as a tool for remote education, Geosci. Commun. Discuss. [preprint], https://doi.org/10.5194/gc-2021-21, in review, 2021a.
Evelpidou, N., Karkani, A., Saitis, G., and Spyrou, E.: Virtual field trips as a tool for indirect geomorphological experience: a case study from the southeastern part of the Gulf of Corinth, Greece, Geosci. Commun., 4, 351–360, https://doi.org/10.5194/gc-4-351-2021, 2021b.
Freeman, S., Eddy, S. L., McDonough, M, Smith, M. K., Okoroafor, N., Jordt, H., and Wenderoth, M. P.: Active learning increases student performance in science, engineering, and mathematics, P. Natl. Acad. Sci. USA, 111, 8410–8415, https://doi.org/10.1073/pnas.1319030111, 2014.
Hagge, P.: Student Perceptions of Semester-Long In-Class Virtual Reality: Effectively Using “Google Earth VR” in a Higher Education Classroom, J. Geogr. Higher Educ., 45, 342–360, https://doi.org/10.1080/03098265.2020.1827376, 2021.
Lee, H. S. and Anderson, J. R.: Student learning: What has instruction got to do with it?, Annu. Rev. Psychol., 64, 445–469, https://doi.org/10.1146/annurev-psych-113011-143833, 2012.
Lee, M. J. W. and Dalgarno, B.: Scaffolding discovery learning in 3D virtual learning environments: Challenges and considerations for instructional design, in: Virtual Immersive and 3D Learning Spaces, Emerging Technologies and Trends, edited by: Hai-Jew, S., IGI Global, 138–169, https://doi.org/10.4018/978-1-61692-825-4.ch008, 2011.
Mahan, K. H., Frothingham, M. G., and Alexander, E.: Virtual mapping and analytical data integration: a teaching module using Precambrian crystalline basement in Colorado's Front Range (USA), Geosci. Commun., 4, 421–435, https://doi.org/10.5194/gc-4-421-2021, 2021.
Manduca, C. A. and Kastens, K. A.: Geoscience and geoscientists: Uniquely equipped to study Earth, in: Earth and Mind II: A Synthesis of Research on Thinking and Learning in the Geosciences, edited by: Kastens, K. A. and Manduca, C. A., The Geological Society of America, Boulder, Colorado, 1–12, 2012.
Mayer, R. E.: Should there be a three-strikes rule against pure discovery learning? The case for guided methods of instruction, Am. Psychol., 59, 14–19, https://doi.org/10.1037/0003-066X.59.1.14, 2004.
Mead, C., Buxner, S., Bruce, G., Taylor, W., Semken, S., and Anber, A. D.: Immersive, Interactive Field Trips Promote Science Learning, J. Geosci. Ed., 67, 131–142, https://doi.org/10.1080/10899995.2019.1565285, 2019.
Métois, M., Martelat, J.-E., Billant, J., Andreani, M., Escartín, J., Leclerc, F., and the ICAP team: Deep oceanic submarine fieldwork with undergraduate students: an immersive experience with the Minerve software, Solid Earth, 12, 2789–2802, https://doi.org/10.5194/se-12-2789-2021, 2021.
Moran, J. and Desimone, R.: Selective attention gates visual processing in the extrastriate cortex, Science, 229, 782–784, https://doi.org/10.1126/science.4023713, 1985.
National Park Service News Release: National Parks Hosted 237 Million Visitors in 2020, available at: https://www.nps.gov/orgs/1207/02-25-21-national-parks-hosted-237-million-visitors-in-2020.htm, last access: 20 August 2021.
National Research Council: Learning science through computer games and simulations, edited by: Honey, M. A., Hilton, M. L., National Academies Press, https://doi.org/10.17226/13078, 2011.
Needle, M. D., Crider, J. G., Mooc, J., and Akers, J. F.: Virtual field experiences in a web-based videogame environment: Open-ended examples of existing and fictional field sites, Geosci. Commun. Discuss. [preprint], https://doi.org/10.5194/gc-2021-17, in review, 2021.
Newcombe, N. S. and Shipley, T. F.: Thinking about spatial thinking: New typology, new assessments, Studying Visual and Spatial Reasoning for Design Creativity, edited by: Gero, J., Springer Dordrecht, 179–192, https://doi.org/10.1007/978-94-017-9297-4_10, 2015.
Paas, F. and Van Merrienboer, J. J. G.: Instructional control of cognitive load in the training of complex cognitive tasks, Educ. Psychol. Rev., 6, 351–371, https://doi.org/10.1007/BF02213420, 1994.
Paas, F., van Gog, T., and Sweller, J.: Cognitive load theory: New conceptualizations, specifications, and integrated research perspectives, Educ. Psychol. Rev., 22, 115–121, https://doi.org/10.1007/s10648-010-9133-8, 2010.
Petersen, G. B., Klingenberg, S., Mayer, R. E., and Makransky, G.: The Virtual Field Trip: Investigating How to Optimize Immersive Virtual Learning in Climate Change Education, Bristich J. Ed. Tech., 51, 2098–2114, https://doi.org/10.1111/bjet.12991, 2020.
Phillips, C., Sunderlin, D., and Addy, T.: Adapting to New Modes of Teaching During COVID-19, J. Transform. Learn., 8, 10–21, 2021.
Putnam, R., Glazner, A. F., Coleman, D. S., Kylander-Clark, A. R. C., Pavelsky, T., and Abbot, M. I.: Plutonism in Three Dimensions: Field and Geochemical Relations on the Southeast Face of El Capitan, Yosemite National Park, California, Geosphere, 11, 1133–1157, https://doi.org/10.1130/GES01133.1, 2015.
Putnam, R. L., Glazner, A. F., Law, B. S., and Stock, G. M.: Geologic Map of the Southeast Face of El Capitan, Yosemite Valley, California, Geological Society of America, Map and Chart Series MCH106, 1 sheet, 2014.
Rader, E., Love, R., Reano, D., Dousay, T. A., and Wingerter, N.: Pandemic Minecrafting: an analysis of the perceptions of and lessons learned from a gamified virtual geology field camp, Geosci. Commun., 4, 475–492, https://doi.org/10.5194/gc-4-475-2021, 2021.
Reynolds, S. J.: Some important aspects of spatial cognition in field geology, in: Earth and Mind II: A Synthesis of Research on Thinking and Learning in the Geosciences, edited by: Kastens, K. A. and Manduca, C. A., The Geological Society of America, Boulder, Colorado, 75–77, 2012.
Rotzien, J. R., Sincavage, R., Pellowshki, Gavillot, Y., Filkorn, H., Cooper, S., Shannon, J., Yildiz, U., Sawyer, F., and Uzunlar, N.: Field-Based Geoscience Education during the COVID-19 Pandemic: Planning, Execution, Outcomes, and Forecasts, GSA Today, 33, 4–10, https://doi.org/10.1130/GSATG483A.1, 2021.
Rowe, C., Kirkpatrick, J., Blisniuk, K., and Bentley, C.: Creating Geological Field Trips with the Google Earth Creation Tools, Earth ArXiv [preprint], 15 pp., https://doi.org/10.31223/osf.io/wfngt, 2020.
Senger, K., Betlem, P., Grundvåg, S.-A., Horota, R. K., Buckley, S. J., Smyrak-Sikora, A., Jochmann, M. M., Birchall, T., Janocha, J., Ogata, K., Kuckero, L., Johannessen, R. M., Lecomte, I., Cohen, S. M., and Olaussen, S.: Teaching with digital geology in the high Arctic: opportunities and challenges, Geosci. Commun., 4, 399–420, https://doi.org/10.5194/gc-4-399-2021, 2021.
Shipley, T. F. and Tikoff, B.: Linking cognitive science and disciplinary geoscience practice: The importance of the conceptual mind, Memoir 111: Structural Interpretation: Earth, Mind, and Machine, American Association of Petroleum Geologists, 219–237, https://doi.org/10.1306/13561994M1113677, 2016.
Stock, G. M., Luco, N., Collins, B. D., Harp, E. L., Reichenbach, P., and Frankel, K. L.: Quantitative rock-fall hazard and risk assessment for Yosemite Valley, Yosemite National Park, California, U.S. Geological Survey: Scientific Investigations Report 2014-5129, https://doi.org/10.3133/sir20145129201, 2014.
Sweller, J.: Element interactivity and intrinsic, extraneous, and germane cognitive load, Educ. Psychol. Rev., 22, 123–138, https://doi.org/10.1007/s10648-010-9128-5, 2010.
Sweller, J.: Cognitive load theory, Psychol. Learn. Motiv., 55, 37–76, https://doi.org/10.1016/B978-0-12-387691-1.00002-8, 2011.
Uttal, D. H., Meadow, N. G., Tipton, E., Hand, L. L., Alden, A. R., Warren, C., and Newcombe, N.: The malleability of spatial skills: A meta-analysis of training studies, Psychol. Bull., 139, 352–402, https://doi.org/10.1037/a0028446, 2013.
Wahrhaftig, C. (Ed.): A Streetcar to Subduction and Other Plate Tectonic Trips by Public Transport in San Francisco, American Geophysical Union Special Publications, ISBN 9780875902340, https://doi.org/10.1029/SP022, 1984.
Walker, J. D.: Geology in an Online World, GSA Today, 31, 4–7, https://doi.org/10.1130/GSATPrsAdrs20.1, 2021.
West, H. and Horswell, M.: GIS has Changed! Exploring the Potential of ArcGIS Online, Teaching Geography, 43, 22–24, 2018.
Yosemite, CA: El Portal, Mariposa Grove, Yosemite Canyon & Tuolumne Meadows, airborne lidar data, https://doi.org/10.5069/G9GQ6VP3, 2021.