the Creative Commons Attribution 4.0 License.
the Creative Commons Attribution 4.0 License.
 | 20 Dec 2021
Teaching climate risk for water planning: a pilot training for tertiary students and practitioners in Brazil
Pablo Borges de Amorim
Pedro Luiz Borges Chaffe
Climate change is one of the major challenges of our society; thus educational resources on climate risk and adaptation are needed. In this case study, we present a short-duration face-to-face training for water professionals about the Intergovernmental Panel on Climate Change (IPCC)'s climate risk framework. The training uses problem-based learning (PBL) pedagogy, and its suitability and benefits are evaluated with qualitative observation and self-assessment of knowledge of tertiary students and practitioners from five independent groups in Brazil. We find that the application of a mapping exercise using the IPCC's climate risk framework supports learning about climate risk, as well as data interpretation, creativity, teamwork, communication, and critical thinking by the participants. This work merges the IPCC's climate risk framework and PBL for climate risk training. The proposed training enables the teaching of climate risk in stand-alone courses and professional development training in areas where climate is an embedded component.
- Article
(30698 KB) - Full-text XML
-
Supplement
(3194 KB) - BibTeX
- EndNote


Climate change is one of the major challenges that society is facing in the 21st century (Leal Filho, 2010; IPCC, 2018). The need for climate change education has been emphasized in several international agreements, such as the World Conference on Education for Sustainable Development in Aichi-Nagoya (Buckler et al., 2014), the United Nations Framework Convention on Climate Change, and the Paris Agreement (Leal Filho and Hemstock, 2019). To tackle the United Nations' Sustainable Development Goal 13: Climate Action (SDG 13, United Nations, 2016), UNESCO (2017) suggests special attention should be given to climate risk management.
Climate risk management integrates climate-related information into decision-making to decrease loss and damage (Travis and Bates, 2014). National and international climate initiatives are increasingly recommending climate risk assessments for adaptation planning (Brazil, 2016; IPCC, 2018; Sherbinin et al., 2019; Travis and Bates, 2014). The climate risk framework of the Intergovernmental Panel on Climate Change (IPCC) is commonly used to map risks and assess adaptation options (IPCC, 2014; Sherbinin et al., 2019). However, these are complex activities that require not only factual knowledge about climate change, but also problem-solving skills like the interpretation of data, teamwork, communication, creativity, and critical thinking (IPCC, 2014; Sherbinin et al., 2019; Travis and Bates, 2014). These skills can be improved with active learning (George et al., 2016; Lyon et al., 2013; Pierce, 2019; Pruneau et al., 2013). Active learning is defined as any instructional method that promotes student activity and engagement in the learning process (Prince, 2004). An active learning method that is well suited to climate change education is problem-based learning (PBL) (McCright et al., 2013). PBL is a pedagogical method based on principles of adult learning theory wherewith students learn about a subject through the experience of solving a real problem (Wood, 2003; Buckler et al., 2014). There is no consensus that students' scores are improved in PBL when compared to traditional learning, and some professionals believe the advantages are negligible in comparison to the resources and preparation needed (Prince, 2004; Wood, 2003) However, several studies find that PBL has a positive effect on learners' knowledge retention and interest in the subject (McCright et al., 2013), as well as on the development of problem-solving skills like interpretation of data, creativity, teamwork, and communication (Prince, 2004; Buckler et al., 2014; Wood, 2003; Pruneau et al., 2013), which are beneficial to climate change education (George et al., 2009; McCright et al., 2013; Pierce, 2019; Pruneau et al., 2013). A sound climate risk training and effective educational courseware based on PBL can save time and resources and are likely to enhance the learning of tertiary students and practitioners (George et al., 2016).
Training tertiary students and practitioners on climate risk is useful for enhancing awareness about the relevance of the topic and informing about the existence of methods to reduce climate risks (George et al., 2009, 2016). It can help society plan and implement adaptation options with respect to the impacts of climate change (Fernandez et al., 2014), as foreseen in the SDG 13 (United Nations, 2016). Training in climate risk has been shown to be effective in developing knowledge, attitudes, and skills of farmers, meteorologists, managers, and policymakers around the world to make informed decisions to tackle climate change impacts (e.g. Yen et al., 2019; George et al., 2006, 2019). This is particularly important for water professionals because the water sector is highly exposed to climate hazards, and global warming is projected to further intensify the water cycle (Jiménez Cisneros et al., 2014). This is especially the case in Brazil, where changes to a drier hydrological regime are expected in the future (Borges and Chaffe, 2019; Borges de Amorim et al., 2020).
The literature reveals the need for effective training and educational courseware on climate risk that stimulates problem-solving skills. Trainings to strengthen applied climate education and promote problem-solving skills are desirable in stand-alone courses and where climate is an embedded component (George et al., 2016; McBean and Rodgers, 2010; Reid, 2019; Yen et al., 2019). In this paper, we describe the development and delivery of a short-duration face-to-face training based on the IPCC's climate risk framework and PBL. Further, we address the following research questions:
-
(RQ1) Is a training scheme based on PBL and mapping suitable to support students' learnings about the IPCC's climate risk framework?
-
(RQ2) What are observations and learnings from an introductory pilot training on climate risk which is targeting tertiary students and practitioners?
We use Brazil as a case study as the country is already suffering considerable damage and loss associated with climate-induced natural hazards, particularly floods, landslides, droughts, and heatwaves (CEPED UFSC and World Bank, 2016; Nobre et al., 2019). At the same time, there is high demand for climate risk experts (Brazil, 2016) and a considerable number of courses and programmes with the potential to include climate risk management (Cadastro Nacional de Cursos e Instituições de Educação Superior, 2020; Cursos da Pós-Graduação Stricto Sensu no Brasil [2017 a 2020], 2020). We test and evaluate the training scheme based on qualitative observation and self-assessment of the participants of five different groups, including tertiary students and practitioners.
2.1 Training development
Given the need for enhancing learning about climate risk and adaptation for water professionals (George et al., 2006, 2016), the training was initially designed to supplement the existing Water Resources Planning discipline in the Sanitary and Environmental Engineering bachelor course of the Federal University of Santa Catarina (UFSC). The bachelor's course has a minimum duration of 10 semesters and includes basic subjects such as calculus, physics, and chemistry, as well as vocational subjects such as hydraulics, hydrology, and wastewater treatment. The course content is available at UFSC (2014). As new opportunities emerged, the training was delivered to graduate students of the Water Resources Management Master's programme at the State University of São Paulo (UNESP) and practitioners of the Secretary of Sustainable Economic Development of Santa Catarina State (SDE). This provided an excellent opportunity for us to design effective training to enhance student's learnings about climate risk and adaptation.
The theoretical basis underpinning this training is PBL, and the background information used is the IPCC's climate risk framework. The IPCC is the most credible and comprehensive reference regarding climate change (Cooperation with the IPCC, 2021). The IPCC defines climate risk as the combination of climate hazard with the exposure and vulnerability of a receptor (Fig. 1), while vulnerability is comprised by sensitivity and adaptive capacity (IPCC, 2014). Maps representing climate, biophysical, and socioeconomic data are a substantial part of the toolkit for assessing the risks of climate change and are frequently associated with the IPCC's framework (Sherbinin et al., 2019). Mapping is used to identify geographic areas where impacts are expected to be the greatest and, consequently, may require adaptation interventions (Sherbinin et al., 2019). Mapping promotes the development of interpretation of data and teamwork skills (Sherbinin et al., 2019; Yen et al., 2019). At the same time, visualization in the form of a map improves understanding of how climate change interacts with society, raising awareness about the relevance of the issue (Preston et al., 2011). It complements adult learning theory, where there is preference for problem-solving and building on experiences (George et al., 2016).
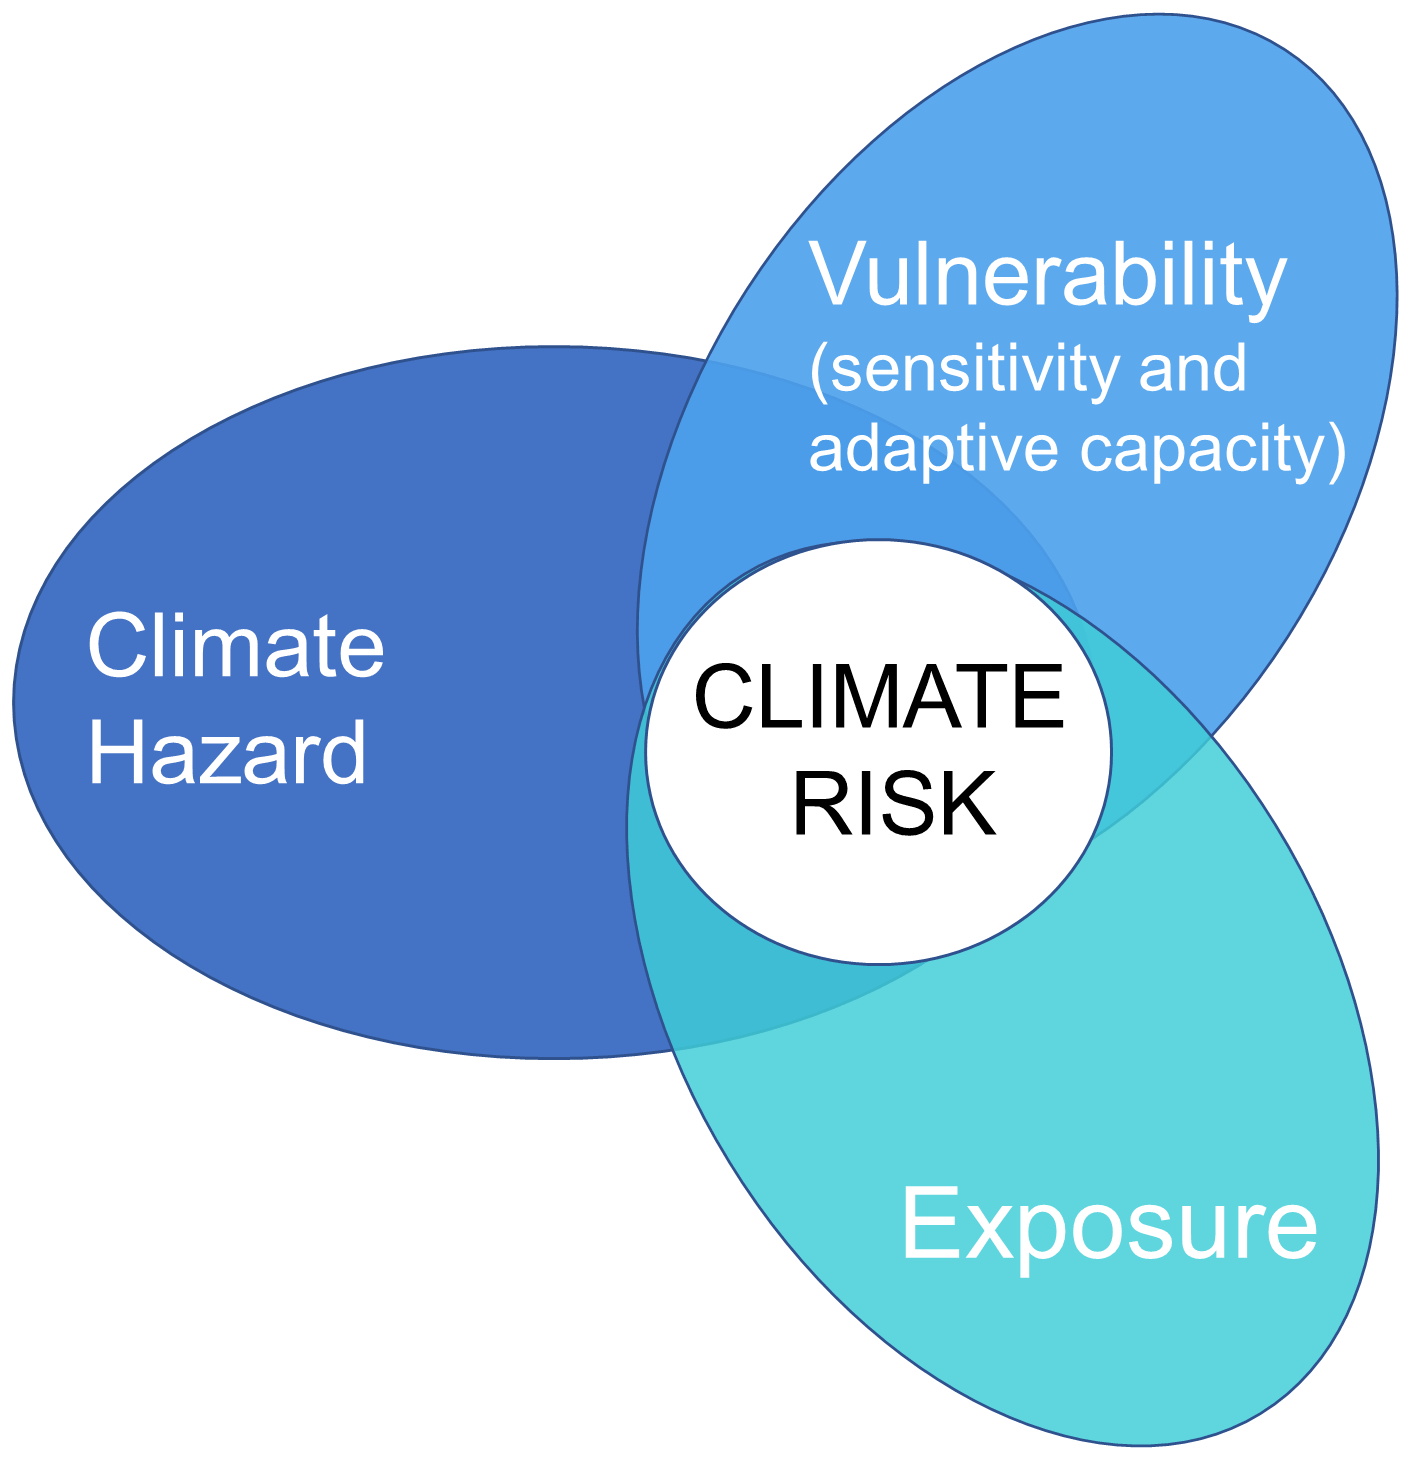
Figure 1IPCC's conceptual framework of climate risk (adapted from IPCC, 2014).
2.2 Training delivery
The main goal of the training is to enhance learning about climate risk and adaptation and its connection to water planning. The intended learning outcomes are as follows:
-
Explain the IPCC's climate risk framework and differentiate its components.
-
Associate socioeconomic, biophysical, and climate data with the climate risk components.
-
Map climate risk and classify risk zones.
-
Assess adaptation options.
-
Communicate via presentation the outcomes and the limitations regarding data sufficiency.
The learning outcomes are designed to improve competence in climate and water planning skills, i.e. interpretation of data, creativity, teamwork, communication, and critical thinking, by constructing knowledge from experiences (Kolb, 2015). Educational material (available in the Supplement) in the form of courseware includes the following:
-
a slide show presentation to introduce the IPCC's climate risk framework (Supplement 1);
-
a set of maps for participants (Supplement 2);
-
a facilitation script for trainers, including cues to assist the delivery of the training sessions (Supplement 3).
The training lasts 120 min and is divided into five sessions (Fig. 2), which are associated with the intended learning outcomes. The following subsections describe the training sessions in detail.
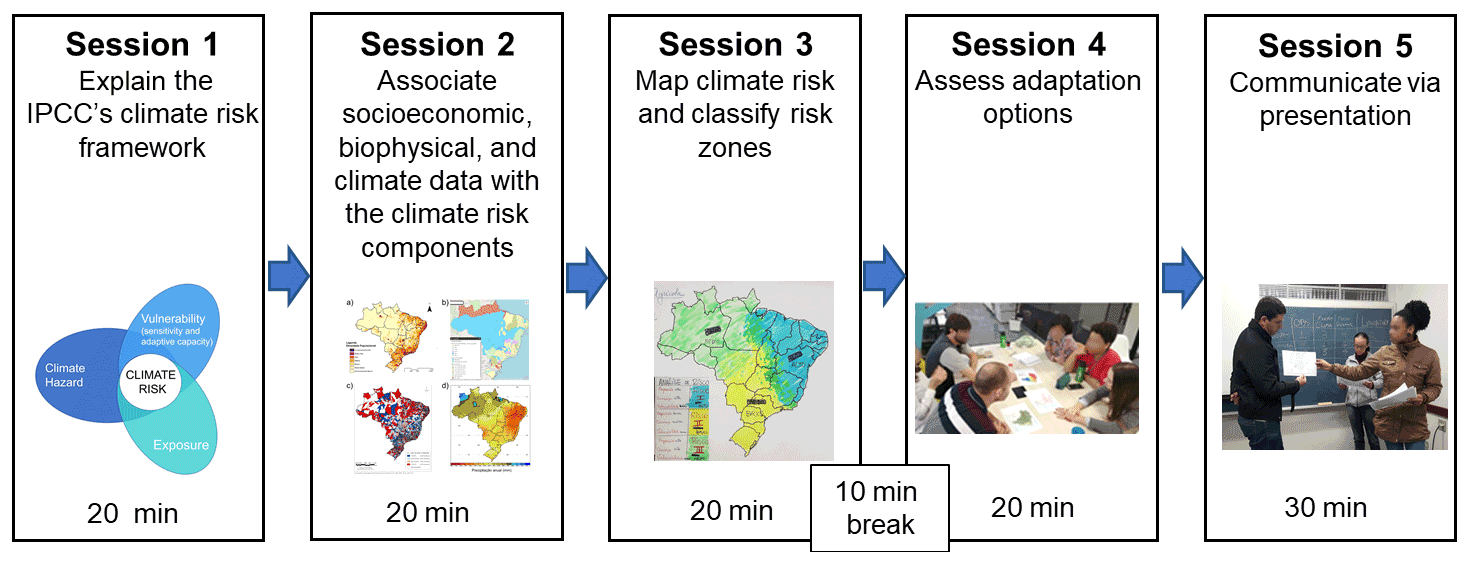
Figure 2Scheme of the training sessions (adapted from IPCC, 2014; MMA, 2017; Planos de Recursos Hídricos, 2020; Brasil, 2017; Normais climatológicas do Brasil, 2020).
2.2.1 Session 1: Explain the IPCC's climate risk framework
The learning goal of this session is to introduce the IPCC and its climate risk framework. With the support of the slide show presentation, the trainer presents the IPCC and its climate risk framework (IPCC, 2014). The session, in the form of an expository lecture, is complemented by an interactive exercise to reinforce the learning outcome and demonstrate competency. A flood impact case is drawn on the blackboard, and participants must answer questions about the components of risk (Fig. 3). The participants are asked to point out the climate hazard, the most exposed element in the scene, the most sensitive, and the most capable to adapt. The session takes 20 min.
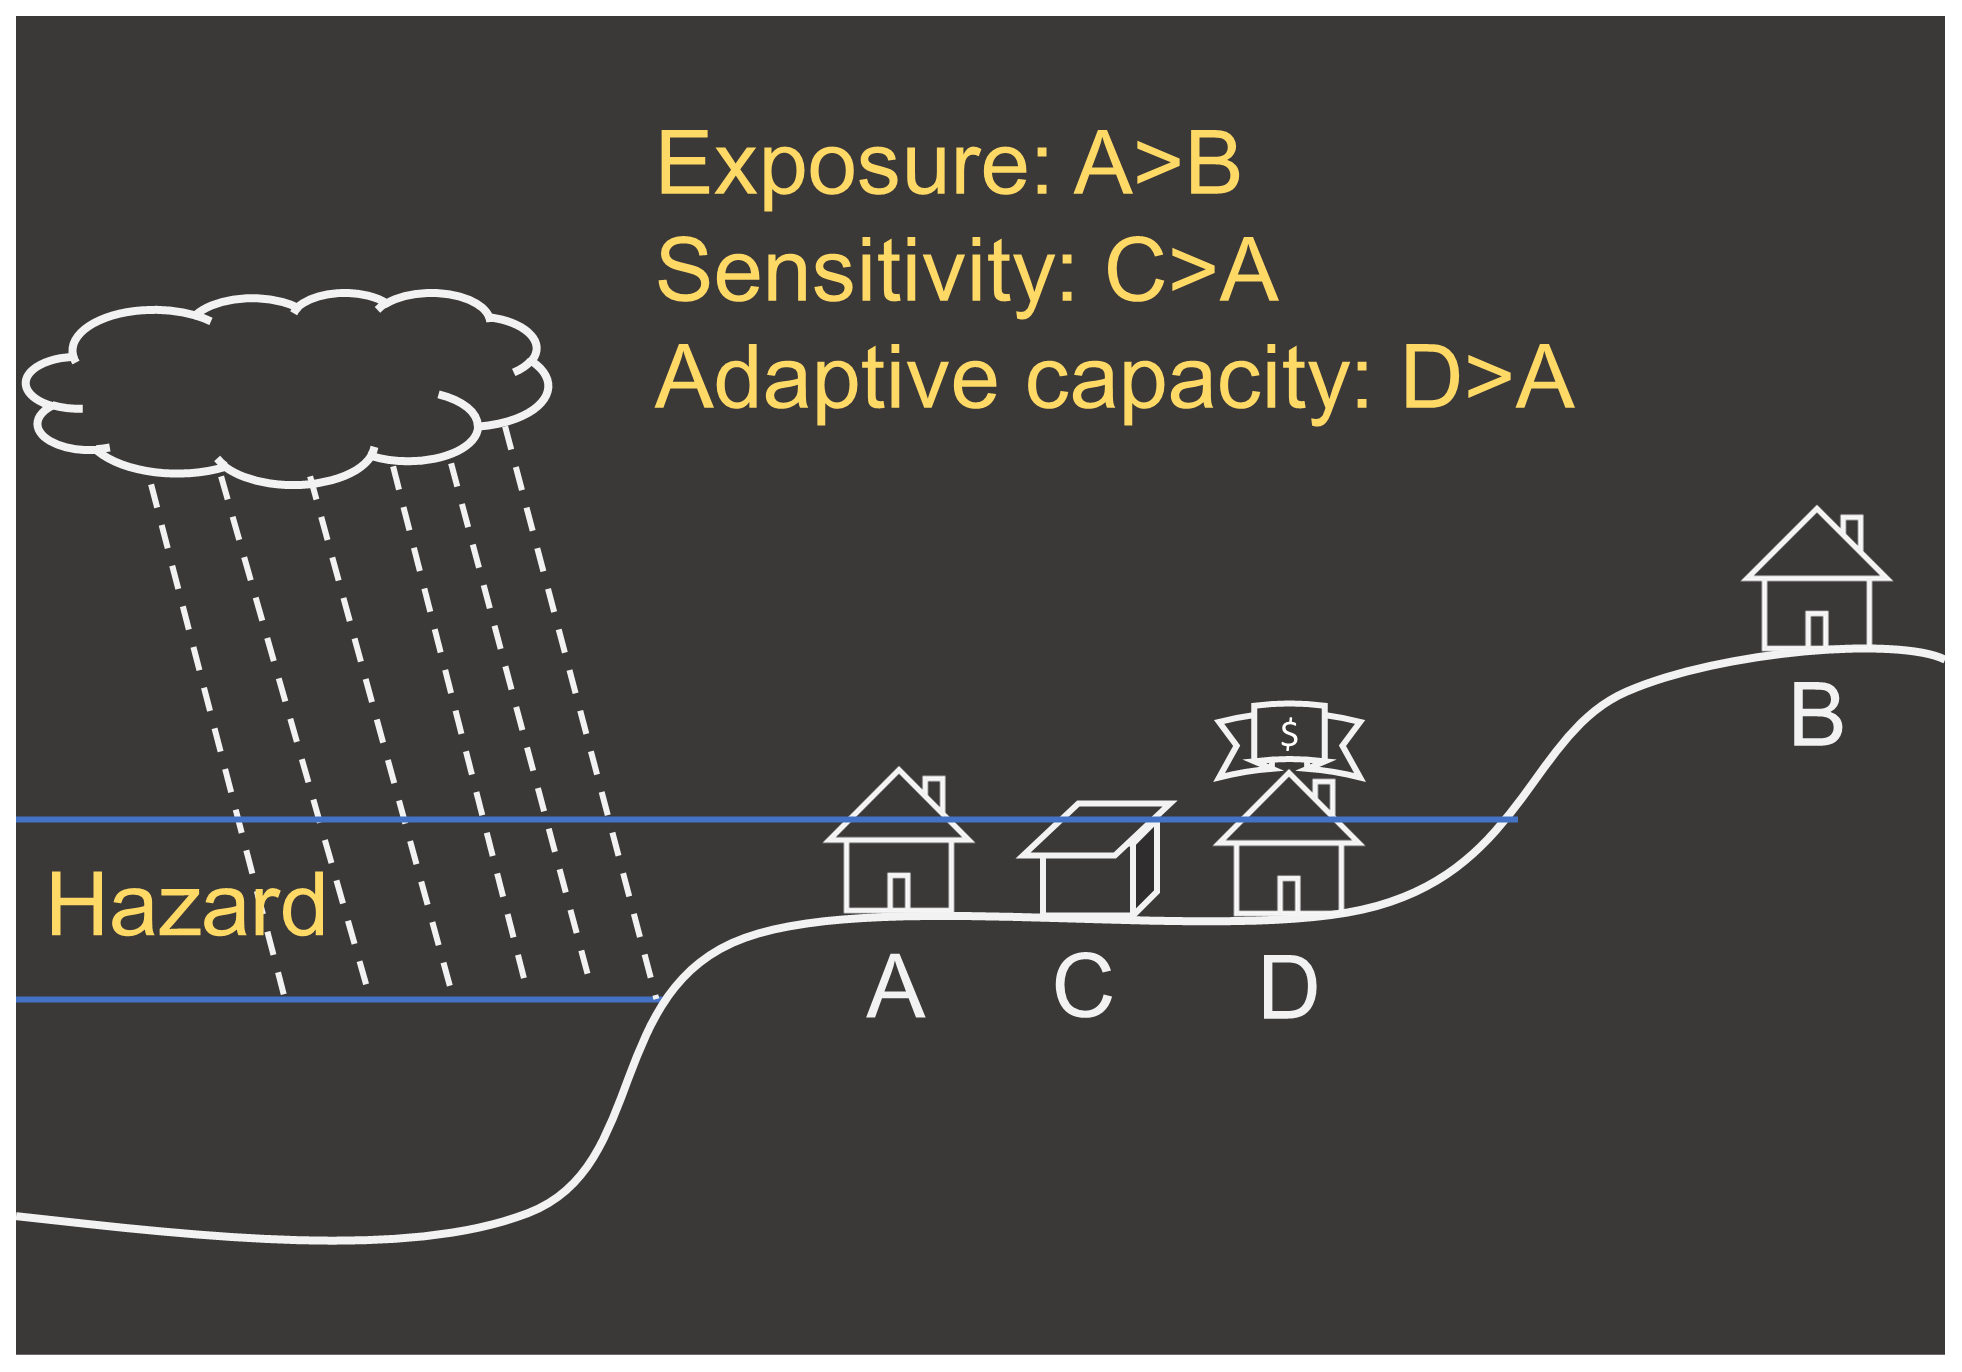
Figure 3Example of a classroom blackboard used to illustrate the climate risk exercise. Given a flood situation, house A is more exposed than house B; the wooden house C is more sensitive than the brick house A; the house with insurance D has a higher adaptive capacity than a house without insurance. The blue line indicates different flood levels. The definitions of climate hazard, exposure, sensitivity, and adaptive capacity are based on the IPCC climate risk framework.
2.2.2 Session 2: Associate socioeconomic, biophysical, and climate data with the climate risk components
The learning goal of this session is to interpret socioeconomic, biophysical, and climate data in the form of maps and associate them with the climate risk components. This and the following sessions are based on PBL pedagogy and apply the IPCC's climate risk framework to a fictional situation using mapping. The training simulates a situation where the federal government requests a consultancy service to (i) identify areas in Brazil with significant climate risk and (ii) assess adaptation options to reduce the risk. Climate risk assessment for several sectors is a real demand of the Brazilian federal government, foreseen in the Brazilian National Plan for Climate Change Adaptation – NAP (Brazil, 2016). Since the focus is on water planning, the top four climate impact types according to the Brazilian NAP were considered: floods, landslides, water scarcity, and agricultural droughts.
The PBL pedagogy recommends small working groups (Prince, 2004; Wood, 2003); thus, each working group has three to six members and addresses one type of impact. Each working group receives a set of four maps illustrating socioeconomic, biophysical, and climate data. Figure 4 shows the set of maps associated with water scarcity, which is an example of the database that working groups use to assess climate risks and adaptation options.
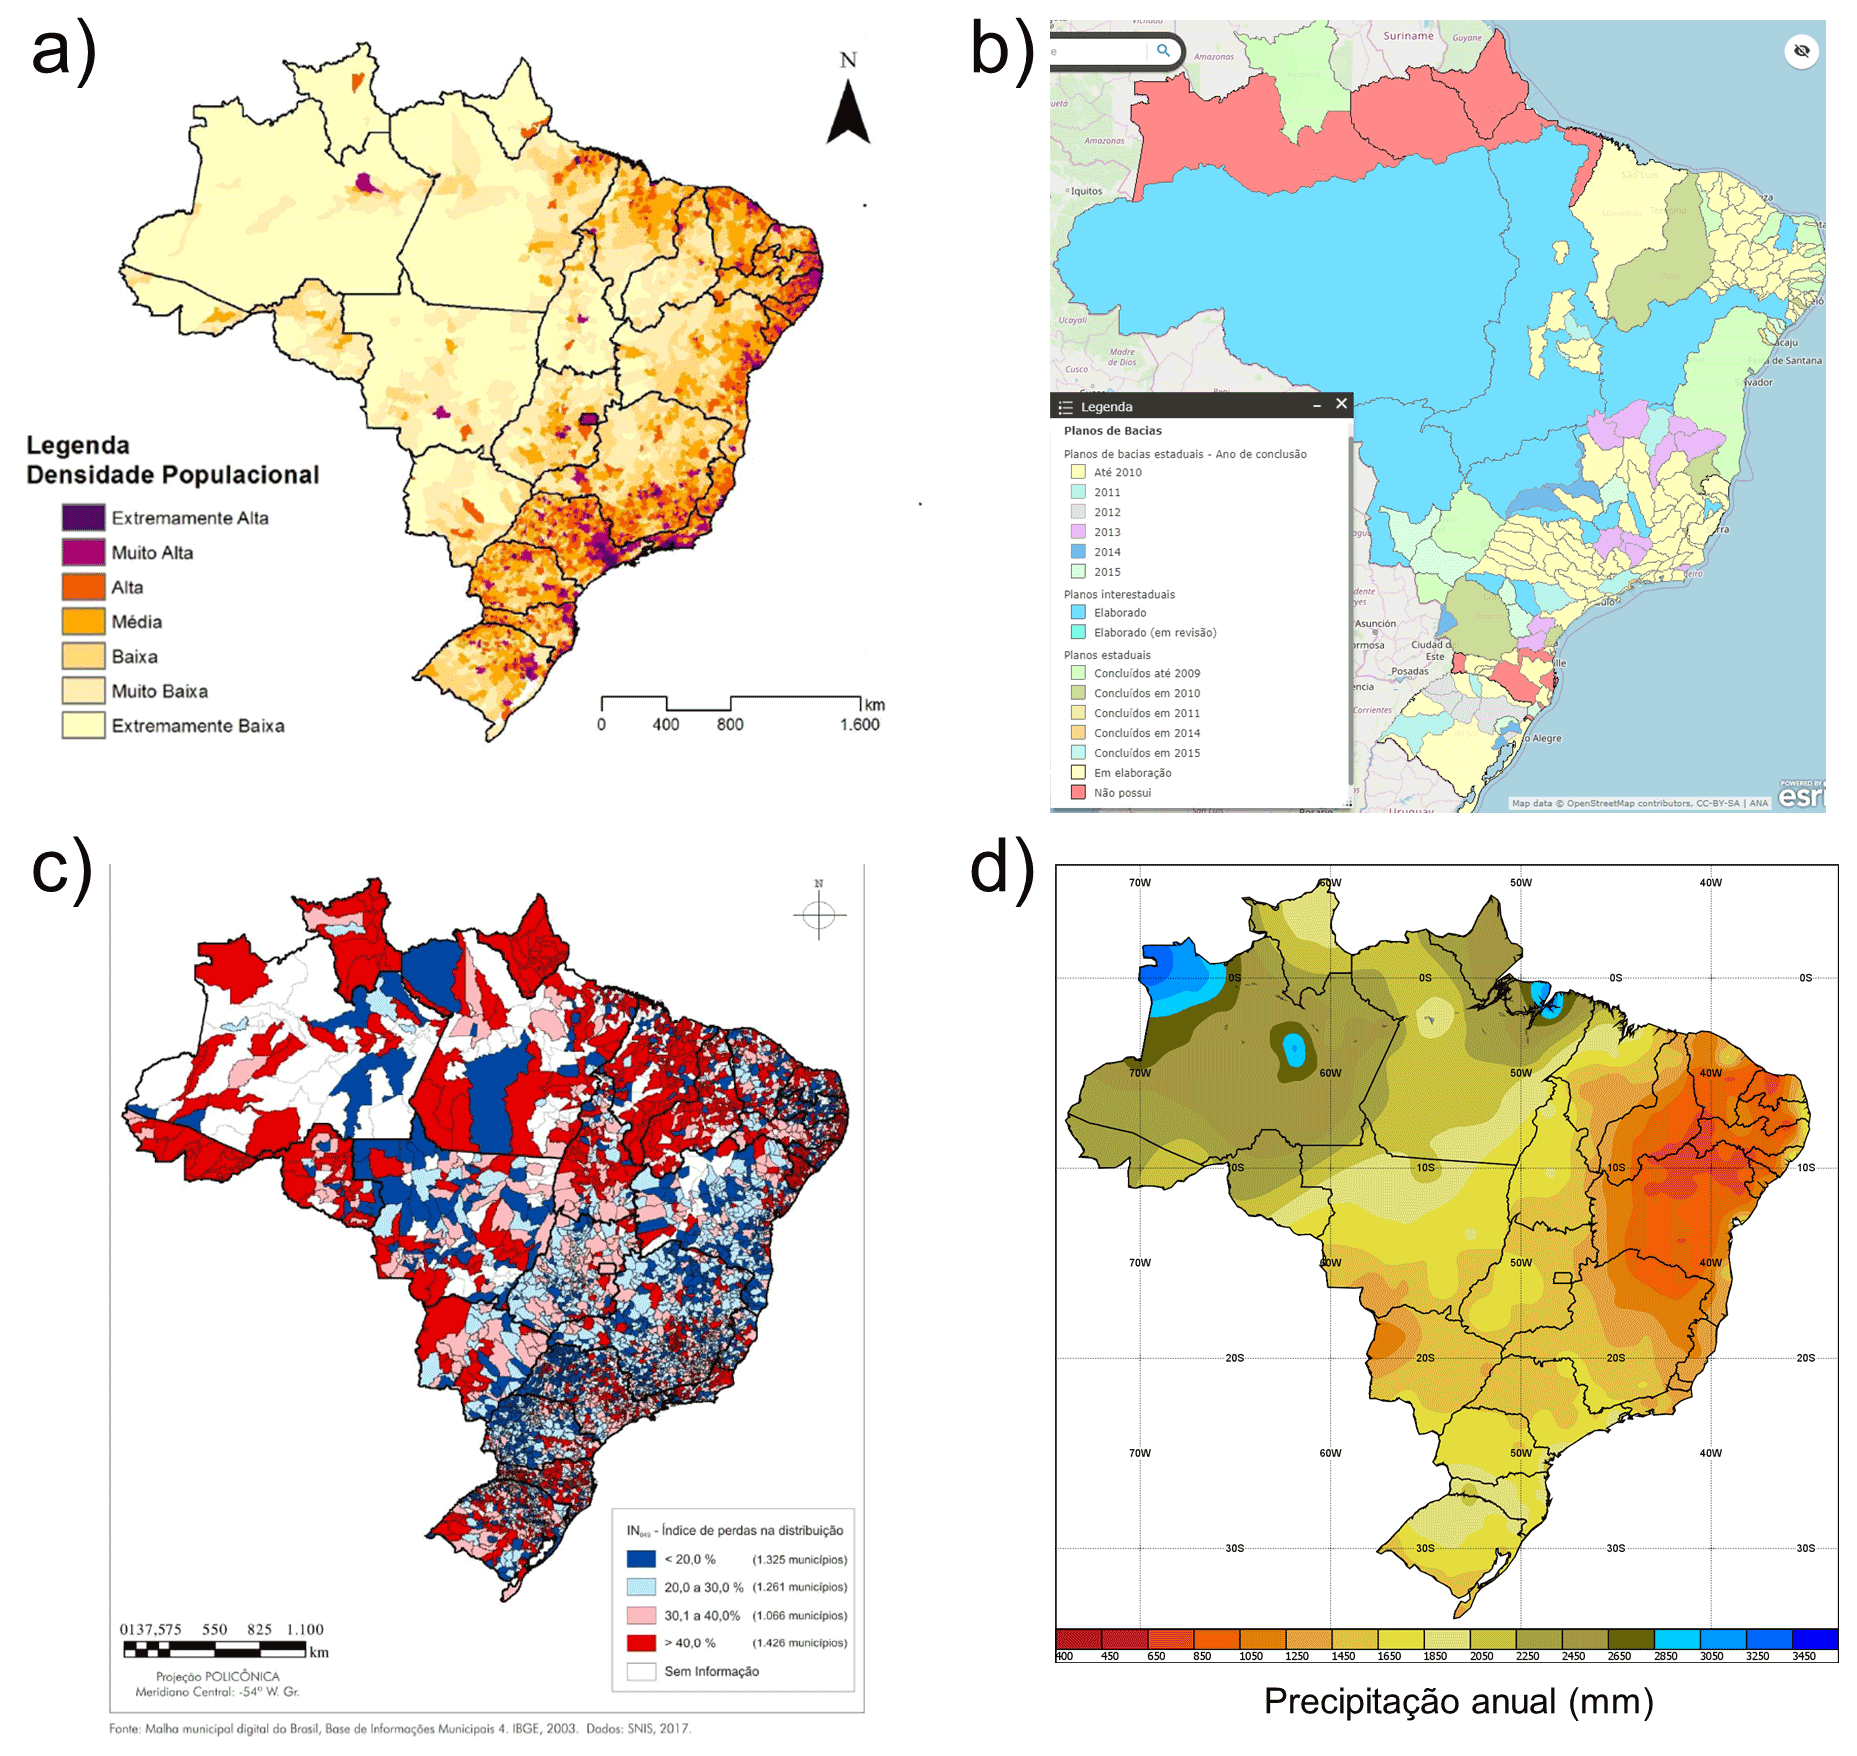
Figure 4Example of a map collection used for mapping climate risk associated with water scarcity. The maps illustrate (a) population density (MMA, 2017), (b) stage of implementation of the water resources planning (Planos de Recursos Hídricos, 2020), (c) water distribution loss index (Brasil, 2017), and (d) annual rainfall (Normais climatológicas do Brasil, 2020).
In this session, participants classify the maps into (i) climate hazard, (ii) exposure, (iii) sensitivity, or (iv) adaptive capacity. The trainer assists the working groups in understanding the tasks and learning goals of the sessions. In this specific session, it is important to ensure that the working groups correctly interpret the maps (e.g. theme, legend, and caption) and understand how these data are associated with the IPCC's climate risk components. This session lasts 20 min.
2.2.3 Session 3: Map climate risk and classify risk zones
The learning goal of this session is to map climate risk and classify risk zones. Since climate risk is the combination of climate hazard, exposure, sensitivity, and adaptive capacity, participants estimate risk by overlapping the maps illustrating socioeconomic, biophysical, and climate data. Each working group receives a blank map of Brazil, where they are asked to illustrate risk zones. From the second training onwards, we informed participants about the possibility of using a scale of risk (e.g. low, medium, and high). This session lasts 20 min.
2.2.4 Session 4: Assess adaptation options
The learning goal is to understand how risk can be reduced and thus assess adaptation options. The participants discuss the factors that most affect the level of risk and, based on them, propose actions to reduce the risk. Participants should focus on the data they received and reflect on the government's role in climate change adaptation (e.g. delimiting occupation areas, implementing water resource planning, and reducing water distribution losses). This activity lasts approximately 20 min.
2.2.5 Session 5: Communicate via presentation
The learning goal is to communicate via presentation the outcomes of the previous sessions, as well as the limitations regarding data sufficiency. Group presentation is an essential part of the PBL process and is an opportunity to assess the participants' performance, in particular in terms of the acquisition of abilities in problem-solving and professional competence (Macdonald and Savin-Baden, 2004). From the second training onwards, we provided instructions towards a more focused presentation. The participants begin by presenting the classification of the maps and the reasons behind their choice. Next, they present the climate risk map and the criteria adopted for the definition of risk areas. In the end, the working group presents the adaptation options and discusses the data they received, including relevant missing data that could improve the analysis. Each working group has 5 min to present the results and ∼ 3 min to answer questions from peers.
2.3 Methods of evaluation
Numerous forms of assessment have been proven to be successful in PBL, ranging from group presentations, self-assessment, and written reports to non-traditional methods, such as tripartite assessment (Lyon and Teutschbein, 2011; Macdonald and Savin-Baden, 2004). Given the short duration of the training and the objective of this case study, which is to develop an effective and motivating training scheme, we use qualitative observation (Katz-Buonincontro and Anderson, 2018; Grove et al., 2013) and self-assessment of knowledge of the participants (Andrade, 2019; Boud, 1995).
Qualitative observation is a way to assess what students do (Grove et al., 2013). It provides rich and in-depth descriptions of classroom practices and is useful for identifying limitations of training schemes and educational courseware (Grove et al., 2013; Lindorff and Sammons, 2018). In this case study, the goal of the qualitative observation is to assess the suitability of the training scheme and the educational courseware in supporting students' learning about climate risk and to promote the practice of problem-solving skills (RQ1). Annotations include the demonstration of knowledge acquisition and skills by the participants, as well as feedback and misunderstandings that may require courseware improvements (RQ2).
Self-assessment is the process by which the participants reflect on their learning (Andrade, 2019; Boud, 1995). It is an important aspect of learning and one of the most important skills for professional development (Boud, 1995; Lyon and Teutschbein, 2011; Macdonald and Savin-Baden, 2004). However, the results from self-assessments should be carefully interpreted. Participants tend to overestimate their competence, which may lead to unreliable estimations of knowledge acquisition (Andrade, 2019; Kruger and Dunning, 1999; Macdonald and Savin-Baden, 2004; Strobl et al., 2020). On the other hand, self-assessment can increase the interest and motivation of participants for the subject and support them in developing critical skills for analysis of their work and performance (Andrade, 2019; Boud, 1995), which are aligned with the PBL principles (Macdonald and Savin-Baden, 2004). In this case study, the self-assessment comprises a simple survey distributed before and after the training sessions, where participants had to rate their level of knowledge about climate risk on a scale ranging from “nothing” to “a lot”. The self-assessment was applied in training 2 and 3. Assessing the participants' perception of knowledge acquisition helps to answer RQ1.
3.1 Training development
The training courseware was developed along with its delivery to five independent groups in Brazil from 2018 to 2019 and reached 94 higher education students and practitioners. Three groups are composed of undergraduate students of the Water Resources Planning discipline of the Sanitary and Environmental Engineering bachelor course at UFSC. One group consists of graduate students of the Water Resources Management Master's programme at the UNESP. The last group consists of practitioners of the SDE. Figure 5 shows the timeline of training and the background information, i.e. the institution, the number and the profile of participants, the duration of the training, the training modules, and the documentation available. In some trainings, the content can be extended if time is available. In the third training, for example, we added introductory lectures on climate change and climate information, as well as climate scenarios in the climate risk mapping session. In the fifth training, we included an interactive lecture to introduce the scientific basis of climate change.
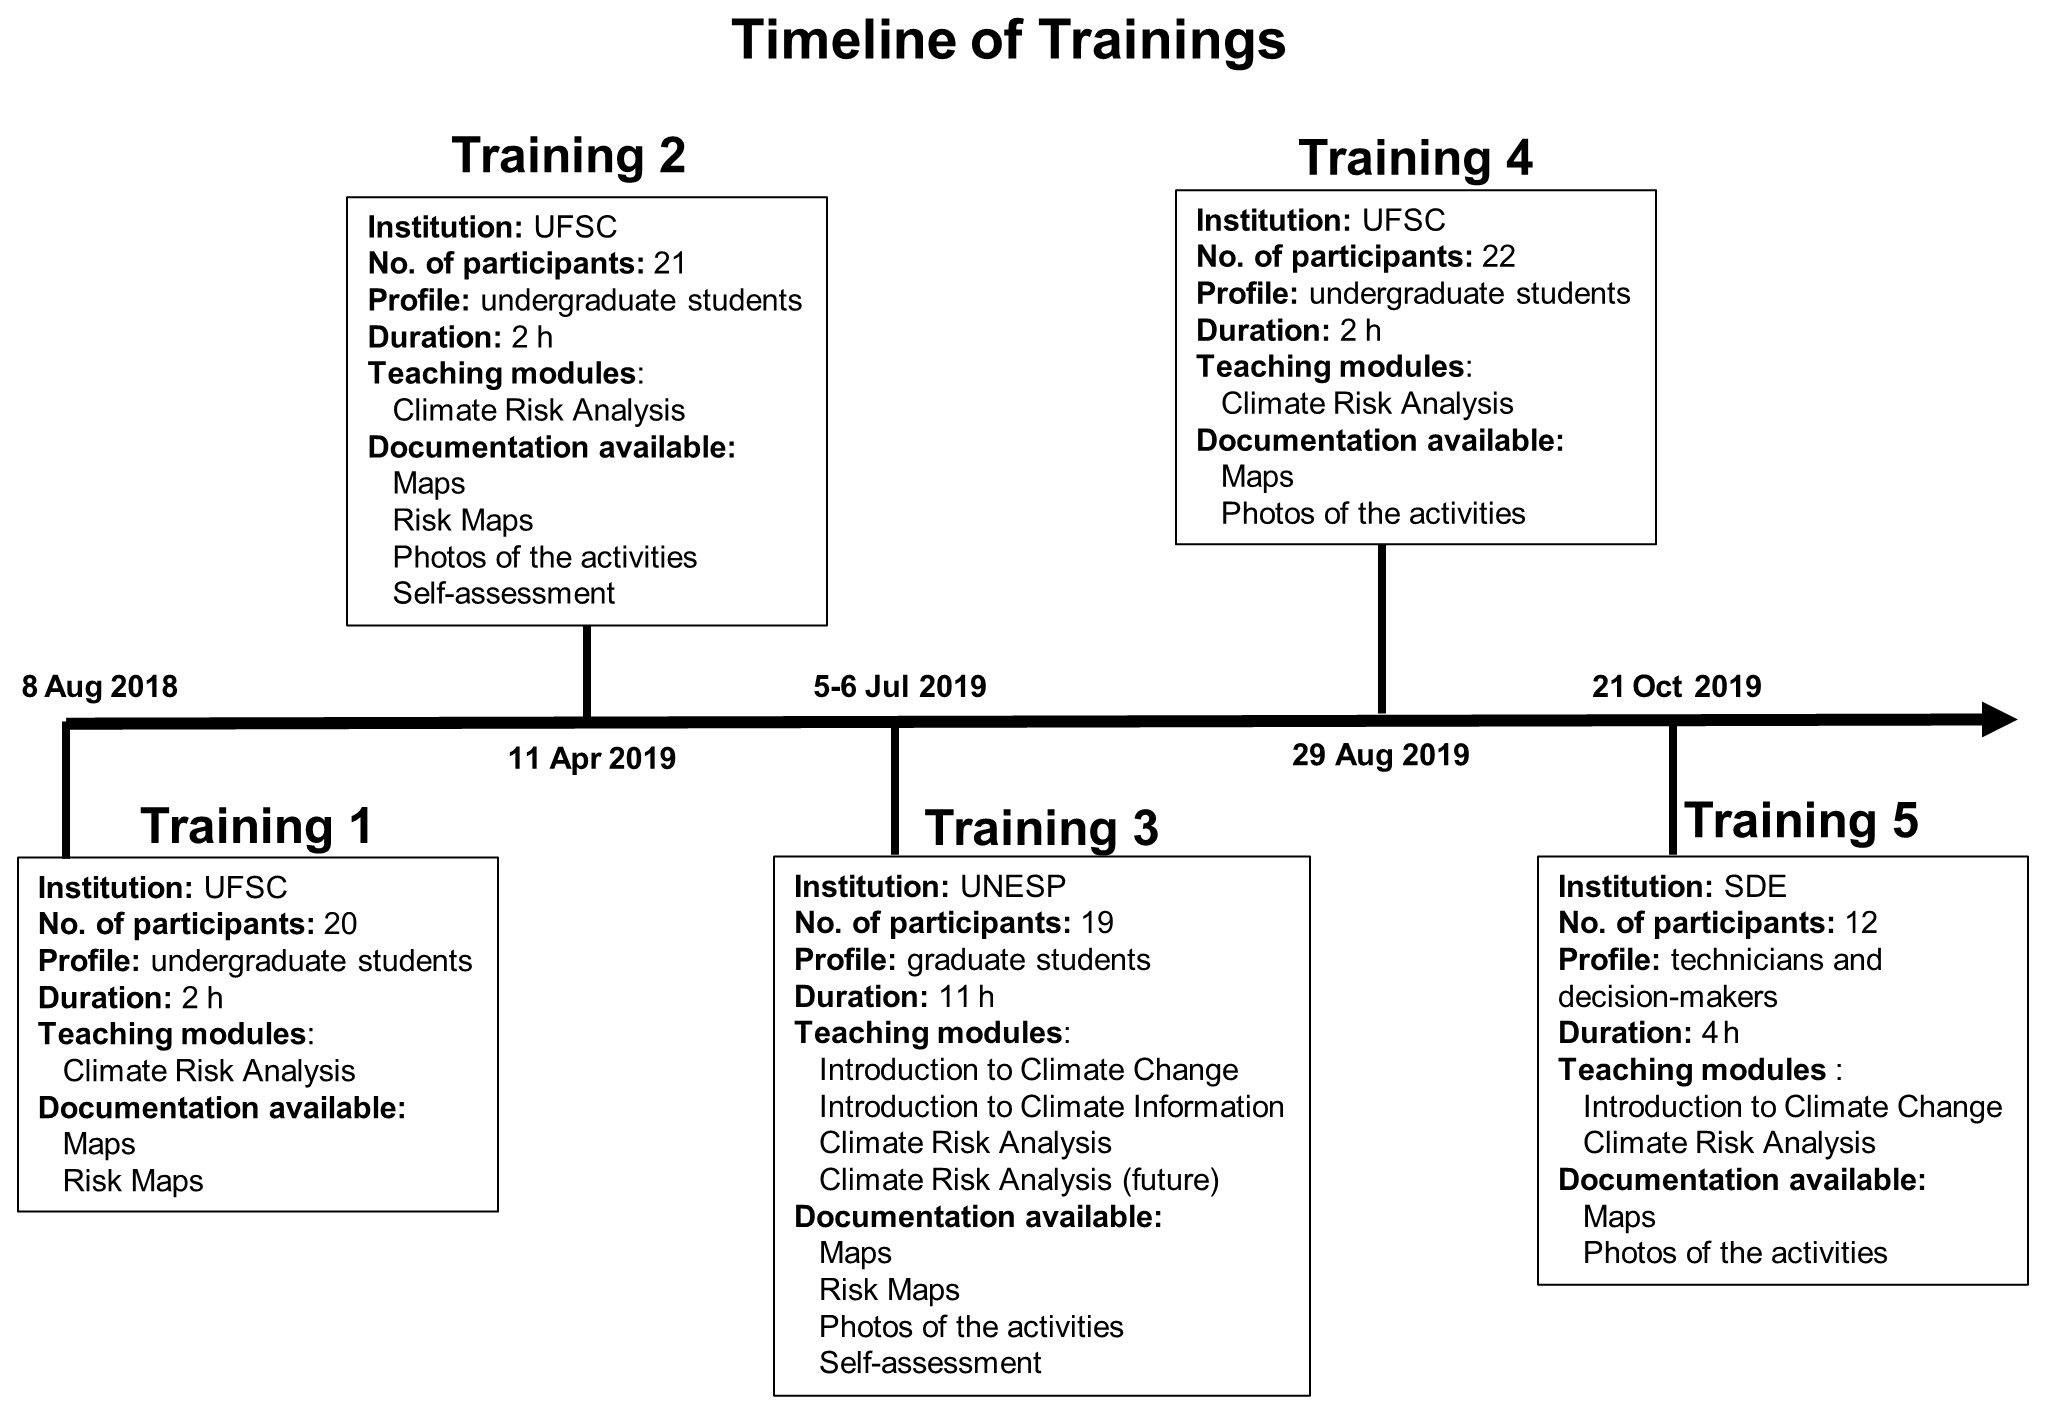
Figure 5Description of the five trainings delivered during 2018 and 2019. Training 1, 2, and 4 addressed undergraduate students from UFSC; training 3 comprised graduate students from UNESP; training 5 was made up of practitioners from the SDE.
3.2 Training delivery
3.2.1 Session 1: Explain the IPCC's climate risk framework
In general, it was observed that the participants from all groups could answer the questions correctly, suggesting that the expository lecture complemented by an interactive exercise was useful for introducing the IPCC's climate risk framework and its elements.
3.2.2 Session 2: Associate socioeconomic, biophysical, and climate data with the climate risk components
The participants were familiar with maps illustrating socioeconomic and biophysical data, but they had difficulties interpreting some climatology maps. The participants' queries were mainly about climate indices, such as the maximum number of consecutive dry days, and they were answered by the trainers during the session. Overall, the participants were able to classify the maps satisfactorily, especially for adaptive capacity, demonstrating that the students gained knowledge about the IPCC's climate risk framework (RQ1). It was noticed that students practised the interpretation of data (RQ2). Difficulties emerged when classifying exposure, which is the most difficult aspect to be classified while mapping (Sherbinin et al., 2019). Exposure is the geographic location of a receptor, or a system, in relation to the climate hazard (IPCC, 2014). In mapping, to estimate exposure, it is necessary to combine the spatial distribution of the receptor with the spatial distribution of the climate hazard (Sherbinin et al., 2019).
3.2.3 Session 3: Map climate risk and classify risk zones
The working groups proposed several types of climate risk maps (Fig. 6). In the first training, the risk maps (Fig. 6a, d) were much simpler than in later applications (Fig. 6b, c, e, f). From the second training onwards, the participants were explicitly informed about the possibility of using a scale of risk (e.g. low, medium, and high), resulting in more sophisticated outcomes in the second and third trainings than those of the first group. In the second and third training, the working groups in charge of landslides were able to differentiate the levels of risk, with detailed risk zoning (Fig. 6b and c). For agricultural droughts, the working groups included a weighting scheme, similar to a multi-criteria analysis (Fig. 6e and f). The complete lists of outcomes from all five trainings, as well as the maps provided as input for the mapping activity, are available in Appendix A. All working groups were able to map climate risk zones, confirming the usefulness of the educational courseware for enhancing learning about the IPCC's climate risk framework (RQ1). The classroom observations suggest that this session promotes teamwork and creativity (RQ2). There were intense discussions between the participants and decisions were based on the working group consensus. At the same time, the outcomes of the working groups were very diverse (e.g. Fig. 6), which is an indicator of creativity (Katz-Buonincontro and Anderson, 2018).
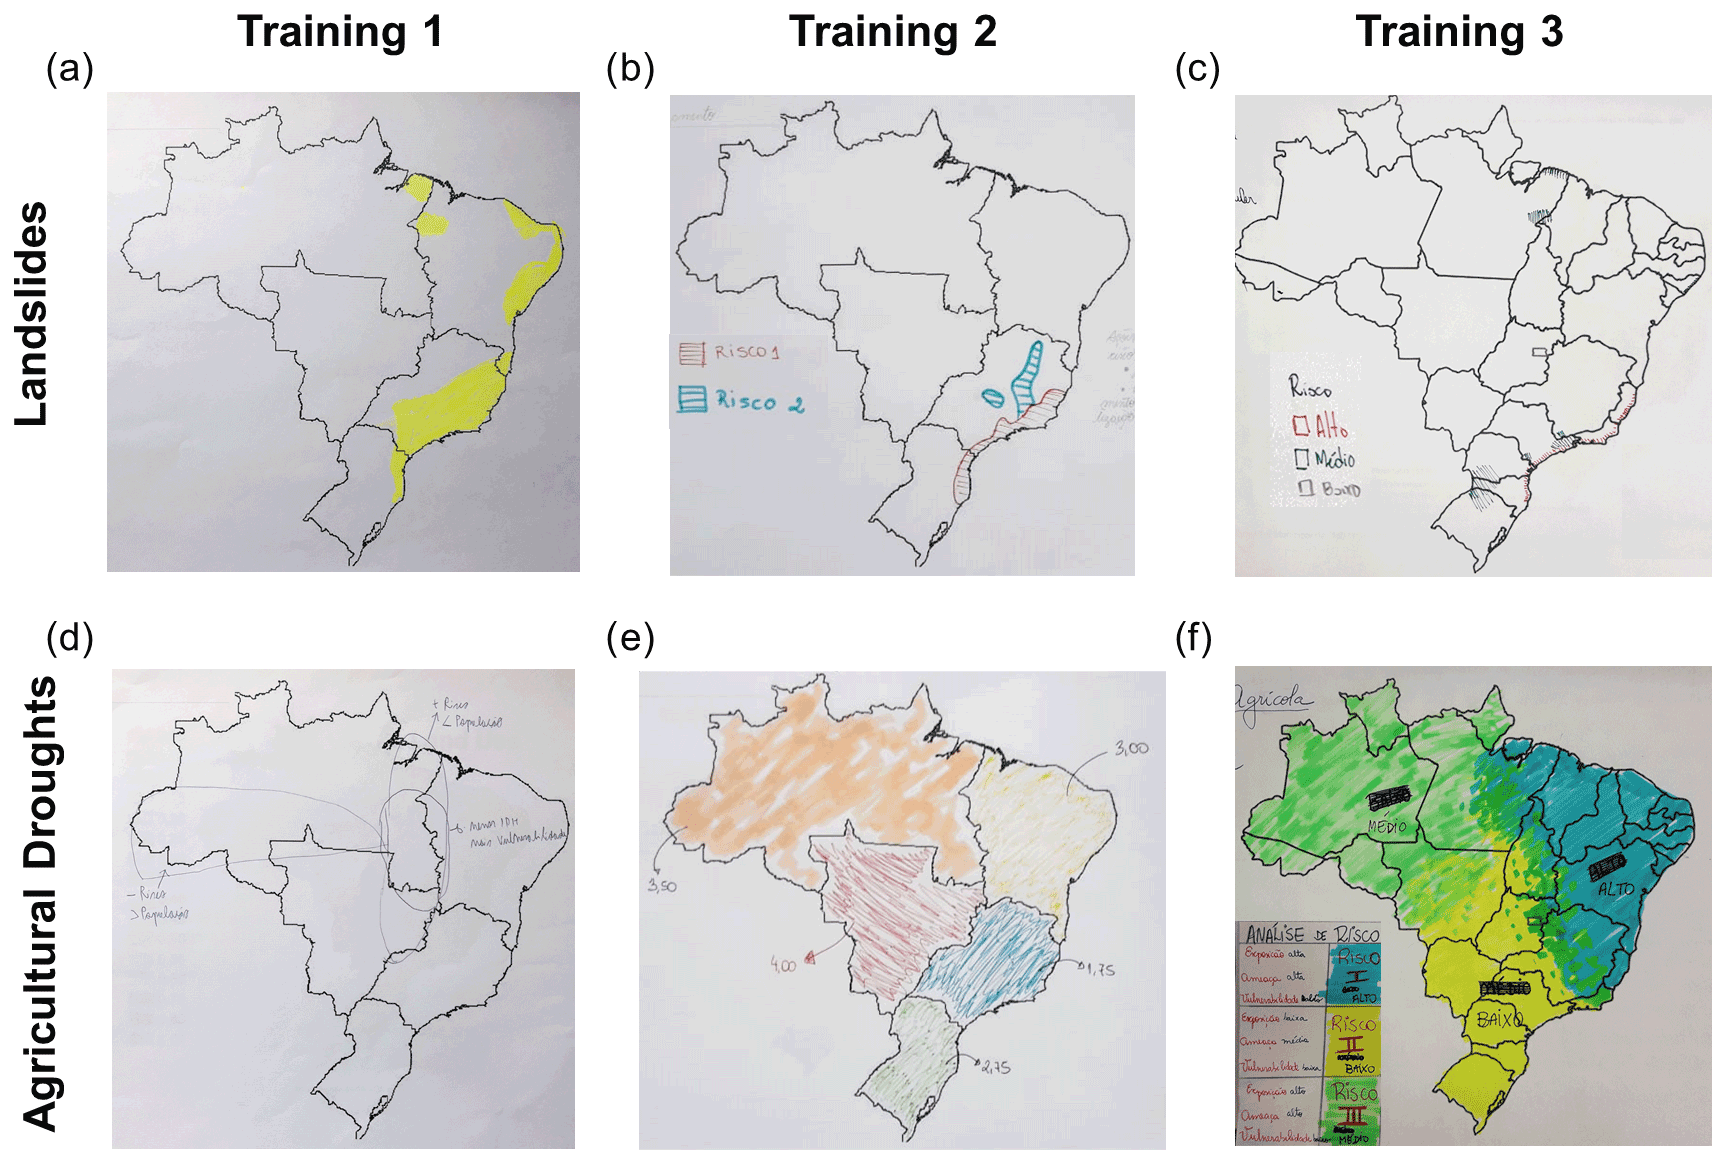
Figure 6Outcomes from the climate risk mapping for landslides and agricultural droughts working groups (rows) from three trainings (columns).
3.2.4 Session 4: Assess adaptation options
In many cases, the proposed adaptation options were satisfactory. For example, in the first training, the working group responsible for the flood case proposed increasing adaptive capacity by enhancing education as a means to reduce illiteracy (a map provided as input). For landslides, all working groups suggested reducing exposure by zoning areas of non-human occupation. In some cases, the working groups presented adaptation options based on their personal beliefs rather than on the evidence provided by the data given (i.e. the set of maps). The results suggest this session enhances knowledge about the usefulness of the IPCC's climate risk framework for climate change adaption (RQ2). At the same time, it promotes the practice of critical thinking (RQ2), by identifying the limitations of their work and proposing additional data needed.
3.2.5 Session 5: Communicate via presentation
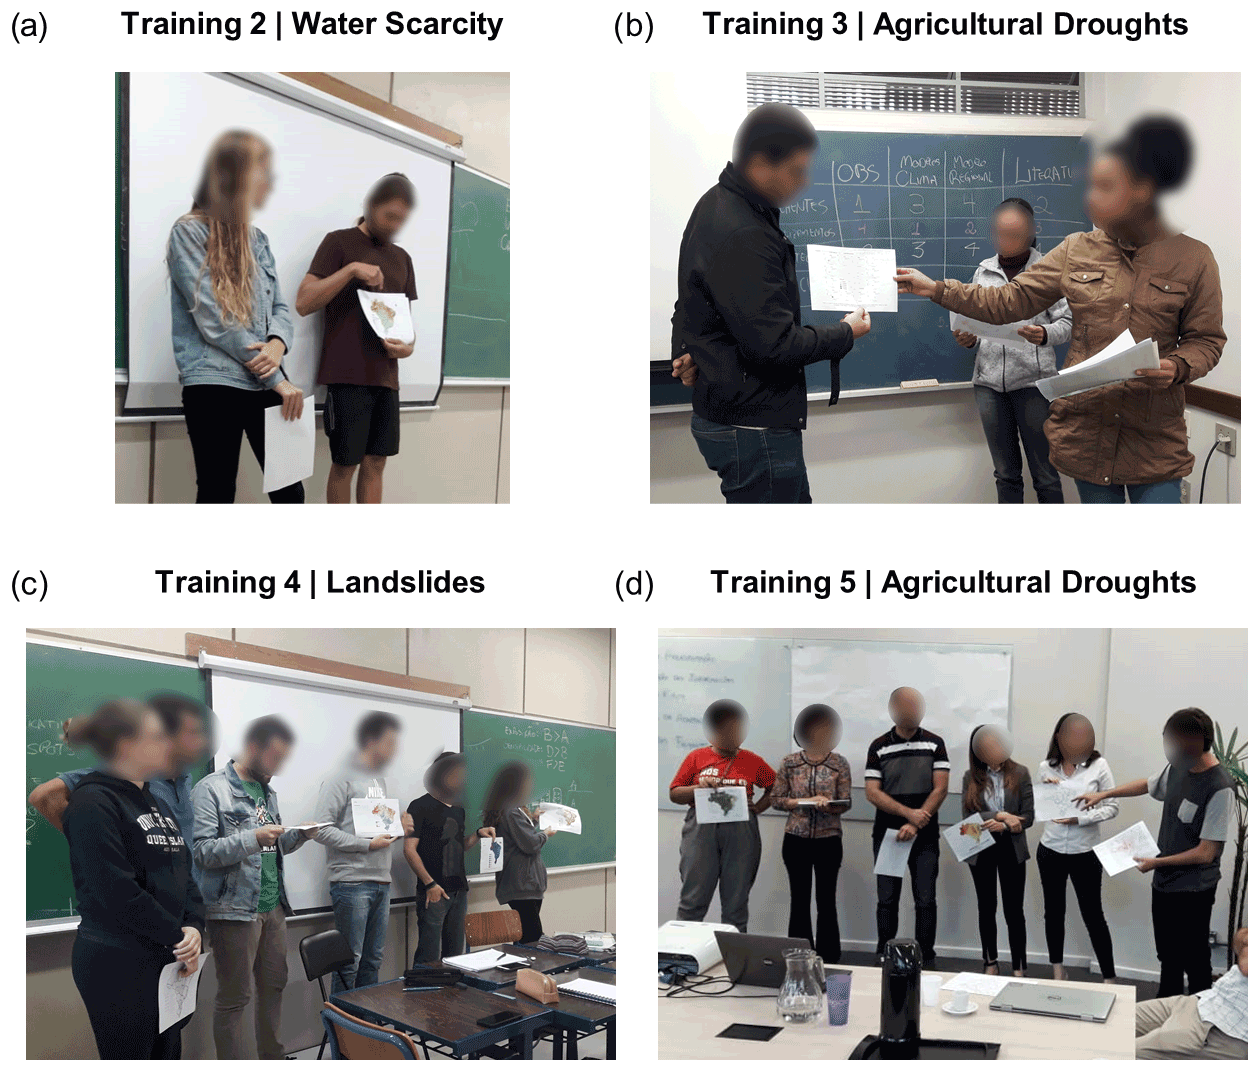
The group presentations were satisfactory and demonstrated that the participants understood the principles of the IPCC's climate risk framework (RQ1). After instructions towards a more focused presentation (following the order of the sessions), the participants were able to communicate their results in a clear and consistent fashion (RQ2). Presentations were generally made by more than one working group member (Fig. 7), a decision that demonstrates teamwork (RQ2).
3.2.6 Participants' perception of knowledge acquisition
To estimate the effect of the training on the participants' perception of knowledge change, a simple self-assessment before and after training sessions was applied. Figure 8 illustrates the students' self-rating in training 2 and 3. In both trainings, participants' self-rated scores before and after training rose from “nothing” to “medium” or “a lot”. The self-assessment results demonstrate that the proposed training scheme, based on PBL and mapping, was adequate to support participants' learnings about the IPCC's climate risk framework (RQ1). It was clear that the participants perceived a significant level of knowledge gain (Fig. 8), and the training produced a considerable level of satisfaction and motivation, an expected outcome from active learning (George et al., 2016; Lyon et al., 2013; Prince, 2004; Valaitis et al., 2005; Wood, 2003). Indeed, the practical sessions, the teamwork environment, and the self-assessment were positively recognized. One student of the fourth training said: “I really liked the practical part. I think the concepts were very clear to me after that and it was really nice to discuss in groups those maps.”. In the third training, one student said: “Thanks for the training. It was the first time I had the opportunity to work with my classmates.”. In the second training, one student said: “Very didactic, and I really liked that activity of marking our level of knowledge about the subject before and after the activity.”.
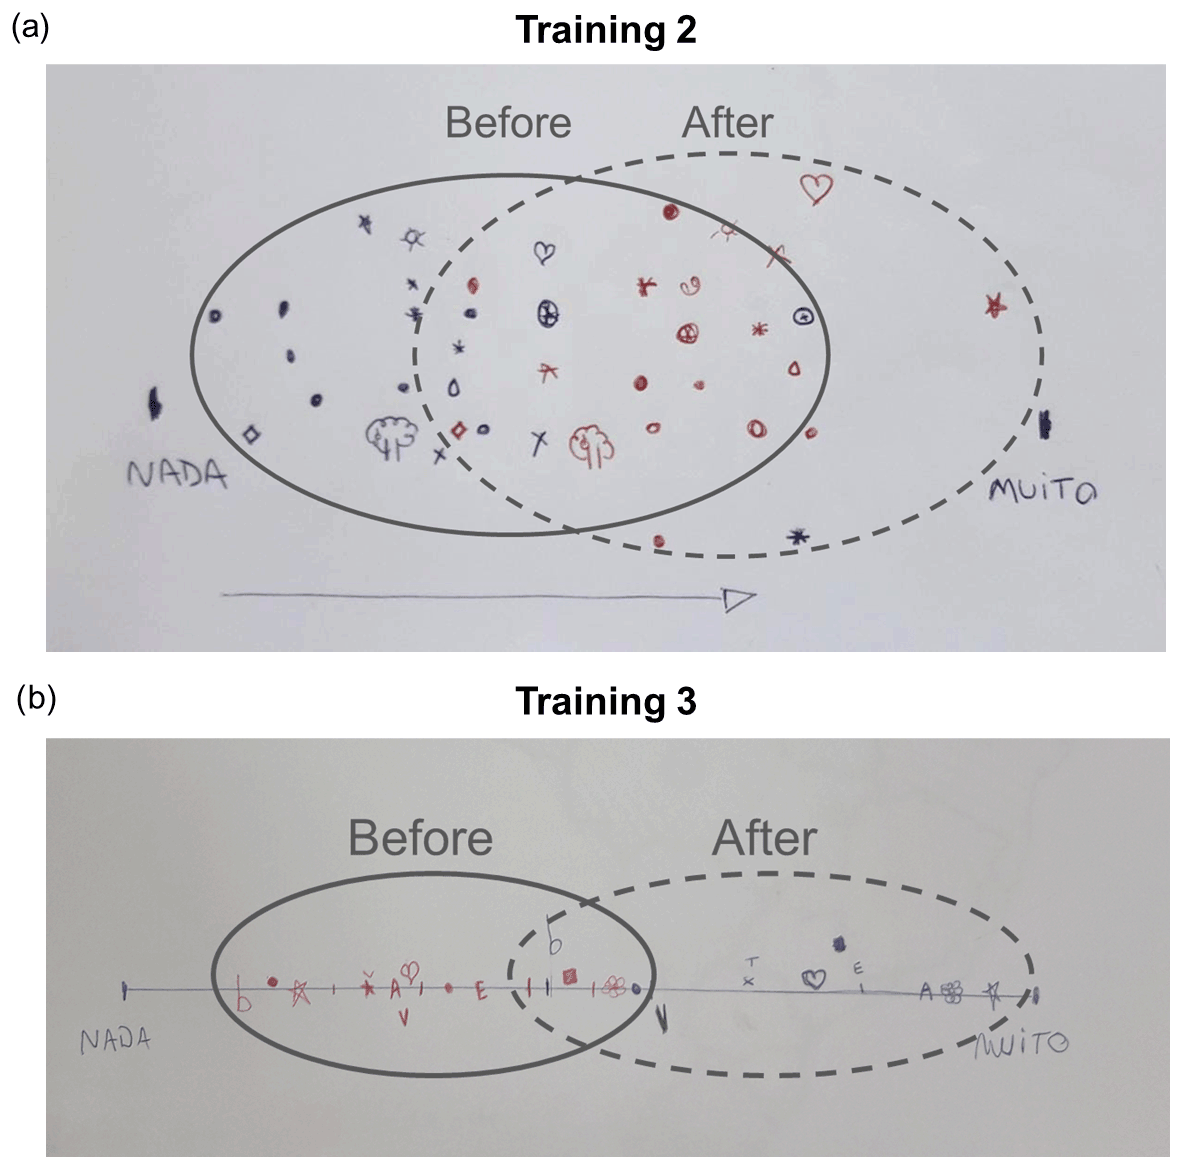
Figure 8Charts illustrating the participants' knowledge levels before and after training sessions for (a) training 2 and (b) training 3. Each symbol corresponds to a participant. The scale ranges from “nothing” (left side) to “a lot” (right side). The circle with a continuous line encompasses the self-rated scores before the training sessions, whereas the circle with a dashed line embraces the self-rated scores after the training sessions.
The most significant findings of this research are as follows:
-
Training based on the PBL and mapping can be used to support students' learnings about the IPCC's climate risk framework. The training produced high levels of satisfaction, and the participants perceived a gain in knowledge (RQ1).
-
Training based on the PBL, mapping, and the IPCC's climate risk framework fosters the practice of interpretation of data, creativity, teamwork, communication, and critical thinking (RQ2).
-
The delivery of the training to five different groups provided several lessons learned and, consequently, improved the training and the educational courseware (RQ2).
This will now be discussed further concerning pedagogical skills, the benefits of using PBL in climate risk training, limitations of the training, and application of the concept of climate risk by water professionals.
4.1 Pedagogical skills
Active learning requires a profound and comprehensive factual knowledge about the target topic (George et al., 2009; Prince, 2004). In this case study, both trainers had more than 10 years of experience in climate change and water resources planning, which may have contributed to the successful delivery of the training. George et al. (2009) recommend that trainers have a long experience in climate sciences. They highlight the lack of technical competence on climate risk by trainers, and, to overcome this, they suggest focusing on general problem-solving skills and knowledge about key concepts relating to climate risk.
In addition to the trainers' experience on the subject, three pedagogical skills are necessary for the delivery of this training, which are facilitation, ability to stimulate students, and preparation of educational courseware.
First, the facilitation script (Supplement 3) was useful in conducting the sessions successfully. Active learning is self-directed learning on the part of the students, and facilitation is essential (George et al., 2009; Wood, 2003). That means the educator needs abilities in aiding reflective dialogue with students, guiding students to identify connections, and bringing balance to discussions (May, 2000).
Second, the working groups were limited to a maximum of six members, and clear and short instructions were provided in each session to ensure engagement by the participants. Active learning requires extra attention to prepare activities that stimulate participation and engagement (George et al., 2009; Prince, 2004; Wood, 2003). Several authors (Prince, 2004; Weber et al., 2021; Wood, 2003) highlight the importance of working in small groups and providing clear instructions to guarantee participation and engagement.
Third, the preparation of the maps (search, selection, and adjustment) was the most time-consuming activity. The set of maps was updated as the need for improvements was perceived. Indeed, PBL requires a significant number of resources (e.g. printed materials) and time for preparation (George et al., 2009; Prince, 2004; Wood, 2003).
In addition, this training was delivered face to face, but trainers should consider specific pedagogical practices for online trainings (Bailey and Card, 2009). A challenge that arises is how to apply active learning in a circumstance that demands social distancing, for instance, the educational disruption in 2020 due to COVID-19 (Farnell et al., 2021). Like Orrill (2002) and Valaitis et al. (2005), the use of digital workspaces for visual collaboration should be explored in future works.
4.2 PBL for teaching climate risk
In this case study, the PBL approach nurtured the practice of interpretation of data, creativity, teamwork, communication, and critical thinking. Assessing climate risks is a complex activity that requires comprehensive interpretation of the context and the data available, as well as collaboration between different knowledge groups and creativity to communicate the results to multiple stakeholders (George et al., 2016; IPCC, 2014; Sherbinin et al., 2019; Travis and Bates, 2014). Many education professionals consider active learning an effective learning approach that brings multiple side benefits (Buckler et al., 2014; Wood, 2003). The benefits of PBL in teaching climate risk are recognized by several authors (George et al., 2009; McCright et al., 2013; Pierce, 2019; Pruneau et al., 2013). PBL also promotes enthusiasm in the classroom and high levels of satisfaction among students (George et al., 2016; Lyon et al., 2013; Prince, 2004; Wood, 2003), which were observed in the delivery of this training.
4.3 Limitations of the training
This training is a work in progress and will be further developed. The limitations of the current training with regards to climate risk education are discussed here to identify possible paths forward.
Risk mapping using the IPCC's climate risk framework is usually adequate for spatial planning (Sherbinin et al., 2019). Other frameworks are available, and, in many cases (e.g. Damania et al., 2010; George et al., 2006, 2016, 2019; Mira-Salama et al., 2013), the climate change risk matrix framework and the international guidelines for risk management (i.e. ISO 31000, 2018) are more meaningful. George et al. (2016) found that the risk matrix is a suitable approach for enhancing water professionals' learnings about climate risk. It is important to note that the training presented here focused on water planning and was limited to 120 min, which was adequate to introduce the principles of the IPCC's climate risk framework. However, in further extensions of this training, it is recommended to include the teaching of the climate change risk matrix and international guidelines for risk management, similar to George et al. (2016).
The training does not provide background information about climate change principles. George et al. (2016) emphasized that participants must be aware of the current state of knowledge on climate change. It is recommended a lecture is given to inform that human-induced climate change is supported by multiple sources of scientific evidence and that related damage and loss can no longer be ignored (IPCC, 2018). Such materials were delivered in the third and fifth training and were very useful to raise awareness about the need for climate action.
The training does not address climate change scenarios. Although recommended to enable decision makers to plan for near- and long-term time horizons (IPCC, 2014), including climate change scenarios in climate risk mapping is not trivial (Sherbinin et al., 2019). The main challenges regard the interpretation of climate change projections and associated uncertainties (Sherbinin et al., 2019; Sutton, 2019). The third training included a session to map climate change risk scenarios, where a package of information with four different sources of climate change evidence was provided (i.e. trends in observational data, level of agreement on the signal of change from a climate model ensemble, regional projections, and literature synthesis). This activity required a considerable level of knowledge about climate change projections and associated uncertainties, and some difficulties in accomplishing the activity persisted, even after an additional lecture about it. In a professional development climate course, George et al. (2009) reported that even trainers have difficulties in understanding climate change projections. Perhaps an alternative is to reduce the package of information. George et al. (2016) simplified complex climatological data and obtained satisfactory results.
This training is designed for the water sector, but it can be easily adapted to other domains that require spatial planning and are exposed to climate hazards, such as health, agriculture, energy, transport, biodiversity, and ecosystems (Sherbinin et al., 2019; Nobre et al., 2019). The maps must be adjusted, and the trainers must ensure that all four elements that comprise climate risk (i.e. climate hazard, exposure, sensitivity, and adaptive capacity) are represented in the collection of maps. The interactive exercise in Session 1 can be used in other domains to help participants assimilate the IPCC's climate risk concept. However, that might depend on the pre-existing knowledge and experience of the participants regarding floods (Mohadjer et al., 2021). Moreover, the classroom culture must be taken into consideration in this kind of training, and adjustments may be necessary (Mohadjer et al., 2021; George et al., 2006).
In terms of the methods of evaluation, it should be noted that in this case study we have not applied semi-structured qualitative interviews or statistical methods of analysis. This limits to some extent the ability to isolate the effect of the training proposed (Lyon et al., 2013). Triangulation of results from different evaluation methods enhances the validity of the conclusions (Grove et al., 2013; Lindorff and Sammons, 2018) and is recommended in future deliveries of this training. Despite the gain of knowledge perceived by the participants and the positive feedbacks, self-assessments tend to overestimate the competence of the participants (Andrade, 2019; Boud, 1995; Kruger and Dunning, 1999; Strobl et al., 2020). On the other hand, self-assessment promotes personal development, which is interlinked with the acquisition of content (Andrade, 2019; Boud, 1995). Its application is advantageous for learners and trainers, such as feedback, student engagement, and increased trust (Taras, 2010), as observed in the delivery of this training (RQ2). In this case study, it was not possible to assess the differences, if any, in the self-assessment responses between the groups (e.g. undergraduates vs. practitioners) because the self-assessment was applied only for the undergraduate students (training 2 and 3). However, considering the classroom observations and the feedback from the participants, it is unlikely that there were substantial differences in the responses between the groups. While these are shortcomings of this case study, it highlights the value of including pedagogical experts in the design of lecture evaluations (Lyon et al., 2013), for instance, in further developments of this training.
4.4 Application of the concept of climate risk by water professionals
The concept of climate risk is useful for governmental bodies that are involved in long-term water resources planning and emergency preparedness, such as water agencies, ministries, water suppliers, civil defence, and state executive offices (George et al., 2016; Flagg and Kirchhoff, 2018; Raucher et al., 2018; Yates et al., 2015; Boholm and Prutzer, 2017). In Brazil, examples of organizations are the National Water and Sanitation Agency (ANA, 2016), the Ministry of Environment (Brazil, 2016), and the SDE (Santa Catarina, 2009). Universities, research centres, and consultancies are also interested in information about the impacts of climate change on the water resources (Borges de Amorim et al., 2020). Many water professionals are already adopting new analytic tools to respond to climate change, and the demand for climate risk training is increasing (Raucher et al., 2018; George et al., 2016; Yates et al., 2015). The challenge that remains in the application of the climate risk concept by water professionals is the lack of political saliency and unclear demarcation of responsibility between actors (Boholm and Prutzer, 2017; McBean and Rodgers, 2010). Training water professionals from governmental bodies, as we did with SDE, can raise awareness about the role of governmental bodies in climate change adaptation and, consequently, increase the demand for water professionals equipped with knowledge on climate risk (McNamara, 2013; Pruneau et al., 2013; McBean and Rodgers, 2010; George et al., 2016).
This case study demonstrates the development and delivery of a climate risk training based on PBL pedagogy where the IPCC's climate risk framework is applied through mapping. The training supports student's learnings about climate risk, even in a short-duration course. The training was delivered face to face to five independent groups in Brazil from 2018 to 2019 and reached 94 higher education students and practitioners in the field of water resources planning. It permitted us to gather several lessons learned and, consequently, improve the training and the educational courseware. Qualitative observation and self-assessment show that the participants perceived a gain in knowledge and practised interpretation of data, creativity, teamwork, communication, and critical thinking skills. At the same time, the results suggest that the practical sessions produced significant levels of satisfaction and motivation.
The educational courseware can be directly transferred to higher educational institutions in Brazil and will require minor adjustments when applied in other countries and domains (e.g. updating of the maps). Regarding the pedagogical skills needed to deliver this training, some level factual knowledge about climate change and water resources planning is recommended, as well as facilitation skills and time for preparing the courseware. We recommend the evaluation methods adopted in this case study to be further developed for future application and evaluations of this training. Further research should investigate the value of a longitudinal study to assess what has been learned and applied and how learning can therefore be enhanced (e.g. upscaled and accelerated). Through more targeted educational courseware in development, delivery, and evaluation in programmatic and integrative ways, climate risk and adaptation can be strengthened in stand-alone courses and professional development training where climate is an embedded component. This training, aligned with other structured courses, can be of value to educational systems and across cultures and have appeal primarily to personnel in academia and curriculum designers as an indicator of applied climate knowledge and skills.
Training 1
-
Date: 8 August 2018
-
Institution: Federal University of Santa Catarina (UFSC)
-
Number of participants: 20
-
Profile: undergraduate students from Sanitary and Environmental Engineering
-
Duration: 2 h
-
Teaching modules: climate risk analysis
-
Documentation available: maps and risk maps
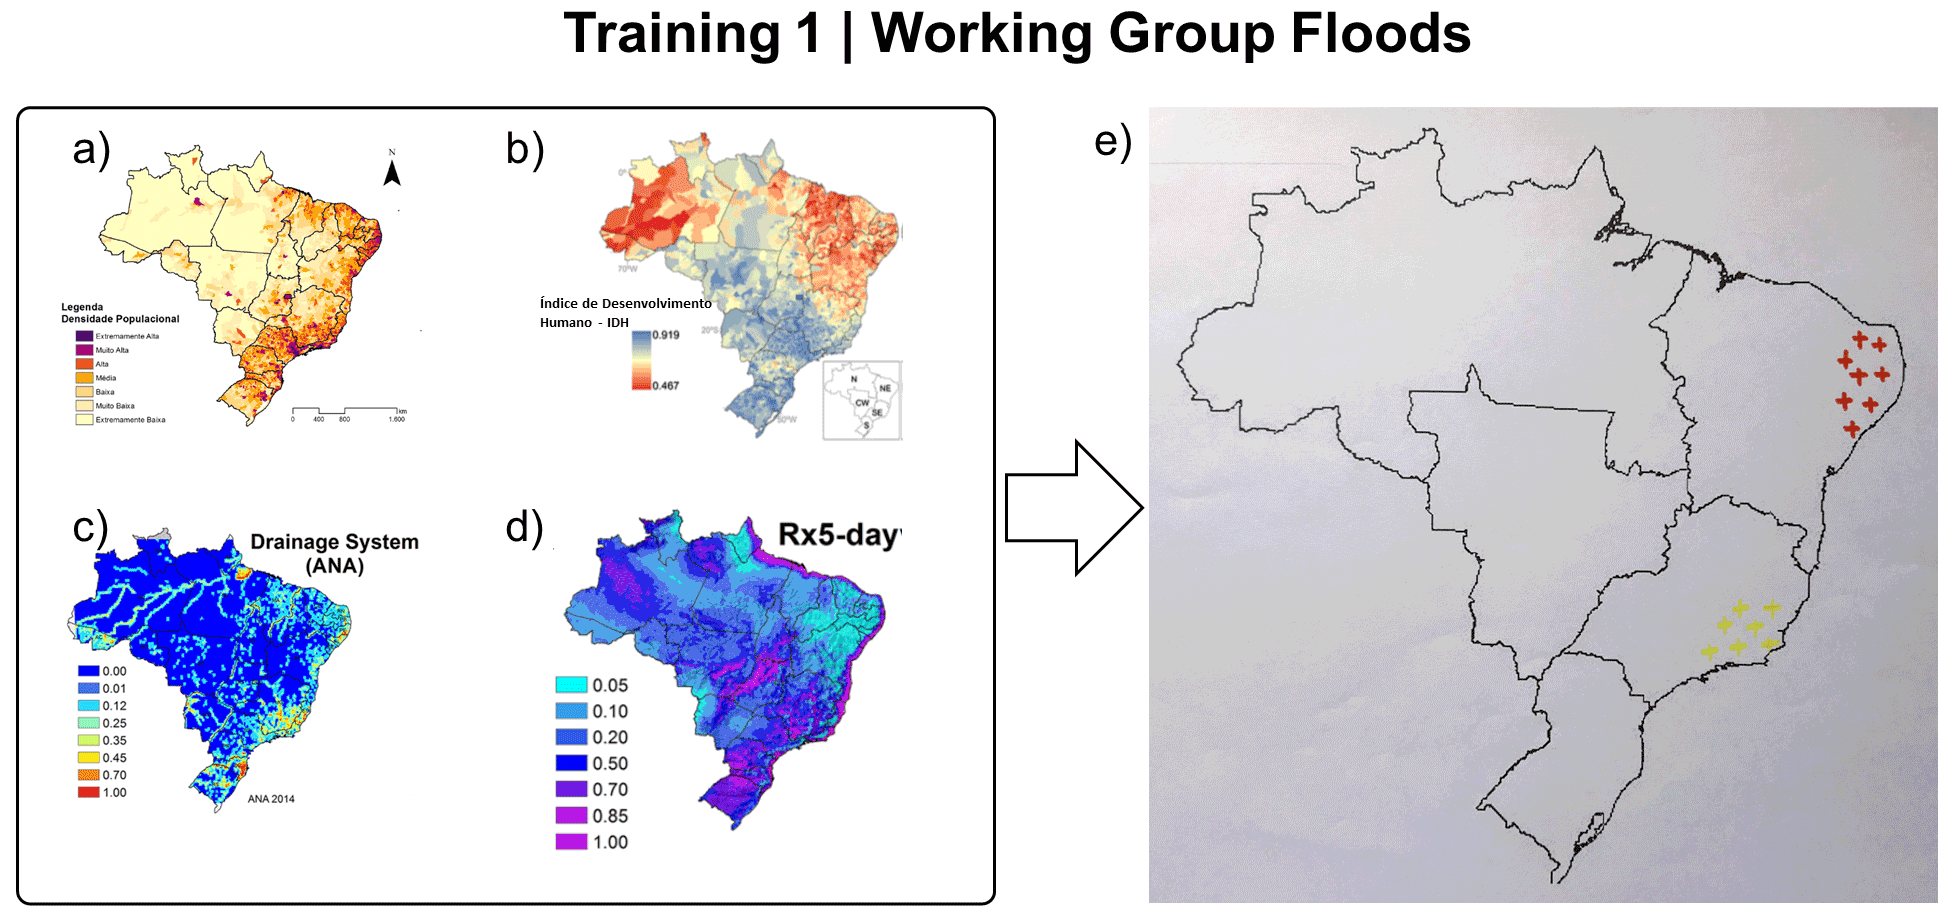
Figure A1Package of maps used in the first training for mapping climate risk associated with floods. The maps illustrate (a) population density (MMA, 2017), (b) Human Development Index (HDI; Torres et al., 2012), (c) watershed drainage (Debortoli et al., 2017), (d) maximum consecutive 5 d precipitation (Rx5-day; Debortoli et al., 2017), and (e) the climate risk map drawn by the participants.
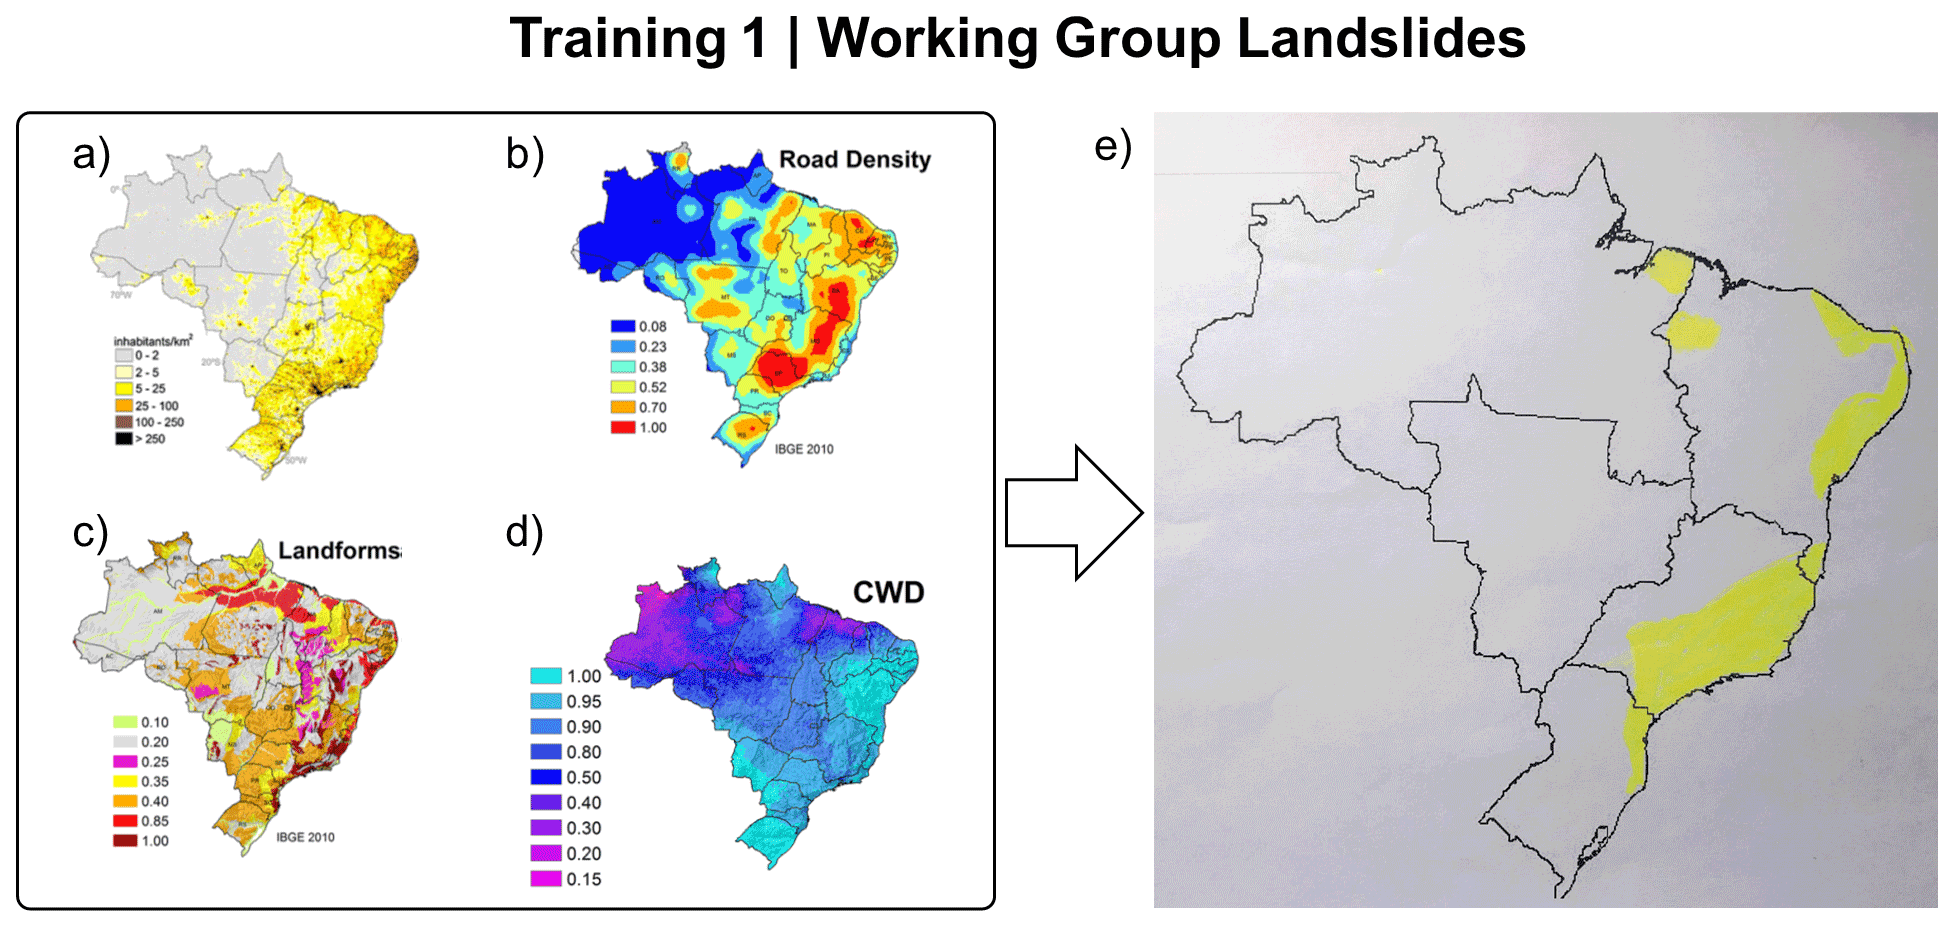
Figure A2Package of maps used in the first training for mapping climate risk associated with landslides. The maps illustrate (a) Brazilian population density (Torres et al., 2012), (b) road density (Debortoli et al., 2017), (c) landforms (Debortoli et al., 2017), (d) consecutive wet days (CWD; Debortoli et al., 2017), and (e) the climate risk map drawn by the participants.
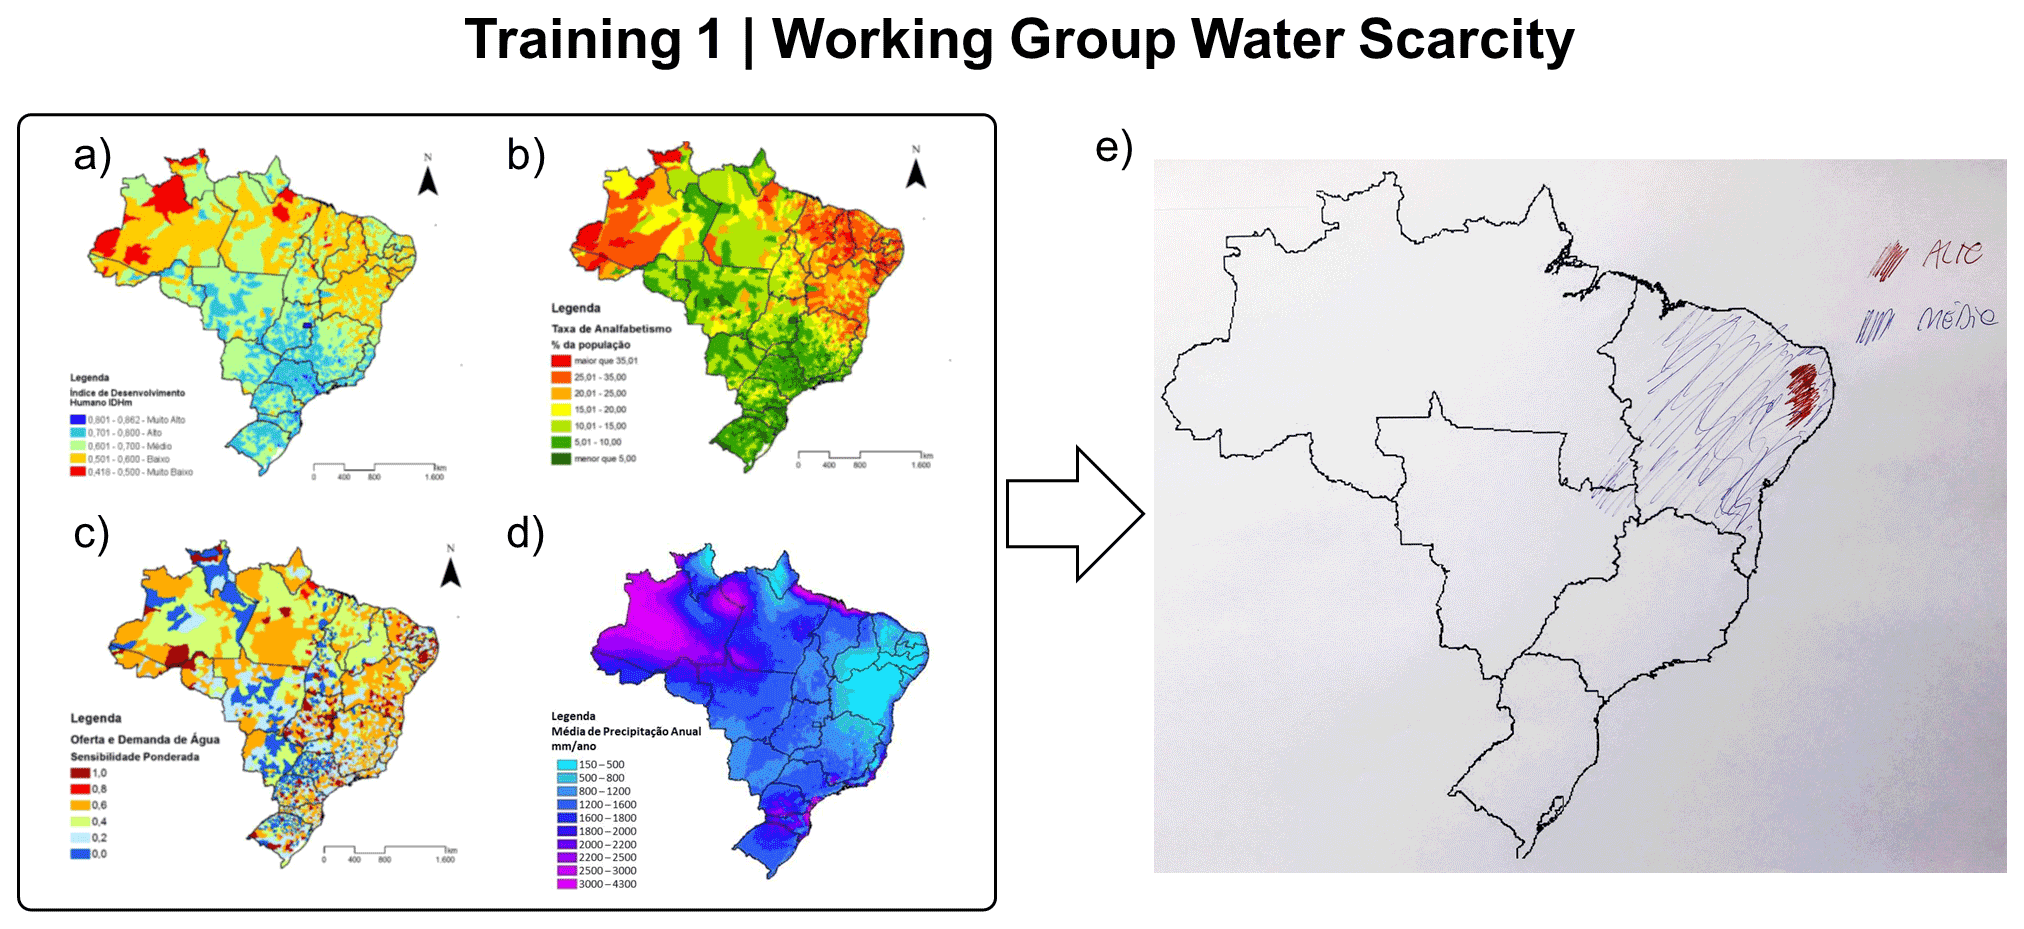
Figure A3Package of maps used in the first training for mapping climate risk associated with water scarcity. The maps illustrate (a) Human Development Index (HDI; MMA, 2017), (b) illiteracy rate (MMA, 2017), (c) water supply and demand (MMA, 2017), (d) annual precipitation (MMA, 2017), and (e) the climate risk map drawn by the participants.

Figure A4Package of maps used in the first training for mapping climate risk associated with agricultural droughts. The maps illustrate (a) land use (MMA, 2017), (b) child mortality (MMA, 2017), (c) Human Development Index (HDI; MMA, 2017), (d) drought potential (MMA, 2017), and (e) the climate risk map drawn by the participants.
Training 2
-
Date: 11 April 2019
-
Institution: Federal University of Santa Catarina (UFSC)
-
Number of participants: 21
-
Profile: undergraduate students from Sanitary and Environmental Engineering
-
Duration: 2 h
-
Teaching modules: climate risk analysis
-
Documentation available: maps, risk maps, photos of the activities, and self-assessment chart
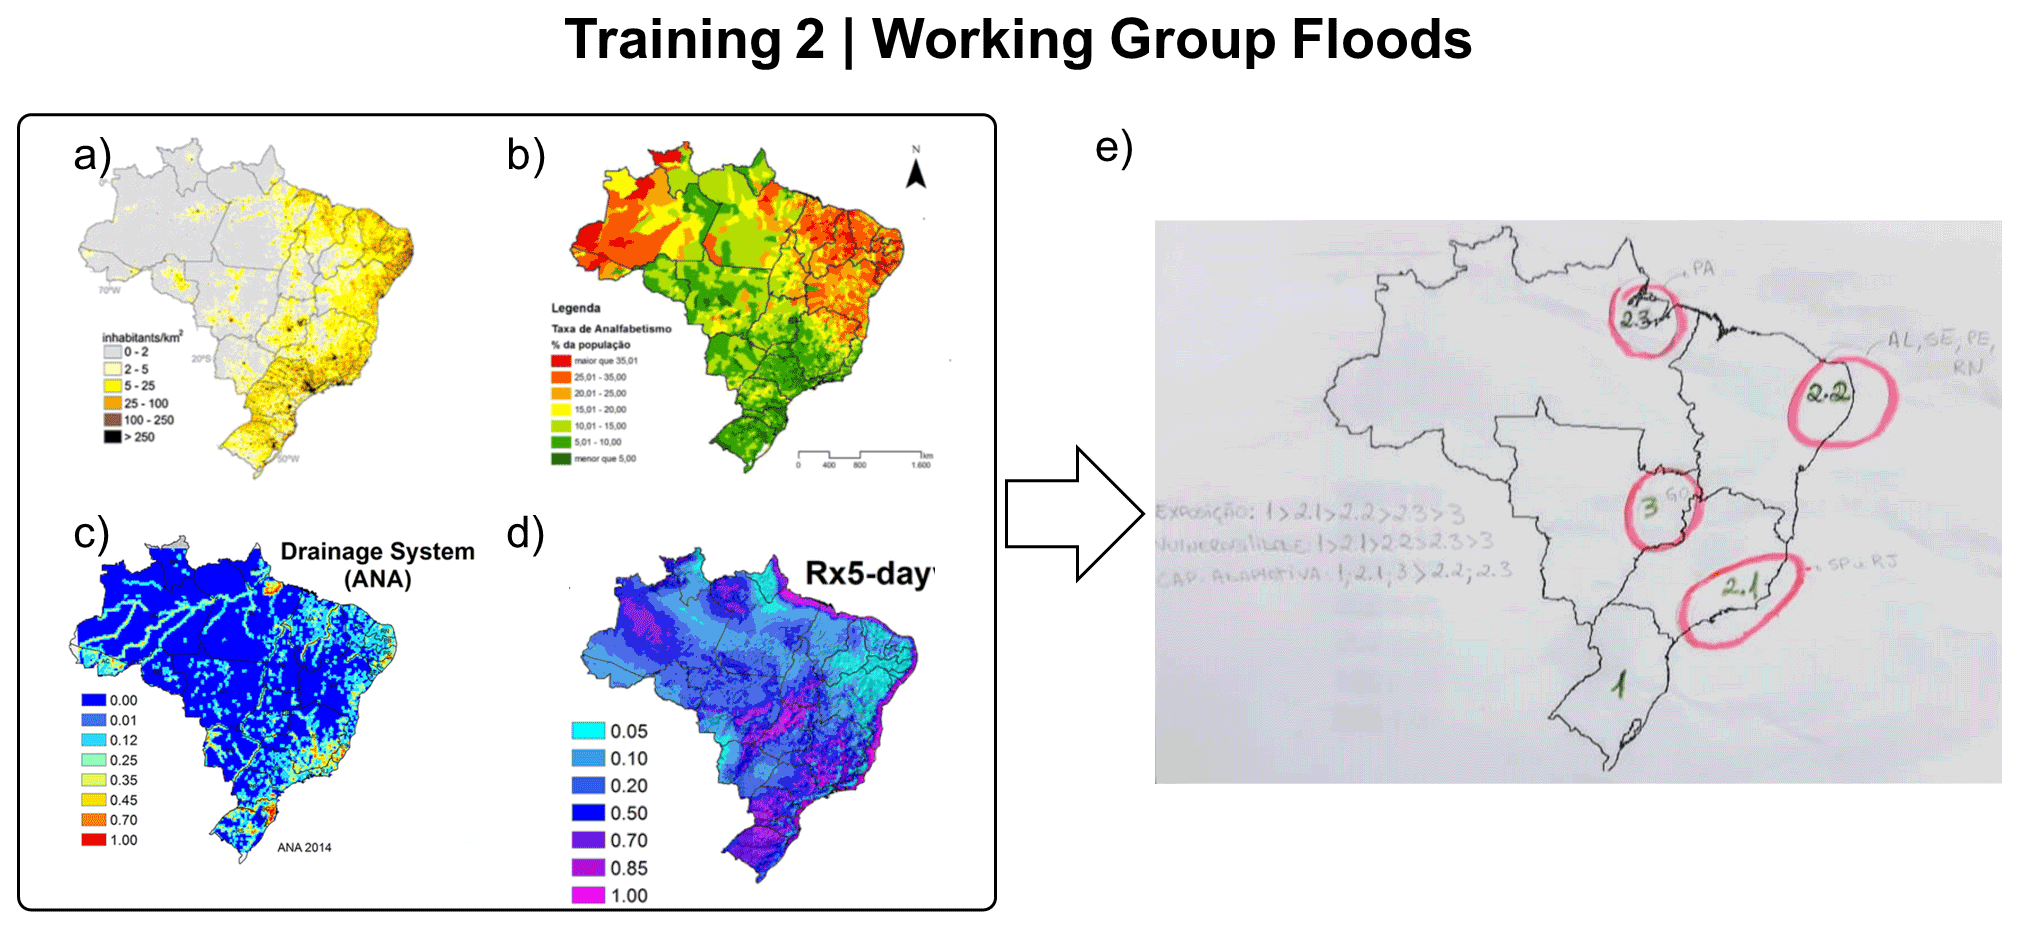
Figure A5Package of maps used in the second training for mapping climate risk associated with floods. The maps illustrate (a) Brazilian population density (Torres et al., 2012), (b) illiteracy rate (MMA, 2017), (c) watershed drainage (Debortoli et al., 2017), (d) maximum consecutive 5 d precipitation (Rx5-day; Debortoli et al., 2017), and (e) the climate risk map drawn by the participants.
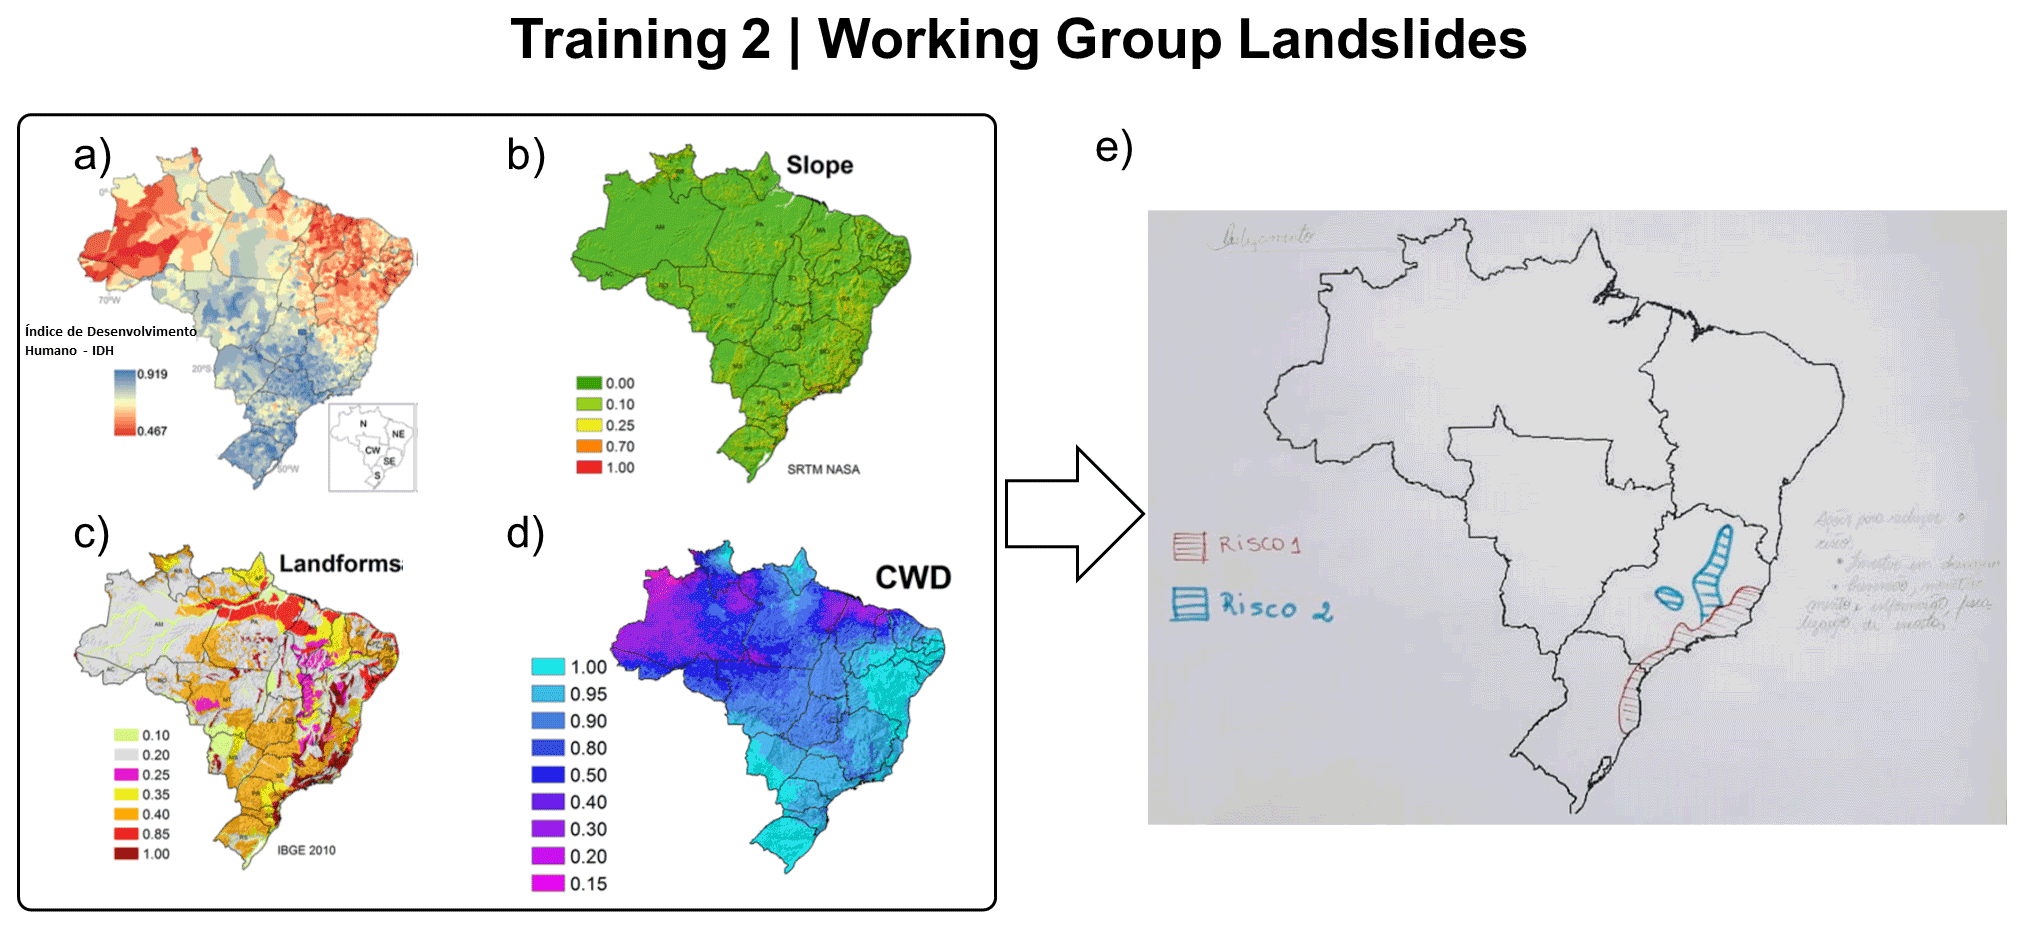
Figure A6Package of maps used in the second training for mapping climate risk associated with landslides. The maps illustrate (a) Human Development Index (HDI; Torres et al., 2012), (b) slope (Debortoli et al., 2017), (c) landforms (Debortoli et al., 2017), (d) consecutive wet days (CWD; Debortoli et al., 2017), and (e) the climate risk map drawn by the participants.
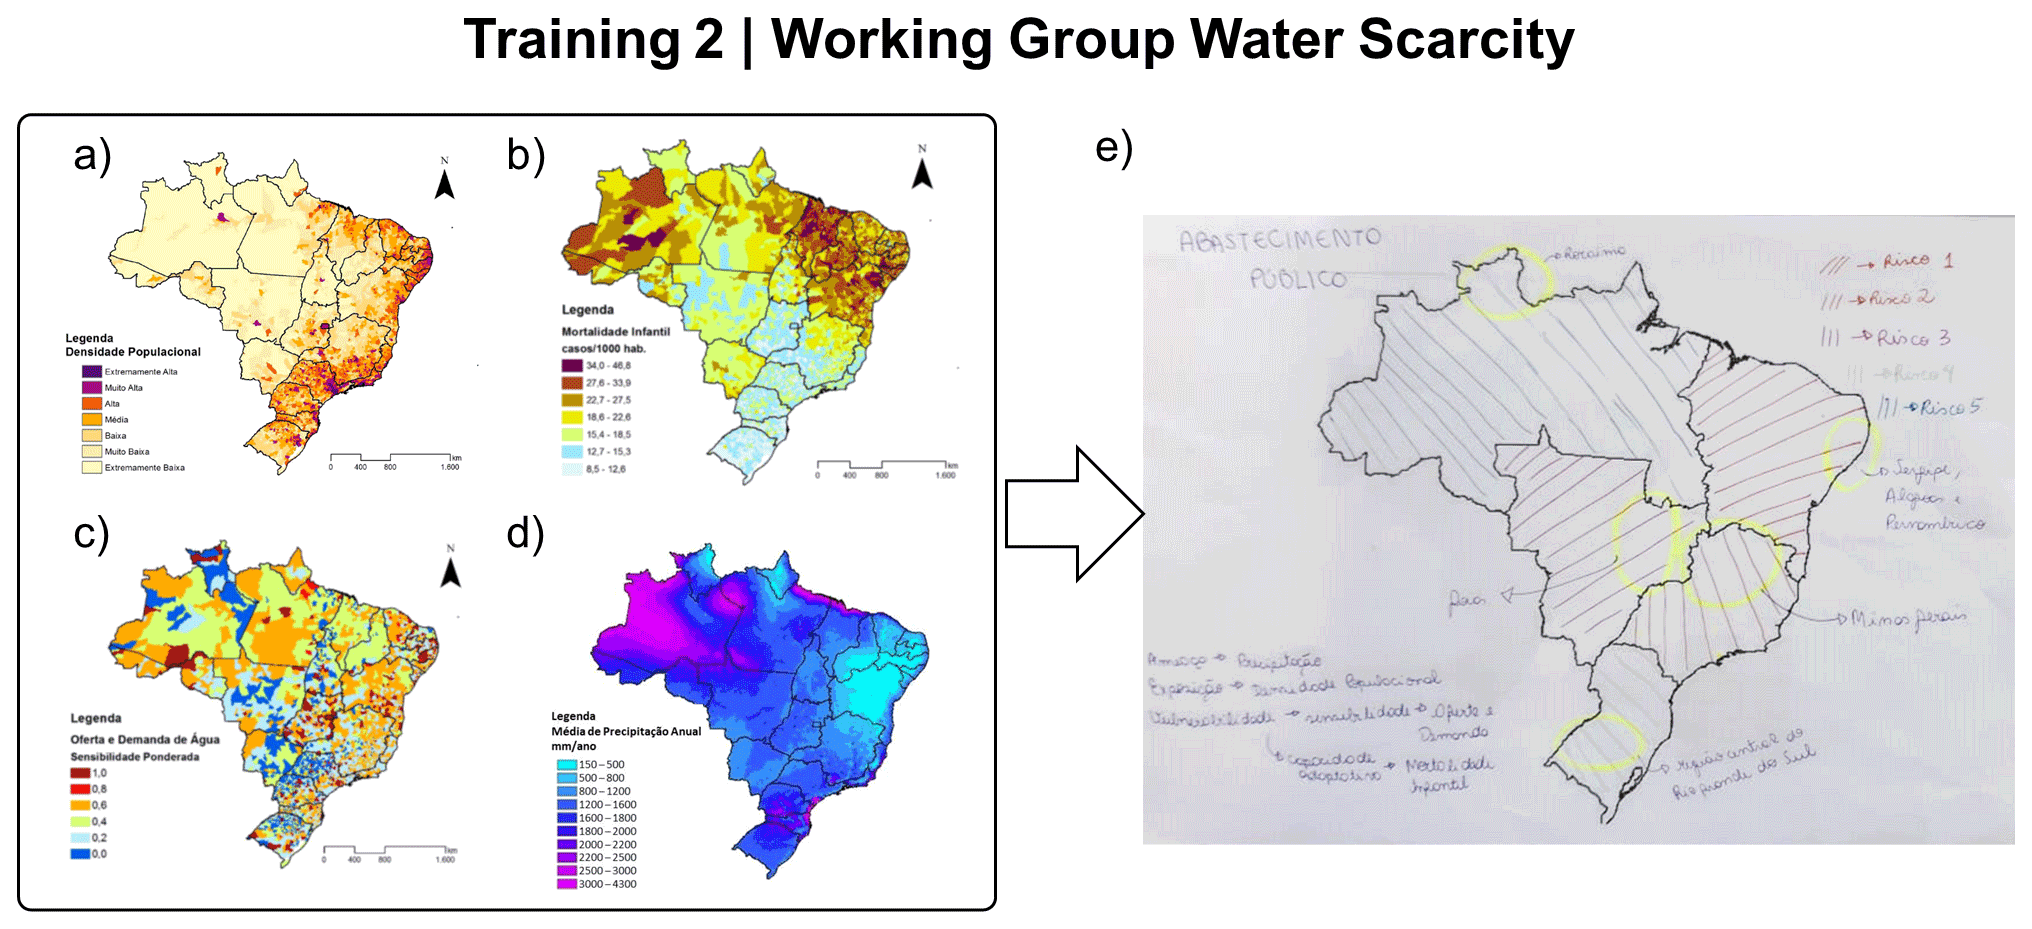
Figure A7Package of maps used in the second training for mapping climate risk associated with water scarcity. The maps illustrate (a) population density (MMA, 2017), (b) child mortality (MMA, 2017), (c) water supply and demand (MMA, 2017), (d) annual precipitation (MMA, 2017), and (e) the climate risk map drawn by the participants.

Figure A8Package of maps used in the second training for mapping climate risk associated with agricultural droughts. The maps illustrate (a) Human Development Index (HDI; MMA, 2017), (b) land use (MMA, 2017), (c) road density (Debortoli et al., 2017), (d) drought potential (MMA, 2017), and (e) the climate risk map drawn by the participants.

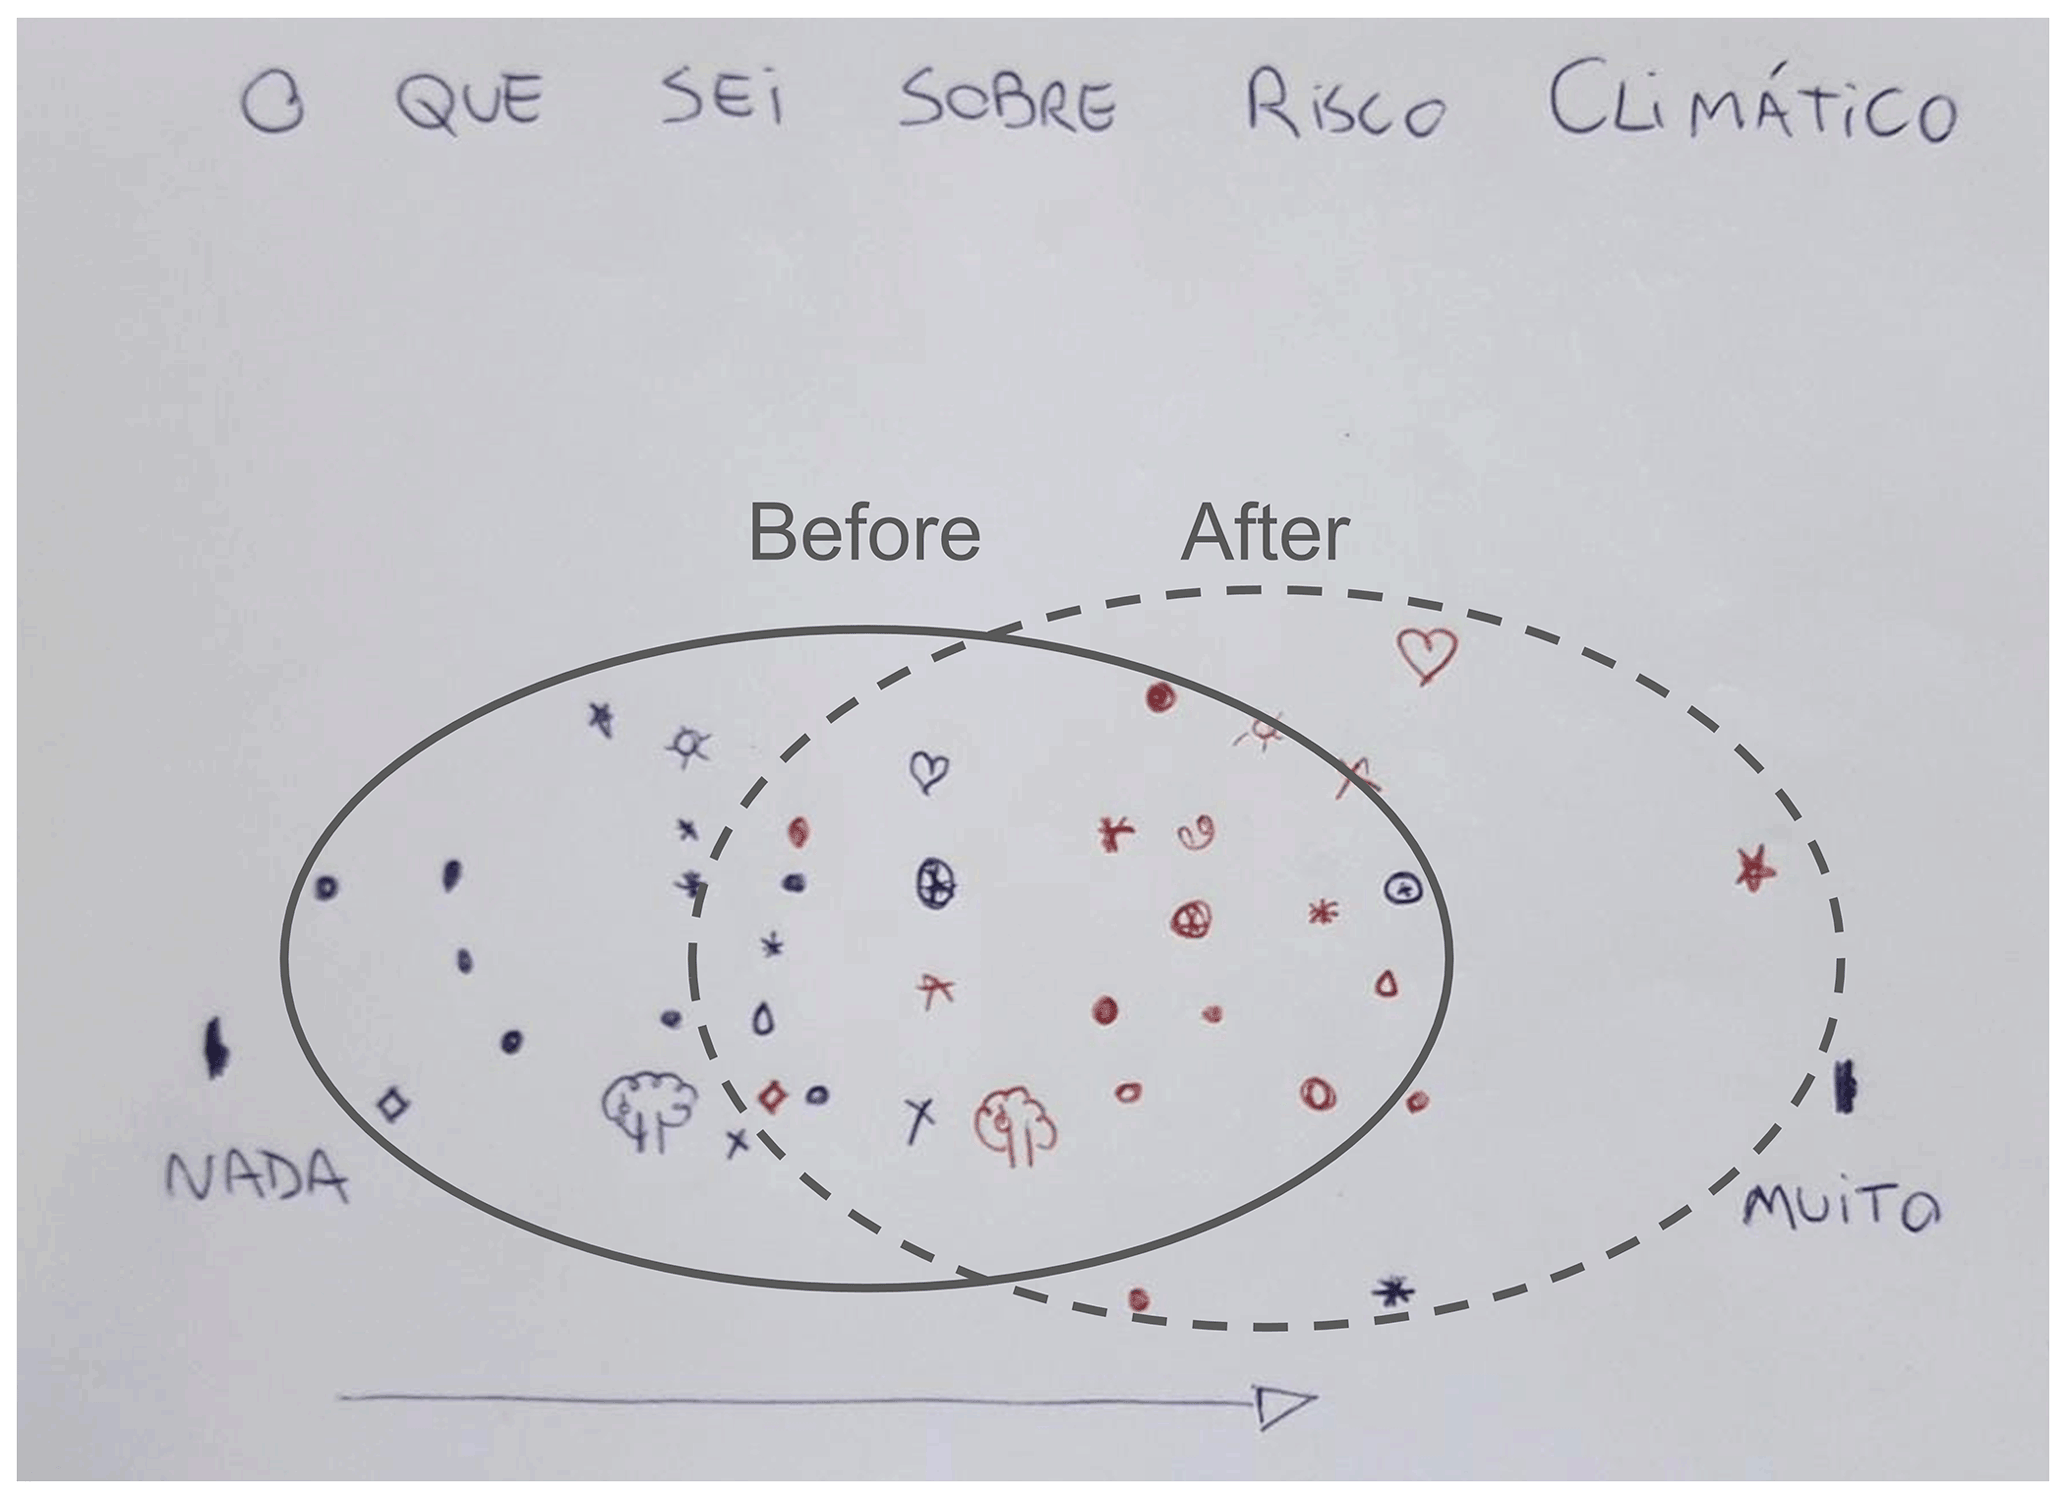
Figure A10Chart illustrating the evolution of participants' perception of learning about climate risk in the second training. Each symbol represents a participant, and colours represent the temporality (before and after the lecture). The circle with a continuous line encompasses the perception of the participants at the beginning of the training, whereas the circle with a dashed line embraces the perception at the end of the lecture.
Training 3
-
Date: 5–6 July 2019
-
Institution: State University of São Paulo (UNESP)
-
Number of participants: 19
-
Profile: graduate students from Water Resources Management Master's programme
-
Duration: 11 h
-
Teaching modules: introduction to climate change, introduction to climate information, climate risk analysis, and climate risk analysis (future)
-
Documentation available: maps, risk maps, photos of the activities, and self-assessment chart
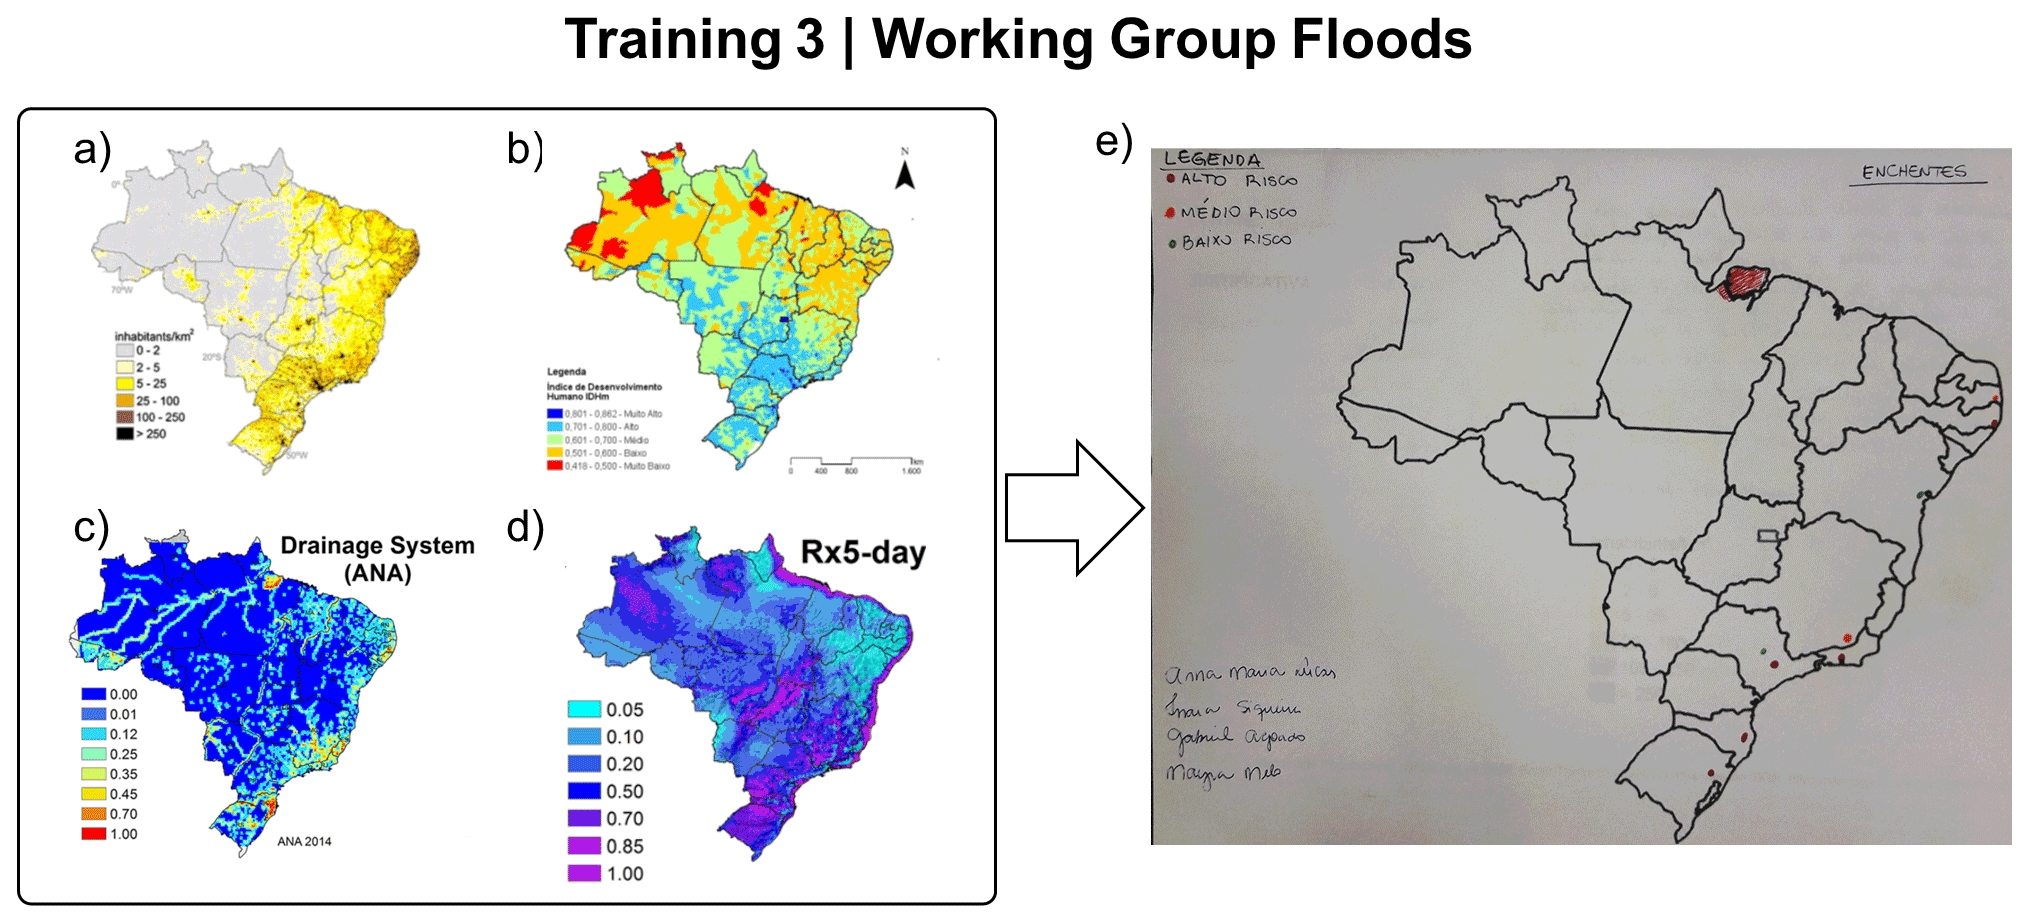
Figure A11Package of maps used in the third training for mapping climate risk associated with floods. The maps illustrate (a) Brazilian population density (Torres et al., 2012), (b) Human Development Index (HDI; MMA 2017), (c) watershed drainage (Debortoli et al., 2017), (d) maximum consecutive 5 d precipitation (Rx5-day; Debortoli et al., 2017), and (e) the climate risk map drawn by the participants.
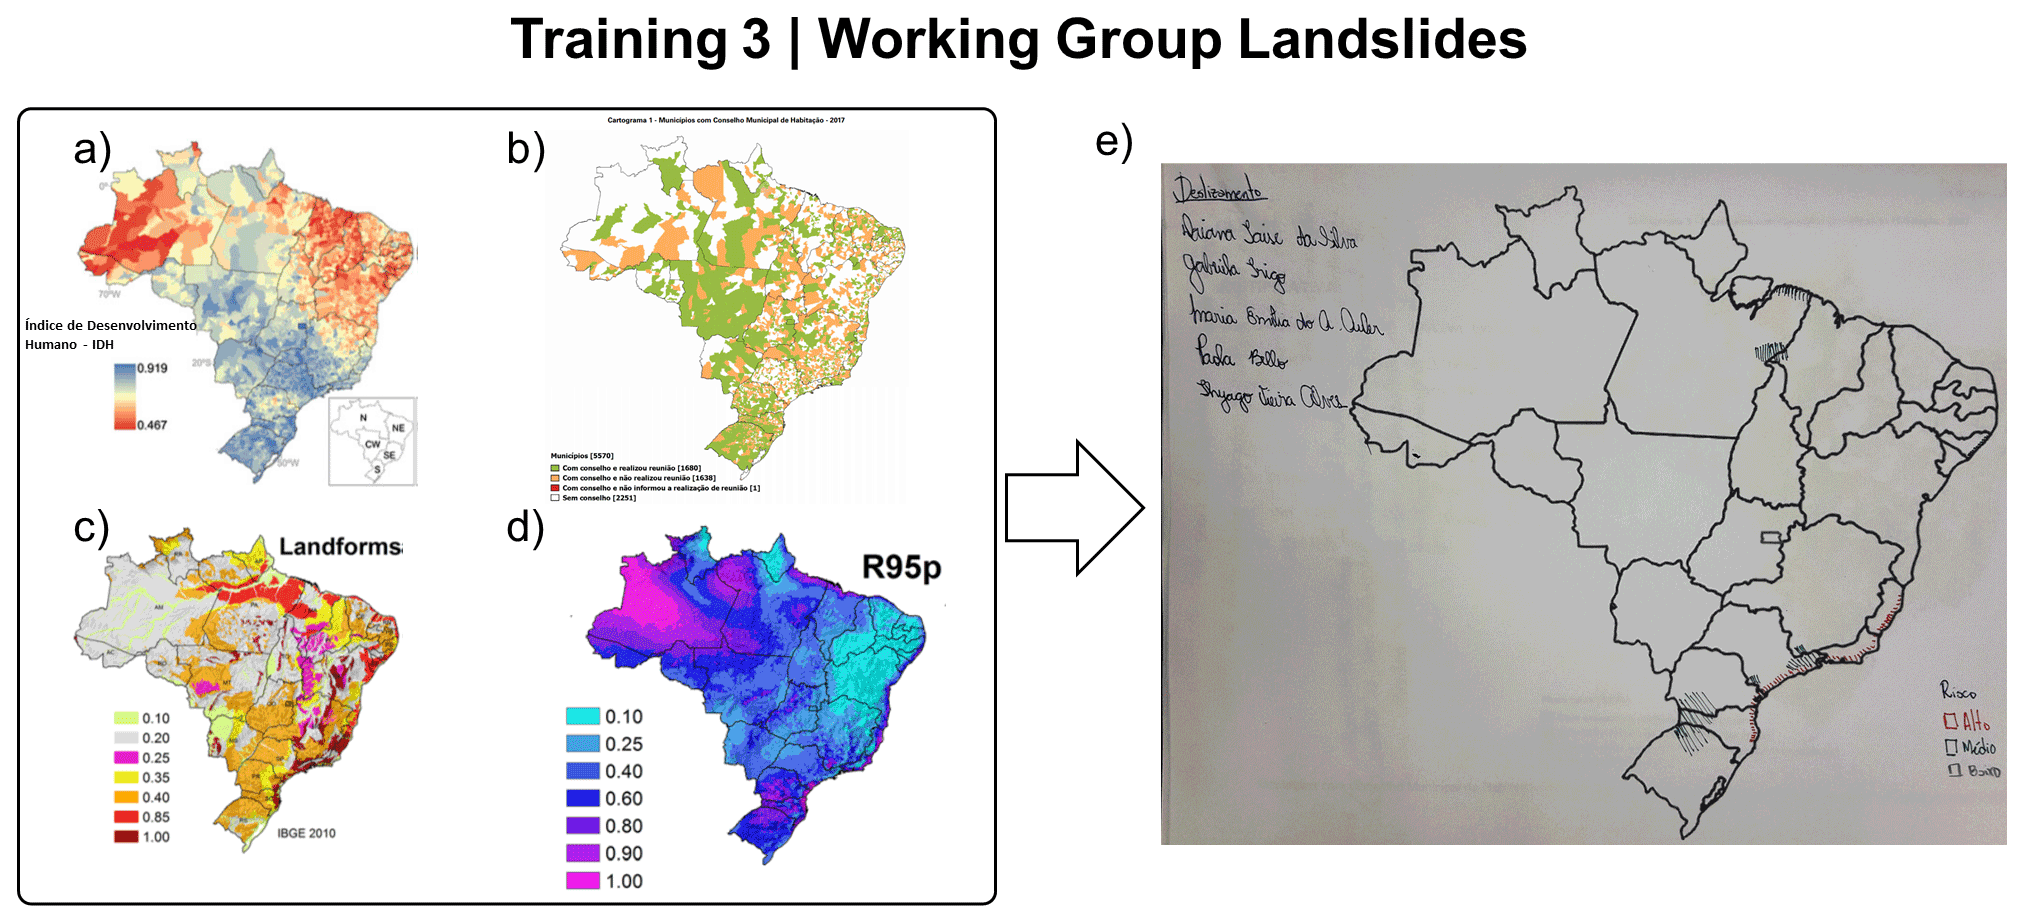
Figure A12Package of maps used in the third training for mapping climate risk associated with landslides. The maps illustrate (a) Human Development Index (HDI; Torres et al., 2012), (b) municipalities with council for housing (IBGE, 2017), (c) landforms (Debortoli et al., 2017), (d) annual total precipitation when rainfall > 95th percentile (R95p; Debortoli et al., 2017), and (e) the climate risk map drawn by the participants.

Figure A13Package of maps used in the third training for mapping climate risk associated with water scarcity. The maps illustrate (a) population density (MMA, 2017), (b) stage of implementation of the water resources planning (Planos de Recursos Hídricos, 2020), (c) water security index (Planos de Recursos Hídricos, 2020), (d) annual rainfall (Normais climatológicas do Brasil, 2020), and (e) the climate risk map drawn by the participants.
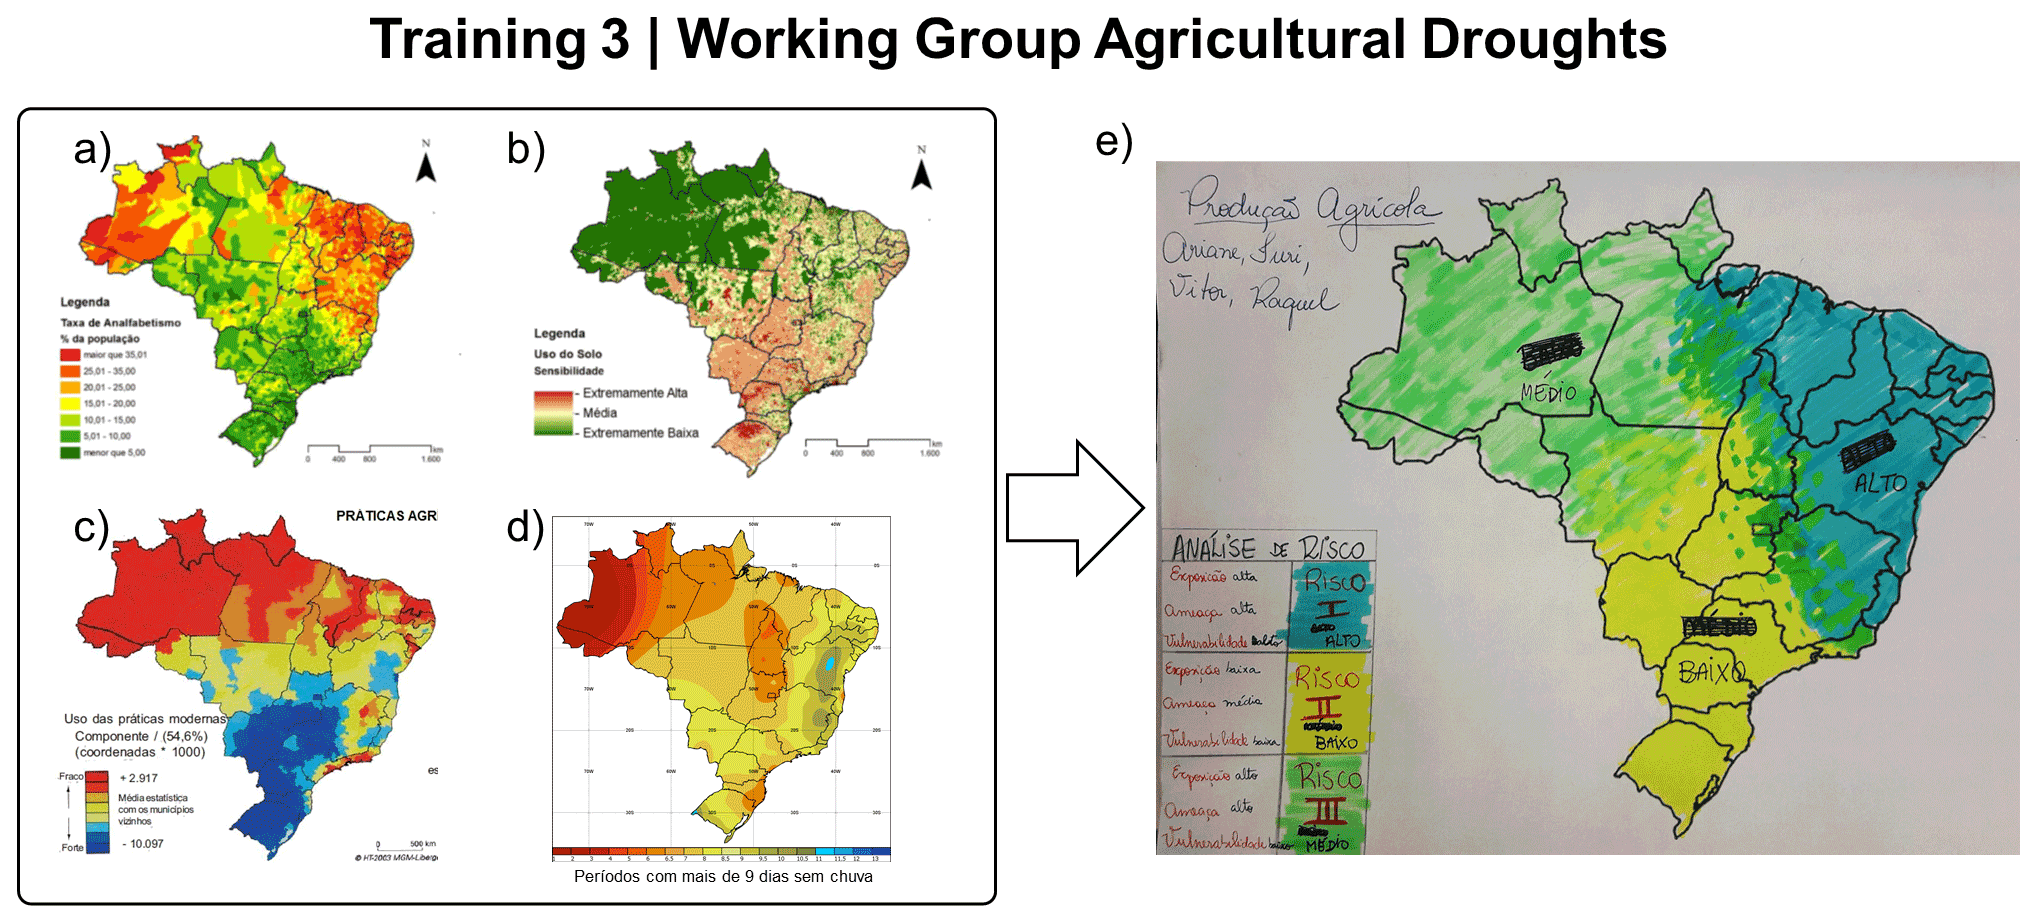
Figure A14Package of maps used in the third training for mapping climate risk associated with agricultural droughts. The maps illustrate (a) illiteracy rate (MMA, 2017), (b) land use (MMA, 2017), (c) use of modern practices in agriculture (Théry and Mello, 2018), (d) number of dry spells longer than 9 d (Normais climatológicas do Brasil, 2020), and (e) the climate risk map drawn by the participants.
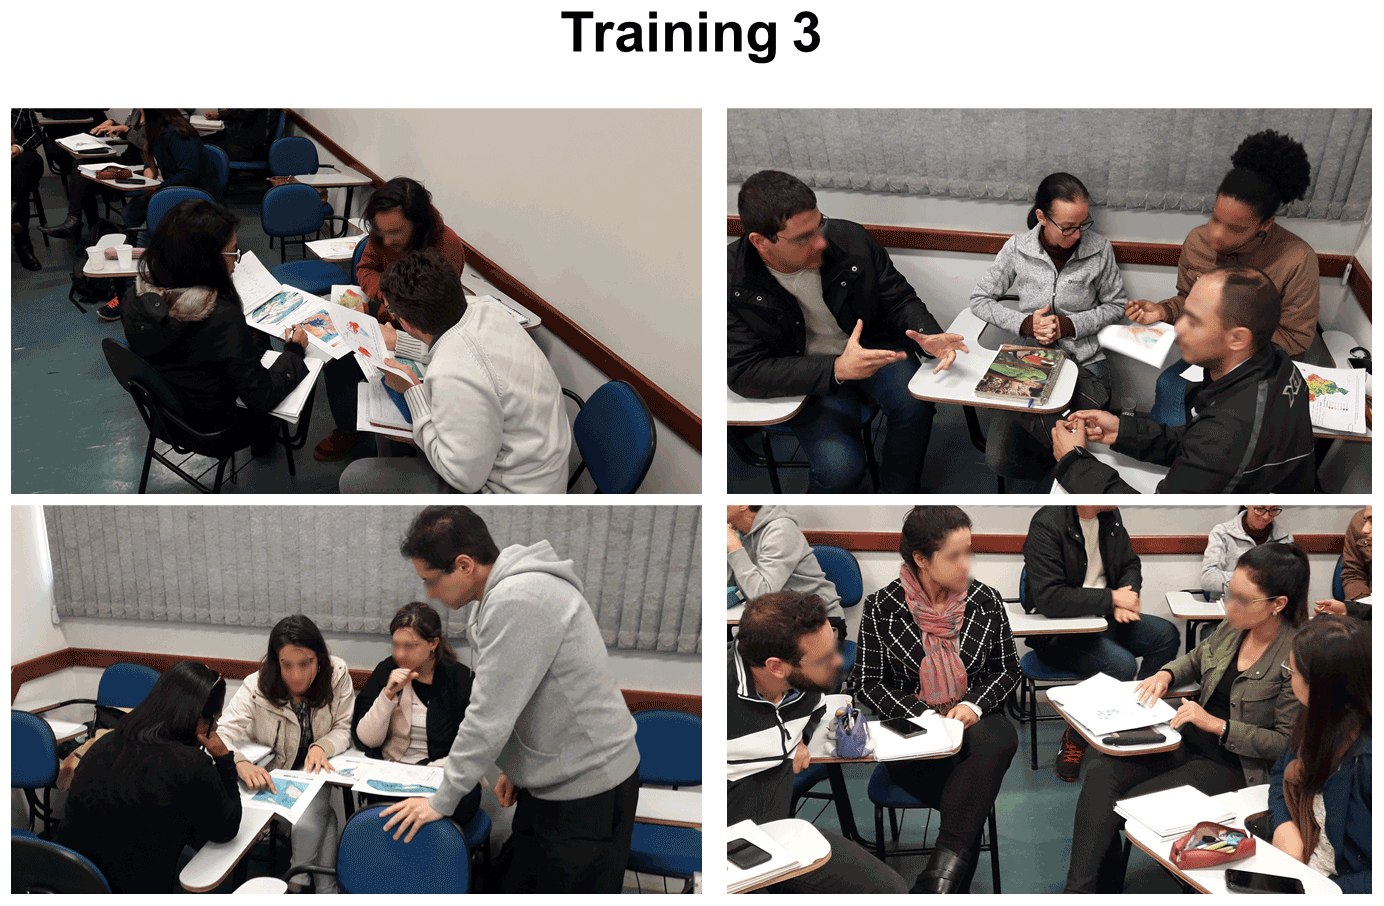

Figure A16Chart illustrating the evolution of participants' perception of learning about climate risk in the third training. Each symbol represents a participant, and colours represent the temporality (before and after the lecture). The circle with a continuous line encompasses the perception of the participants at the beginning of the lecture, whereas the circle with a dashed line embraces the perception at the end of the lecture.
Training 4
-
Date: 29 August 2019
-
Institution: Federal University of Santa Catarina (UFSC)
-
Number of participants: 22
-
Profile: undergraduate students from Sanitary and Environmental Engineering
-
Duration: 2 h
-
Teaching modules: climate risk analysis
-
Documentation available: maps and photos of the activities
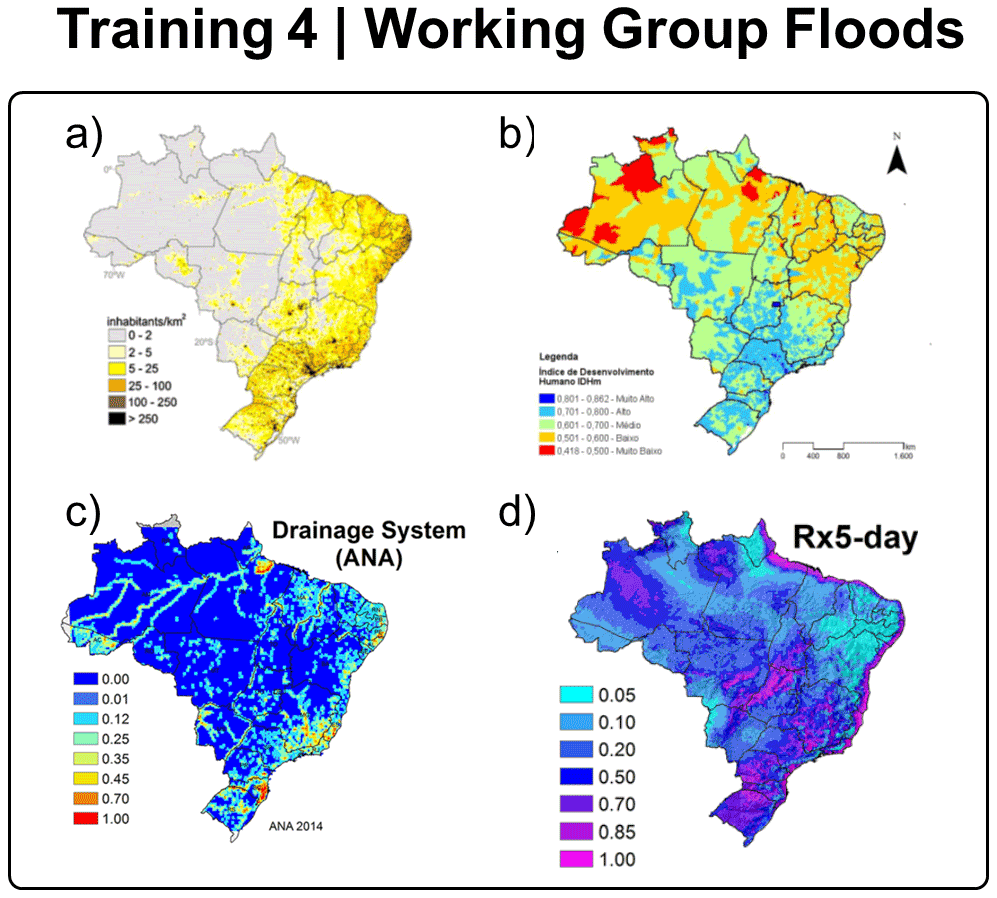
Figure A17Package of maps used in the fourth training for mapping climate risk associated with floods. The maps illustrate (a) Brazilian population density (Torres et al., 2012), (b) Human Development Index (HDI; MMA 2017), (c) watershed drainage (Debortoli et al., 2017), and (d) maximum consecutive 5 d precipitation (Rx5-day; Debortoli et al., 2017).
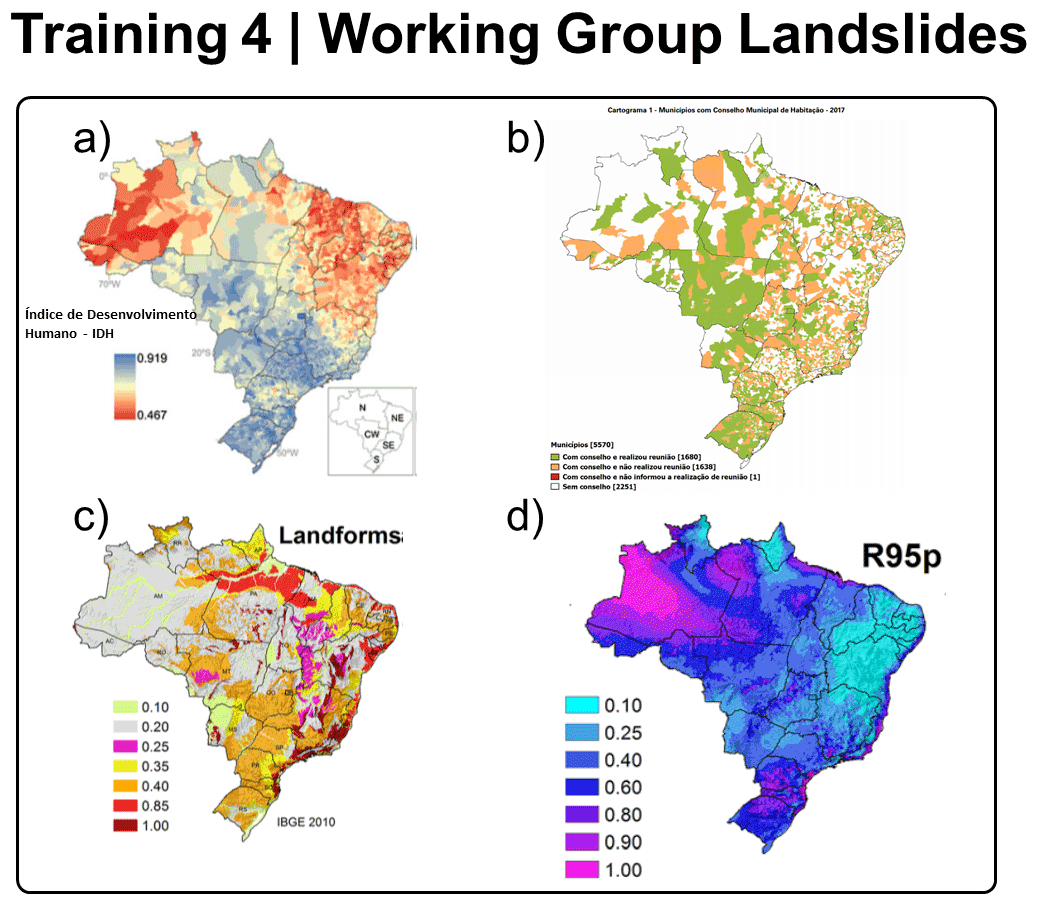
Figure A18Package of maps used in the fourth training for mapping climate risk associated with floods. The maps illustrate (a) Human Development Index (HDI; Torres et al., 2012), (b) municipal housing council (IBGE, 2017), (c) landforms (Debortoli et al., 2017), and (d) annual total precipitation when rainfall > 95th percentile (R95p; Debortoli et al., 2017).
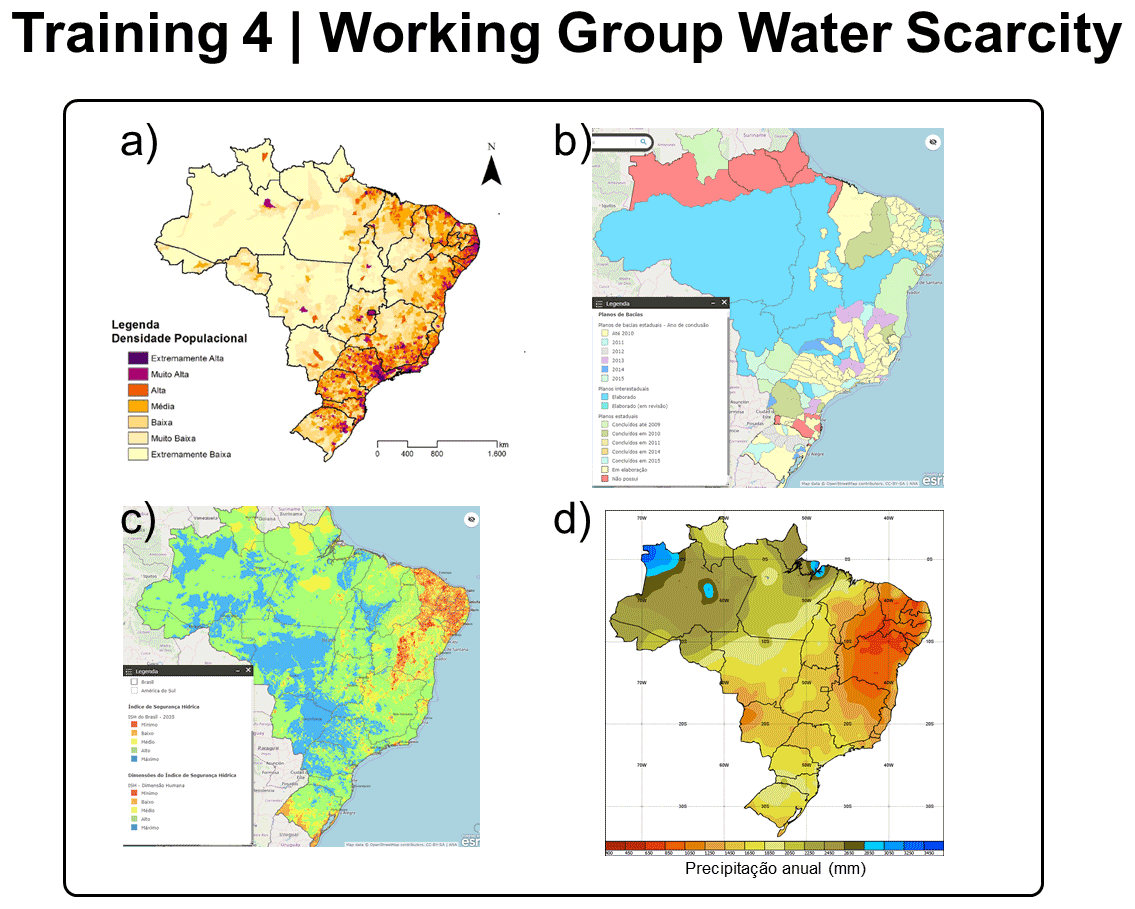
Figure A19Package of maps used in the fourth training for mapping climate risk associated with water scarcity. The maps illustrate (a) population density (MMA, 2017), (b) stage of implementation of the water resources planning (Planos de Recursos Hídricos, 2020), (c) water security index (Planos de Recursos Hídricos, 2020), and (d) annual rainfall (Normais climatológicas do Brasil, 2020).
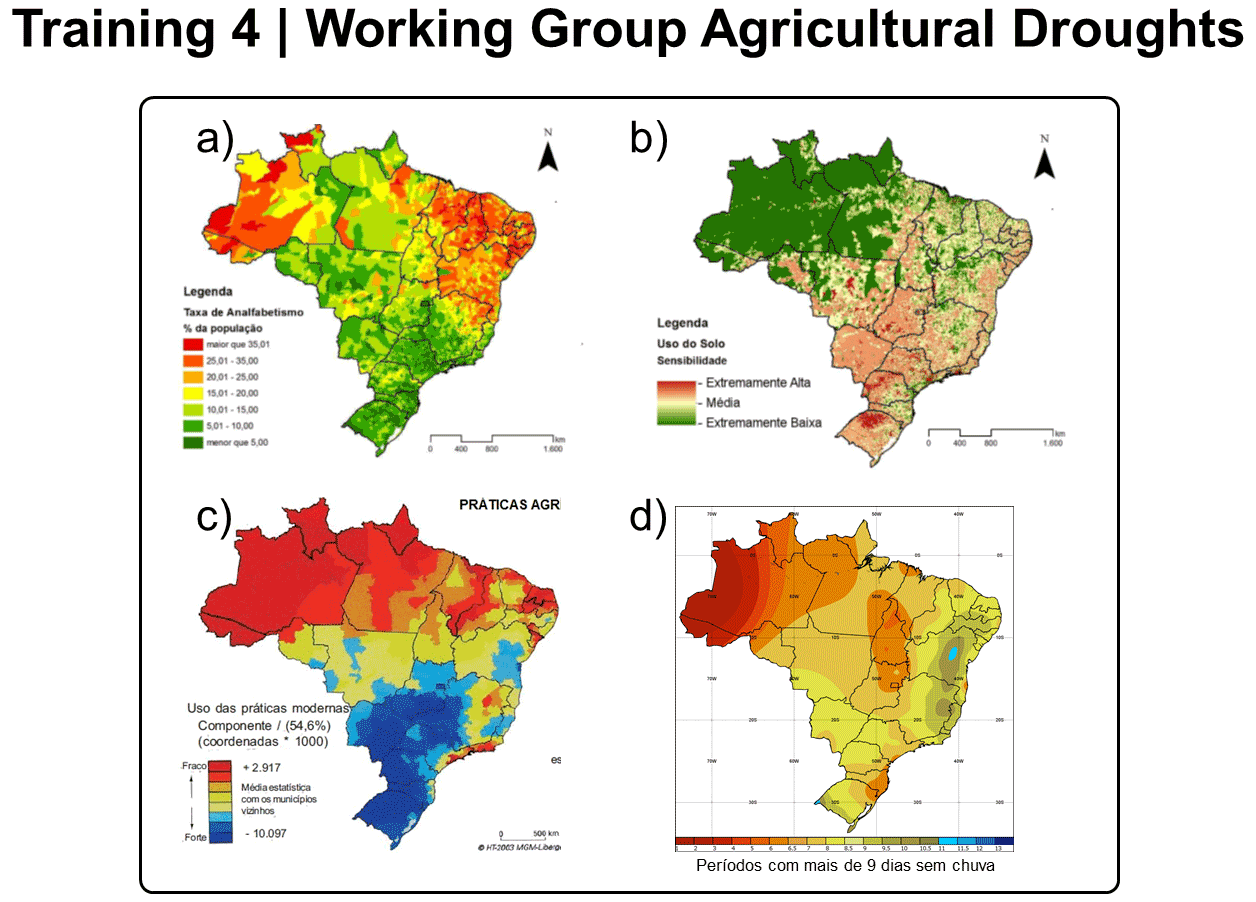
Figure A20Package of maps used in the fourth training for mapping climate risk associated with agricultural droughts. The maps illustrate (a) illiteracy rate (MMA, 2017), (b) land use (MMA, 2017), (c) use of modern practices in agriculture (Théry and Mello, 2018), and (d) number of dry spells longer than 9 d (Normais climatológicas do Brasil, 2020).

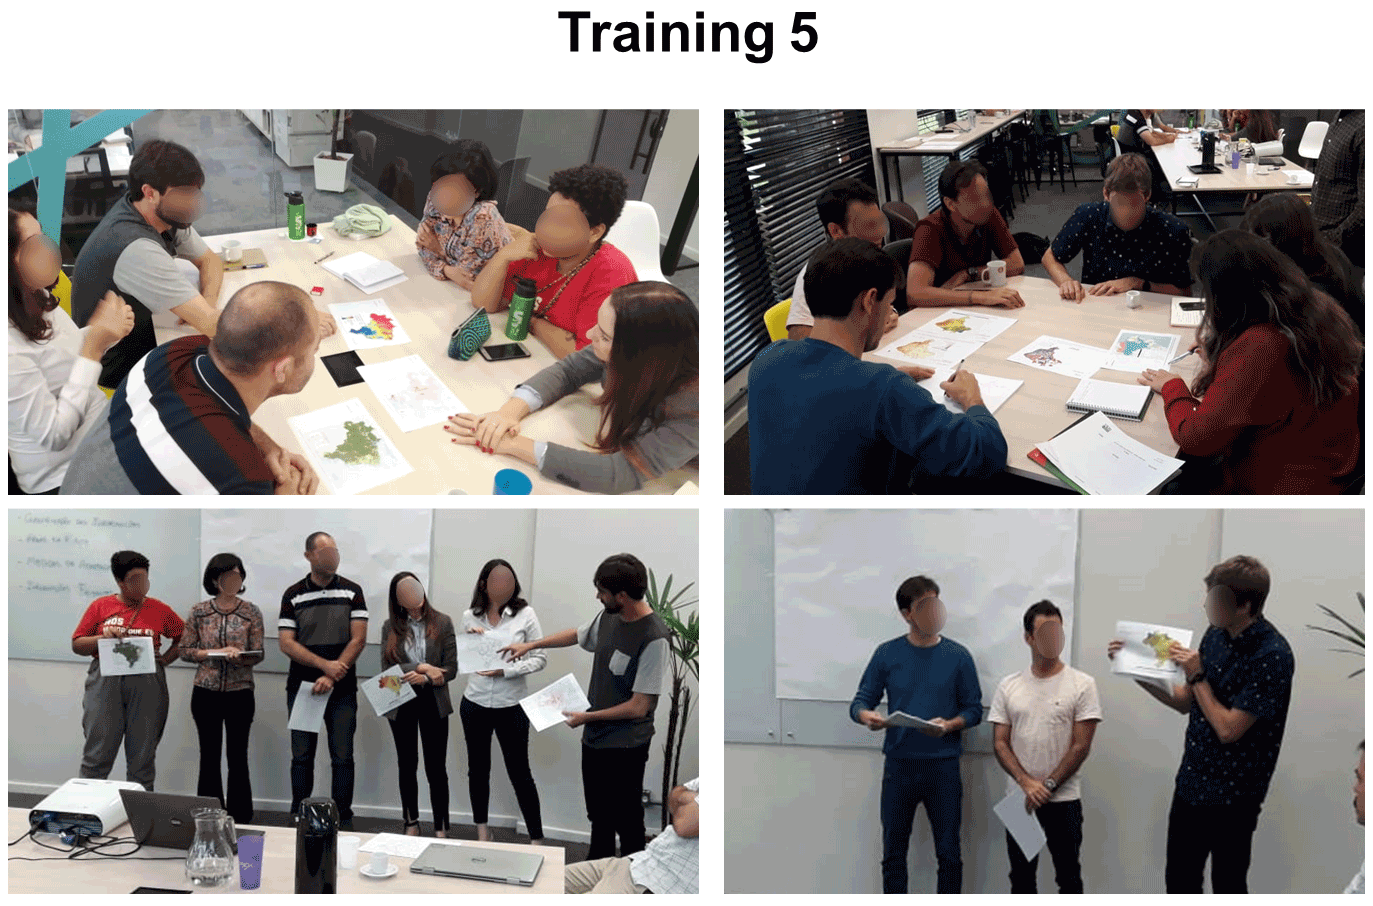
Training 5
-
Date: 21 October 2019
-
Institution: Secretary of Sustainable Economic Development of Santa Catarina State (SDE)
-
Number of participants: 12
-
Profile: technicians and decision makers
-
Duration: 4 h
-
Teaching modules: introduction to climate change and climate risk analysis
-
Documentation available: maps and photos of the activities
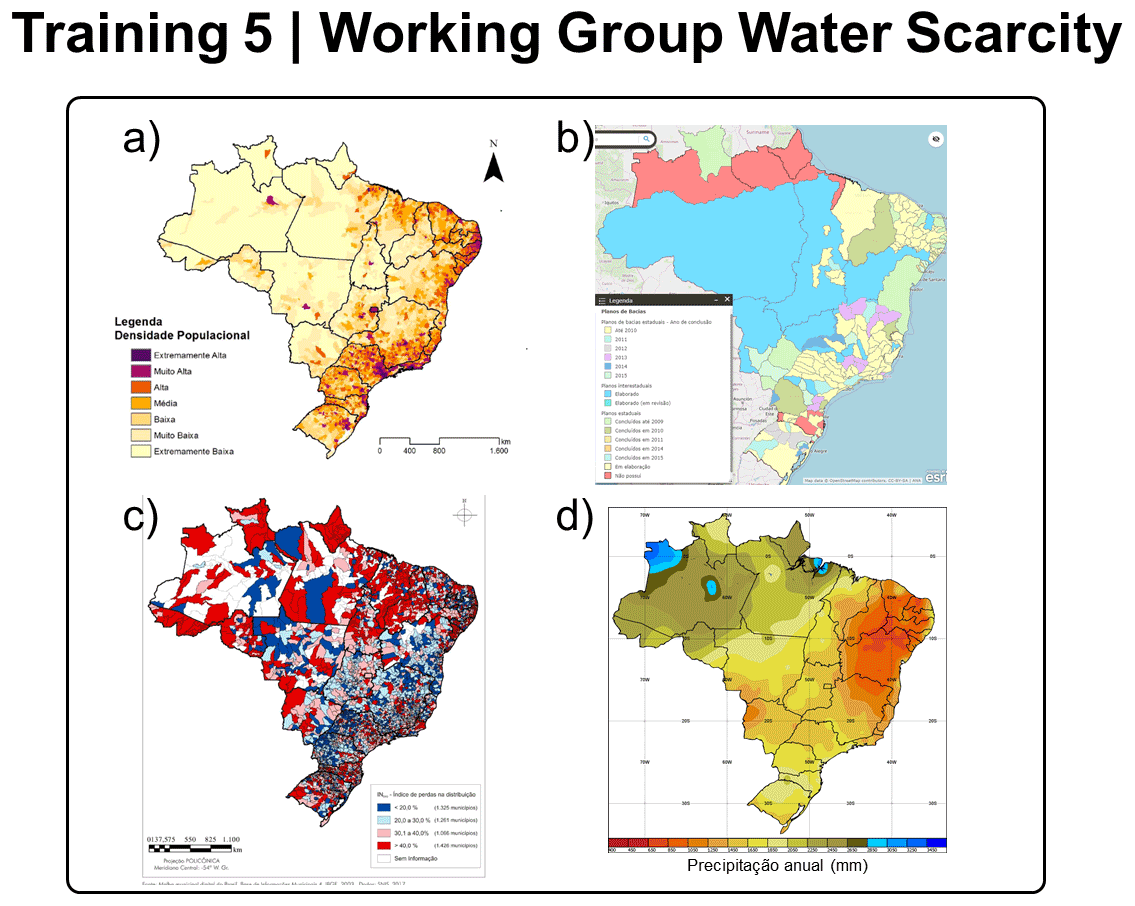
Figure A22Package of maps used in the fifth training for mapping climate risk associated with water scarcity. The maps illustrate (a) population density (MMA, 2017), (b) stage of implementation of the water resources planning (Planos de Recursos Hídricos, 2020), (c) water distribution loss index (Brasil, 2017), and (d) annual rainfall (Normais climatológicas do Brasil, 2020).
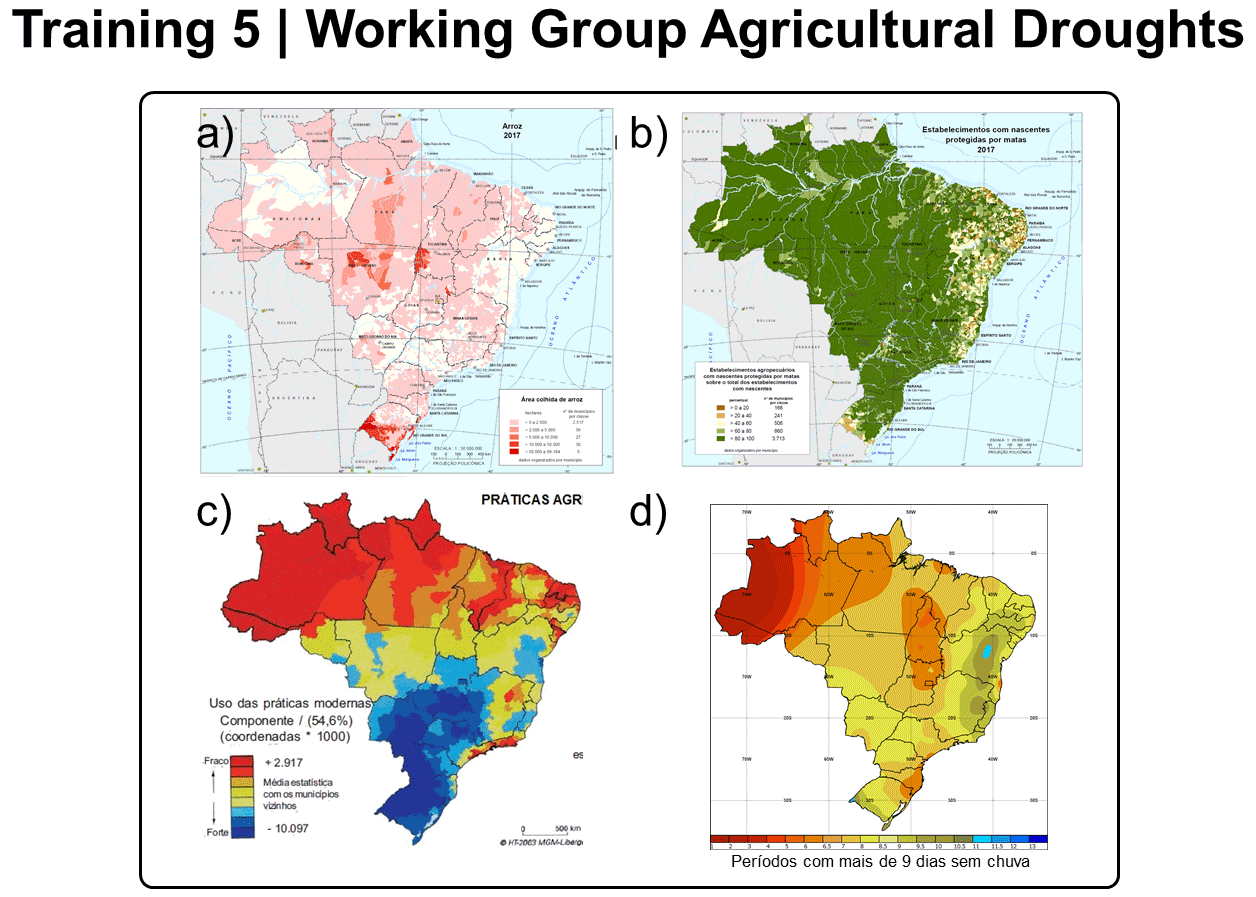
Figure A23Package of maps used in the fifth training for mapping climate risk associated with agricultural droughts. The maps illustrate (a) rice production (IBGE, 2019), (b) properties with protected water springs (IBGE, 2019), (c) use of modern practices in agriculture (Théry and Mello, 2018), and (d) number of dry spells longer than 9 d (Normais climatológicas do Brasil, 2020).
No primary data sets were used in producing this article.
The supplement related to this article is available online at: https://doi.org/10.5194/gc-4-527-2021-supplement.
PBdA and PLBC conceptualized and designed the research and delivered the training. PBdA prepared the paper, with critical input from PLBC.
The contact author has declared that neither they nor their co-author has any competing interests.
Publisher's note: Copernicus Publications remains neutral with regard to jurisdictional claims in published maps and institutional affiliations.
We thank Chang Hung Kiang and Leonardo Hoinaski for inviting us to deliver this training at UNESP and SDE, respectively. We would like to express our appreciation to all 94 participants, who have actively contributed to the improvement of this training. We acknowledge the Brazilian National Council for Scientific and Technological Development (Conselho Nacional de Desenvolvimento Científico e Tecnológico – CNPq) for funding this study.
This research has been supported by the Conselho Nacional de Desenvolvimento Científico e Tecnológico (grant no. 159528/2018–6).
This paper was edited by Sam Illingworth and reviewed by Christopher Skinner and one anonymous referee.
ANA: Estudos relativos às mudanças climáticas e recursos hídricos para embasar o Plano Nacional de Adaptação às mudanças climáticas, Agência Nacional de Águas (ANA) and Centro de Gestão e Estudo Estratégicos (CGEE), Brasília, DF, 2016.
Andrade, H. L.: A Critical Review of Research on Student Self-Assessment, Front. Educ., 4, 87, https://doi.org/10.3389/feduc.2019.00087, 2019.
Bailey, C. J. and Card, K. A.: Effective pedagogical practices for online teaching: Perception of experienced instructors, Internet High. Educ., 12, 152–155, https://doi.org/10.1016/j.iheduc.2009.08.002, 2009.
Boholm, Å. and Prutzer, M.: Experts' understandings of drinking water risk management in a climate change scenario, Climate Risk Management, 16, 133–144, https://doi.org/10.1016/j.crm.2017.01.003, 2017.
Borges de Amorim, P., Silva de Souza, K. I., and Borges Chaffe, P. L.: A web-based tool for synthesis assessments of the impacts of climate change on water resources, Environ. Modell. Softw., 133, 104848, https://doi.org/10.1016/j.envsoft.2020.104848, 2020.
Borges, P. A. and Chaffe, P. L. B.: Towards a comprehensive characterization of evidence in synthesis assessments: the climate change impacts on the Brazilian water resources, Climatic Change, 155, 37–57, https://doi.org/10.1007/s10584-019-02430-9, 2019.
Boud, D.: Enhancing learning through self assessment, Kogan Page, London, Philadelphia, 247 pp., 1995.
Brasil: Sistema Nacional de Informações sobre Saneamento: Diagnóstico dos Serviços de Água e Esgotos – 2017, Ministério do Desenvolvimento Regional, Secretaria Nacional de Saneamento – SNS, Brasília, DF, 2017.
Brazil: National Adaptation Plan to Climate Change: volume I: general strategy, Ministry of Environment (MMA), Brasília, 2016.
Buckler, C., Creech, H., and UNESCO: Shaping the Future We Want: UN Decade of Education for Sustainable Development (2005–2014): Final Report, United Nations Educational, Scientific and Cultural Organization, Paris, France, 198 pp., ISBN 978-92-3-100053-9, 2014.
Cadastro Nacional de Cursos e Instituições de Educação Superior: http://emec.mec.gov.br/, last access: 27 May 2020.
CEPED UFSC and World Bank: Relatório de danos materiais e prejuízos decorrentes de desastres naturais no Brasil: 1995–2014, Universidade Federal de Santa Catarina, Centro Universitário de Estudos e Pesquisas sobre Desastres (CEPED UFSC), Banco Mundial, 2016.
Cooperation with the IPCC: https://unfccc.int/topics/science/workstreams/cooperation-with-the-ipcc, last access: 10 March 2021.
Cursos da Pós-Graduação Stricto Sensu no Brasil [2017 a 2020]: https://dadosabertos.capes.gov.br/dataset/2017-a-2020-cursos-da-pos-graduacao-stricto-sensu-no-brasil, last access: 27 May 2020.
Damania, R., George, D. A., Jacobsen, M. P. S., Rodriguez, D. J., Glauber, A. J., and Ramos, Y. S.: Confronting a Changing Climate in Michoacan, The World Bank, Washington DC, 1–60, 2010.
Debortoli, N. S., Camarinha, P. I. M., Marengo, J. A., and Rodrigues, R. R.: An index of Brazil's vulnerability to expected increases in natural flash flooding and landslide disasters in the context of climate change, Nat. Hazards, 86, 557–582, https://doi.org/10.1007/s11069-016-2705-2, 2017.
Farnell, T., Skledar Matijević, A., and Šćukanec Schmidt, N.: The impact of COVID-19 on higher education: a review of emerging evidence, Publications Office of the European Union, Luxembourg, 70 pp., 2021.
Fernandez, G., Thi, T. T. M., and Shaw, R.: Climate Change Education: Recent Trends and Future Prospects, in: Education for Sustainable Development and Disaster Risk Reduction, edited by: Shaw, R. and Oikawa, Y., Springer Japan, Tokyo, 53–74, https://doi.org/10.1007/978-4-431-55090-7_4, 2014.
Flagg, J. A. and Kirchhoff, C. J.: Context matters: Context-related drivers of and barriers to climate information use, Climate Risk Management, 20, 1–10, https://doi.org/10.1016/j.crm.2018.01.003, 2018.
George, D. A., Clewett, J. F., Selvaraju, R., and Birch, C.: Applied Climate Education and Training for Agricultural and Natural Resource Management in India, Indonesia, Zimbabwe and Australia, The Journal of Agricultural Education and Extension, 12, 141–157, https://doi.org/10.1080/13892240600861674, 2006.
George, D. A., Clewett, J., Birch, C., Wright, A., and Allen, W.: A professional development climate course for sustainable agriculture in Australia, Environ. Educat. Res., 15, 417–441, https://doi.org/10.1080/13504620902946978, 2009.
George, D. A., Tan, P.-L., and Clewett, J. F.: Identifying needs and enhancing learning about climate change adaptation for water professionals at the post-graduate level, Environ. Educat. Res., 22, 62–88, https://doi.org/10.1080/13504622.2014.979136, 2016.
George, D. A., Clewett, J. F., Lloyd, D., McKellar, R., Tan, P.-L., Howden, M., Rickards, L., Ugalde, D., and Barlow, S.: Research priorities and best practices for managing climate risk and climate change adaptation in Australian agriculture, Australas. J. Env. Ma., 26, 6–24, https://doi.org/10.1080/14486563.2018.1506948, 2019.
Grove, M., Overton, T., University of Birmingham, and STEM Education Centre: Getting started in pedagogic research within the STEM disciplines, University of Birmingham, Birmingham, 1–74, 2013.
IBGE: Perfil dos municípios brasileiros, IBGE, Coordenação de População e Indicadores Sociais, Rio de Janeiro, 1–106, ISBN: 978-85-240-4462-5, 2017.
IBGE: Censo agropecuário: resultados definitivos 2017, Instituto Brasileiro de Geografia e Estatistica (IBGE), Rio de Janeiro, 1–109, ISSN: 0103-6157, 2019.
IPCC: Climate change 2014: impacts, adaptation, and vulnerability: Working Group II contribution to the fifth assessment report of the Intergovernmental Panel on Climate Change, Cambridge University Press, New York, NY, 1–1132, ISBN 978-1-107-05807-1, 2014.
IPCC: Summary for Policymakers, in: Global Warming of 1.5 ∘C. An IPCC Special Report on the impacts of global warming of 1.5 ∘C above pre-industrial levels and related global greenhouse gas emission pathways, in the context of strengthening the global response to the threat of climate change, sustainable development, and efforts to eradicate poverty, edited by: Masson-Delmotte, V., Zhai, P., Pörtner, H.-O., Roberts, D., Skea, J., Shukla, P. R., Pirani, A., Moufouma-Okia, W., Péan, C., Pidcock, R., Connors, S., Matthews, J. B. R., Chen, Y., Zhou, X., Gomis, M. I., Lonnoy, E., Maycock, T., Tignor, M., and Waterfield T., World Meteorological Organization, Geneva, Switzerland, 32, 1–24, 2018.
ISO: Risk Management Guidelines, 31000:2018, International Organization for Standardization, Geneva, Switzerland, 2018.
Jiménez Cisneros, B. E., Oki, T., Arnell, N. W., Benito, G., Cogley, J. G., Döll, P., Jiang, T., and Mwakalila, S. S.: Freshwater resources, in: Climate Change 2014: Impacts, Adaptation, and Vulnerability. Part A: Global and Sectoral Aspects, Contribution of Working Group II to the Fifth Assessment Report of the Intergovernmental Panel on Climate Change, Cambridge University Press, Cambridge, United Kingdom and New York, NY, USA, 229–269, 2014.
Katz-Buonincontro, J. and Anderson, R. C.: How Do We Get From Good to Great? The Need for Better Observation Studies of Creativity in Education, Front. Psychol., 9, 2342, https://doi.org/10.3389/fpsyg.2018.02342, 2018.
Kolb, D. A.: Experiential learning: experience as the source of learning and development, 2nd Edn., Pearson Education, Upper Saddle River, New Jersey, 390 pp., 2015.
Kruger, J. and Dunning, D.: Unskilled and unaware of it: How difficulties in recognizing one's own incompetence lead to inflated self-assessments, J. Pers. Soc. Psychol., 77, 1121–1134, https://doi.org/10.1037/0022-3514.77.6.1121, 1999.
Leal Filho, W. and Hemstock, S. L. (Eds.): Climate Change Education: An Overview of International Trends and the Need for Action, in: Climate Change and the Role of Education, Springer International Publishing, Cham, 1–17, https://doi.org/10.1007/978-3-030-32898-6_1, 2019.
Leal Filho, W. L. (Ed.): Climate Change at Universities: Results of a World Survey, in: Universities and Climate Change, Springer Berlin Heidelberg, Berlin, Heidelberg, 1–19, https://doi.org/10.1007/978-3-642-10751-1_1, 2010.
Lindorff, A. and Sammons, P.: Going beyond structured observations: looking at classroom practice through a mixed method lens, ZDM Mathematics Education, 50, 521–534, https://doi.org/10.1007/s11858-018-0915-7, 2018.
Lyon, S. W. and Teutschbein, C.: Problem-Based Learning and Assessment in Hydrology Courses: Can Non-Traditional Assessment Better Reflect Intended Learning Outcomes?, Journal of Natural Resources and Life Sciences Education, 40, 199–205, https://doi.org/10.4195/jnrlse.2011.0016g, 2011.
Lyon, S. W., Walter, M. T., Jantze, E. J., and Archibald, J. A.: Training hydrologists to be ecohydrologists: a “how-you-can-do-it” example leveraging an active learning environment for studying plant–water interaction, Hydrol. Earth Syst. Sci., 17, 269–279, https://doi.org/10.5194/hess-17-269-2013, 2013.
Macdonald, R. and Savin-Baden, M.: A Briefing on Assessment in Problem-based Learning, Learning and Teaching Support Network (LTSN), Heslington, York, UK, 1–24, 2004.
May, T. S.: Elements of Success in Environmental Education Through Practitioner Eyes, The Journal of Environmental Education, 31, 4–11, https://doi.org/10.1080/00958960009598639, 2000.
McBean, G. and Rodgers, C.: Climate hazards and disasters: the need for capacity building: Climate hazards and disasters, WIREs Clim. Change, 1, 871–884, https://doi.org/10.1002/wcc.77, 2010.
McCright, A. M., O'Shea, B. W., Sweeder, R. D., Urquhart, G. R., and Zeleke, A.: Promoting interdisciplinarity through climate change education, Nat. Clim. Change, 3, 713–716, https://doi.org/10.1038/nclimate1844, 2013.
McNamara, K. E.: Raising awareness about climate change in Pacific communities, Environ. Educ. Res., 19, 864–871, https://doi.org/10.1080/13504622.2013.769046, 2013.
Mira-Salama, D., Damania, R., Pedrozo-Acuna, A., and Scandizzo, P. L.: Campeche Mexico -Case of climate change adaptation: uncertain future, robust decisions, The World Bank, Washington DC, 1–54, 2013.
MMA: Índice de vulnerabilidade aos desastres naturais relacionados às secas no contexto da mudança do clima, Ministério do Meio Ambiente (MMA), Brasília, DF, 2017.
Mohadjer, S., Mutz, S. G., Kemp, M., Gill, S. J., Ischuk, A., and Ehlers, T. A.: Using paired teaching for earthquake education in schools, Geosci. Commun., 4, 281–295, https://doi.org/10.5194/gc-4-281-2021, 2021.
Nobre, C. A., Marengo, J. A., and Soares, W. R. (Eds.): Climate Change Risks in Brazil, Springer International Publishing, Cham, https://doi.org/10.1007/978-3-319-92881-4, 2019.
Normais climatológicas do Brasil: http://www.inmet.gov.br/portal/index.php?r=clima/normaisClimatologicas, last access: 20 May 2020.
Orrill, C. H.: Supporting Online PBL: Design Considerations for Supporting Distributed Problem Solving, Distance Education, 23, 41–57, https://doi.org/10.1080/01587910220123973, 2002.
Pierce, C.: Realities of Teaching Climate Change in a Pacific Island Nation, in: Climate Change and the Role of Education, edited by: Leal Filho, W. and Hemstock, S. L., Springer International Publishing, Cham, 319–347, https://doi.org/10.1007/978-3-030-32898-6_18, 2019.
Planos de Recursos Hídricos: https://portal1.snirh.gov.br/ana/apps/webappviewer/index.html?id=29ef3cf04a584c0da35cf267ae69d0ea, last access: 20 May 2020.
Preston, B. L., Yuen, E. J., and Westaway, R. M.: Putting vulnerability to climate change on the map: a review of approaches, benefits, and risks, Sustain Sci., 6, 177–202, https://doi.org/10.1007/s11625-011-0129-1, 2011.
Prince, M.: Does Active Learning Work? A Review of the Research, J. Eng. Educat., 93, 223–231, https://doi.org/10.1002/j.2168-9830.2004.tb00809.x, 2004.
Pruneau, D., Kerry, J., Blain, S., Evichnevetski, E., Deguire, P., Barbier, P.-Y., Freiman, V., Therrien, J., Langis, J., and Lang, M.: Competencies Demonstrated by Municipal Employees During Adaptation to Climate Change: A Pilot Study, J. Environ. Educat., 44, 217–231, https://doi.org/10.1080/00958964.2012.759521, 2013.
Raucher, K., Raucher, R., Ozekin, K., and Wegner, K.: The Opportunities and Needs of Water Utility Professionals as Community Climate–Water Leaders, Weather Clim. Soc., 10, 51–58, https://doi.org/10.1175/WCAS-D-17-0061.1, 2018.
Reid, A.: Climate change education and research: possibilities and potentials versus problems and perils?, Environ. Educat. Res., 25, 767–790, https://doi.org/10.1080/13504622.2019.1664075, 2019.
Santa Catarina: Política Estadual sobre Mudanças Climáticas e Desenvolvimento Sustentável de Santa Catarina, available at: http://leis.alesc.sc.gov.br/html/2009/14829_2009_lei.html (last access: 20 September 2021), 2009.
Sherbinin, A. D., Bukvic, A., Rohat, G., Gall, M., McCusker, B., Preston, B., Apotsos, A., Fish, C., Kienberger, S., Muhonda, P., Wilhelmi, O., Macharia, D., Shubert, W., Sliuzas, R., Tomaszewski, B., and Zhang, S.: Climate vulnerability mapping: A systematic review and future prospects, WIREs Clim. Change, 10, 1–23, https://doi.org/10.1002/wcc.600, 2019.
Strobl, B., Etter, S., van Meerveld, H. J. I., and Seibert, J.: Training citizen scientists through an online game developed for data quality control, Geosci. Commun., 3, 109–126, https://doi.org/10.5194/gc-3-109-2020, 2020.
Sutton, R. T.: Climate Science Needs to Take Risk Assessment Much More Seriously, B. Am. Meteorol. Soc., 100, 1637–1642, https://doi.org/10.1175/BAMS-D-18-0280.1, 2019.
Taras, M.: Student self-assessment: processes and consequences, Teach. High. Educat., 15, 199–209, https://doi.org/10.1080/13562511003620027, 2010.
Théry, H. and Mello, N. A.: Atlas do Brasil disparidades e dinâmicas do território, 3rd Edn., Editora da Universidade de São Paulo (USP), São Paulo, 392 pp., 2018.
Torres, R. R., Lapola, D. M., Marengo, J. A., and Lombardo, M. A.: Socio-climatic hotspots in Brazil, Climatic Change, 115, 597–609, https://doi.org/10.1007/s10584-012-0461-1, 2012.
Travis, W. R. and Bates, B.: What is climate risk management?, Clim. Risk Manage., 1, 1–4, https://doi.org/10.1016/j.crm.2014.02.003, 2014.
UFSC: Currículo do Curso de Graduação em Engenharia Sanitária e Ambiental da UFSC, available at: https://ens.paginas.ufsc.br/files/2014/12/Curriculo-20151.pdf (last access: 1 November 2021), 2014.
UNESCO: Education for sustainable development goals: learning objectives, Report, UNESCO, Paris, France, 1–68, ISBN: 978-92-3-100209-0, 2017.
United Nations: The Sustainable Development Goals Report 2016, United Nations, New York, 1–56, 2016.
Valaitis, R. K., Sword, W. A., Jones, B., and Hodges, A.: Problem-Based Learning Online: Perceptions of Health Science Students, Adv. Health Sci. Educ. Theory Pract., 10, 231–252, https://doi.org/10.1007/s10459-005-6705-3, 2005.
Weber, J. M., Lindenmeyer, C. P., Liò, P., and Lapkin, A. A.: Teaching sustainability as complex systems approach: a sustainable development goals workshop, Int. J. Sust. Higher Ed., 22, 25–41, https://doi.org/10.1108/IJSHE-06-2020-0209, 2021.
Wood, D. F.: ABC of learning and teaching in medicine: Problem based learning, BMJ, 326, 328–330, https://doi.org/10.1136/bmj.326.7384.328, 2003.
Yates, D. N., Miller, K. A., Wilby, R. L., and Kaatz, L.: Decision-centric adaptation appraisal for water management across Colorado's Continental Divide, Climate Risk Management, 10, 35–50, https://doi.org/10.1016/j.crm.2015.06.001, 2015.
Yen, B. T., Son, N. H., Tung, L. T., Amjath-Babu, T. S., and Sebastian, L.: Development of a participatory approach for mapping climate risks and adaptive interventions (CS-MAP) in Vietnam's Mekong River Delta, Clim. Risk Manage., 24, 59–70, https://doi.org/10.1016/j.crm.2019.04.004, 2019.