the Creative Commons Attribution 4.0 License.
the Creative Commons Attribution 4.0 License.
 | 30 Jul 2020
Fun educational and artistic teaching tools for science outreach
Marina Locritani
Silvia Merlino
Sara Garvani
Francesca Di Laura
The aim of scientific dissemination is to spread interest and knowledge of scientific issues by trying to reach people of all ages and social backgrounds. Simplifying, without trivializing, scientific concepts and making them attractive to the general public is therefore essential to achieve the previous objectives. For this purpose, it can be useful for scientists to work in close collaboration with artists, implementing new tools that can positively influence the emotional sphere and capture the attention of the people involved. Playful educational activity and visual language play a key role in this process, to convey interest and facilitate learning. An example of this approach are the educational laboratories structured as group games, in which great importance is given both to practical activities and to the transmission of concepts through their visualization in the form of images. Over the last 8 years, the Istituto Nazionale di Geofisica e Vulcanologia (National Institute of Geophysics and Volcanology, INGV), the Istituto di Scienze Marine del Consiglio Nazionale delle Ricerche (Institute of Marine Sciences of the National Research Council, CNR-ISMAR) and the Historical Oceanography Society (HOS) have collaborated in the organization of science dissemination events involving students from schools of different levels participating in educational experiences based on games, characterized by an essentially visual approach to the concepts presented. In this work, we would like to give a brief overview of these educational tools, retracing the choices made while ideating them, thanks mainly to the close collaboration with artists and illustrators.
- Article
(12369 KB) - Full-text XML
- BibTeX
- EndNote


Inspiring young people to take part in the discovery and delivery of science, technology, engineering and mathematics (STEM) has been proven to contribute significantly not only to their well-being, but also to their future human development (Bertram and Pascal, 2016; Morgan et al., 2016; Friedman-Krauss et al., 2018). In particular primary and secondary education were considered significant periods for the development of students' interest in science and technology (Maltese et al., 2014). In recent years, with the advance of the digital age and the use of technological tools (smartphones, tablets, etc.), now pervasive in particular among the new generations, great importance has been given to the development of strategies to promote their use in schools: an attempt has been made to convert them into useful means to promote information and knowledge, especially those related to STEM, and so to overcome the difficulties observed in the teaching–learning process (Souza et al., 2018).
However, in our opinion, the “physicality” of the experience is important, and, even more in the technological era, it is necessary to invest resources to create stimuli that involve students in real activities. The search for new strategies to communicate to students the importance of STEM is a fundamental step to improve their learning experience and to provide alternative teaching practices to teachers. On this basis, we asked ourselves the following question: is it possible to enhance the learning experiences of STEM disciplines for students (6–14-year-old students) using a visual approach that serves to stimulate interest in the proposed topics? Visual language has always been the most comprehensible for everyone; for this reason, a lot of modern (Cavallo and Favilli, 2016) and ancient (Merian, 1705) authors use images as a tool to convey scientific notions and findings. Since its origins, science has placed images at the centre of its communication processes: drawings, diagrams and then photographs, satellite images and films. Studies on the complexity of nature, the human figure and the technological innovation of famous people, such as Leonardo Da Vinci, highlight the scientific and, at the same time, artistic value of drawing. With the transition from the empirical to the experimental approach, images retain their value. Today researchers use images for the interpretation of collected data: in this way maps and diagrams become indispensable for the scientific process. In parallel, some of these images for their uniqueness can be considered works of art (such as those of Hooke, 2018). Moreover, in recent years, two strongly conditioning factors have taken over in modern communication: the amount of information and speed at which we are exposed to it. In this fast-paced world, not only for adults but also for children, it is clear how much more effective a message conveyed by an image is than the text and how much faster it is learned. By now, in fact, the effectiveness of images is universally recognized not only in the communicative-advertising field, where they have always been widely used and even more so in modern society, constantly exposed to visual information in the form of video or images, but also in the world of scientific communication.
For 16 years now, on an annual basis, the Science Technology and Observa Science in Society Monitor (https://www.observa.it/, last access: 22 July 2020) has been monitoring the development of so-called “scientific literacy”, i.e. the level of scientific knowledge of citizens. Much less studied is the so-called visual scientific literacy. In 2016, an empirical survey was conducted on this topic on a representative sample of the Italian population: the interviewees were offered three classic images related to science and technology, in regards to a series of questions of scientific competence (Bucchi and Saracino, 2016). With regard to the matter under investigation it emerges that the level of scientific literacy decreases with increasing age and increases with increasing education. From the point of view of the effectiveness of the visual approach, the results show that 80 % of respondents were able to recognize the images correctly, compared to 60 % who were able to answer the equivalent questions. Moreover, the images, unlike the questions, aroused emotional reactions such as “curiosity”, but also “beauty” and “fear”. This highlights the enormous potential of the visual component in scientific communication, whose characteristics, dynamics and means of dissemination must be fully understood in order to obtain even more significant results.
The cooperation of such different worlds, such as art and science, and the exchange between the two points of view allow the disseminator to develop a new approach to scientific issues, generating a common language that transforms complex concepts into visual messages that can be understood by all. In particular, in order to capture the attention of children, the goal is to create games that convey, through images and oral explanation, in an emotional and non-rational way, information related not only to scientific knowledge but also to the learning of virtuous behaviour, which will allow new generations to become adults more aware of the environment in which they live, how to use it and how to preserve it.
This document is organized as follows: Sect. 2 addresses the problem of teaching and dissemination of scientific culture and presents a description of the methodological approach we propose; Sect. 3 describes the characteristics of the different edutainment tools implemented, with particular attention paid to the different graphic choices adopted according to the aim to be achieved; Sect. 4 describes, as a case study, a “work-related learning internship” that we carried out using one of our educational tools and reports the result of a questionnaire that we submitted to the students at the end of the activities; Sect. 5 summarizes the main conclusions on what has been done in recent years, and the future prospects.
2.1 The importance of teaching science in today's scenario
Recommendation 2006/962/EC makes explicit the EC support to each member state for the development of education and training strategies that follow a specific and harmonized path offering everyone the opportunity to develop their basic competence in the form of knowledge, skills, abilities and attitudes, while engaging in active and democratic participation in society (especially in increasingly diverse societies). STEM competence is the third of the eight key kinds of competence that this recommendation has identified as fundamental for each individual in a knowledge-based society, because science is one of the most remarkable achievements of human culture and must be shared with all, especially when extreme specialization of scientific disciplines and complexity of their results seem to hopelessly increase the gap between science and the average person (Wilgenbus and Lena, 2011). Unfortunately, the special edition of the 2014 Eurobarometer on public perception of science, research and innovation indicates, especially for the Italian population, a low interest in science and therefore a lack of confidence in the potential of research (Special Eurobarometer 419 Report, 2014). In particular, a large number of European (79 %) and Italian (69 %) people are very interested and confident in new scientific discoveries and technological developments; however there are a number of respondents who do not feel as well informed (52 % Italians, 50 % Europeans). A low percentage (31 %) of Italians and even fewer Europeans (22 %) believe that science can solve any kind of problem; a part of the population (52 % Italians, 58 % Europeans) would like researchers to be more involved in the transmission of scientific discoveries and new technological developments. Another important fact is that 75 % of respondents believe that science prepares future generations to act as aware citizens, and many citizens (65 % Italians, 66 % Europeans) think that the government should stimulate more young people's interest in science to a greater extent. Finally, a high percentage of Italians (71 %) and Europeans (75 %) agree that if women were more represented in positions of power in research institutions, research would be conducted in a better way.
The Eurobarometer, therefore, confirms a situation of “disconnection” between civil society and science, which, being one of the most remarkable expressions of the realization of human culture, should, instead, be shared with everyone, especially when the high level of complexity of the results could further increase this gap (Wilgenbus and Léna, 2011).
How to act, therefore, effectively? One solution would be fostering education, awareness and dissemination through simple and attractive channels capable of reaching every level of society and different age groups, with particular attention to the younger generations. As already stated in the previous paragraph, currently it emerges that the level of scientific literacy decreases with increasing age and increases with increasing education (Bucchi and Saracino, 2016); therefore, the importance of planning a process of scientific literacy from early school years is evident. Unfortunately, in several countries, such as the United Kingdom, STEM topics do not appear on the timetables of pupils of primary or lower secondary school (Bianchi and Chippindall, 2018). This gap could be filled by giving schools the opportunity to be involved in extracurricular programmes, promoted by researchers or educational trainers with scientific expertise, always taking into account the prerogatives of children of that age. Kids are an important vector for messages aimed at social change: it is therefore unthinkable not to take into account attitudes and decisions that will inevitably affect the environment and civilization of the future (Hartley et al., 2015).
2.2 How to foster STEM education?
2.2.1 Learning through play
By playing, we learn to learn. This concept was introduced in the 1970s by Gregory Bateson (Bateson, 1970) and is generally used to indicate the acquisition of a learning method that produces a change in the person. The game can therefore be thought of as one of the simple and attractive channels mentioned in the previous paragraph. It is necessary to underline the importance of the relational factor of learning, which implies the interpretation of the experience lived through patterns learned in contexts of communication and interaction with others (Vygotskij, 1933).
In this context, playing with an expert, whether an adult or a peer, takes on great educational importance and is the very driver of the child's development. Moreover, through play, we learn that we can give different interpretations of the world around us (Braglia, 2011), and this helps children to grow up critical and more aware of the problems they will have to face. For this reason, it is important to also introduce, among school teaching methods, the involvement of students in educational activities through a playful scientific approach.
These activities must not replace the classroom lessons, books and tests (Shapiro et al., 2014), but they have to provide another parallel and sporadic learning strategy: a way to provide the differentiated learning experiences that students require to find their inner motivation and fulfil their potential. In this framework, it is important to include visual and tactile stimuli, to encourage and enhance the ability to observe, pay attention and memorize concepts (Renninger and Su, 2012). Moreover, it is important to focus on the visual aspect of the proposed tools, as emotions deeply affect our cognitive aspects: a welfare state has positive effects on learning ability, memory and creativity (Ellis et al., 1984). In fact, several studies have underlined how the human capacity to understand is based not only on the faculty of reasoning, i.e. logic, but also (and above all) on emotional mechanisms (Kahneman, 2012). Life experiences create somatic markers related to emotions that guide us in decision making for successive events (Damasio, 1994). Affective neuroscience – that studies brain emotions through non-invasive techniques of “imaging” – has shown that positive emotional states are developed (such as optimism and joy) when the amygdala and the right prefrontal lobe raise their activity levels (Davidson, 2002). Similarly, studies on the brain biochemistry locate in the forebrain most of the neuropeptide and neurotransmitter activities as well as the receptors responsible for the physiological sensations of well-being (Pert, 1999). Daniel Goleman (Goleman, 1996) clearly defines “emotional intelligence” and social-emotional learning as a balanced mix of motivation, empathy, logic and self-control. This should be taken into account in order to develop much more effective and appropriate methods of science communication and education, depending on the interlocutors (age, nationality, previous knowledge, gender, etc.).
2.2.2 The use of visual arts as a support for science education
If, as we have seen, the game can be useful from a relational point of view, especially among children and teenagers, it is also necessary to establish a language that is common to all involved, if we want our teaching methods and tools to be as sharable as possible. A common and comprehensible language for everyone can be found in visual arts; however translation of concepts in images which everyone can understand and memorize, also under an emotional point of view, can be quite a challenging task, especially when the objective is suggesting changes in mentality or building a learning process. In fact, it is difficult to assess and predict some key aspects related to human vision. For example, how visual information is perceived is affected by the specific training of each one and contingent upon historical, geographical and cultural circumstance. Moreover, the personal experience allows us to emotionally differently interpret the images (Geymonat, 2011). In any case, graphic art has become effective in many different situations, and this has made it the preferred language of the new generation.
For this reason, we decided to strongly characterize our educational tools focusing not only on the contents, but also on the graphic aspect, trying to express as much as possible the concepts and themes proposed through visual approaches, and making them pleasant and suitable, from a graphic point of view, to an audience of children. The choice of drawings, layout and colours followed these considerations, leading to the adoption of different graphic/artistic techniques, depending on the target audience and the means of communication. In the following paragraphs, we would like to present four of the products currently made, namely three educational games and a graphic questionnaire.
The four activities that we present were developed over 9 years, from 2011 to 2020. These are
-
three customized games to achieve specific learning goals for edutainment activities and
-
one visual questionnaire (for evaluation of children's science perception).
The first edutainment activity (“Octopus game”) is specially designed for reaching children and students of primary schools. The second one (“INGV-memory game”) is designed for students of low secondary school (middle school), and the third proposed game, “Mareopoli”, for the content presented, proves to be more suitable for high school students. This division by age is to be considered strict if the game is played by the students at home alone or with their parents, but it is more elastic if the game is played directly by a skilled facilitator (researcher or teacher) who can modulate the difficulty of the questions and answers but not changing the content. The last tool, the graphic questionnaire, is intended for very young children.
The starting point, for each designed tool, has been the definition of the educational goal, which was different in the four cases: in the Octopus game the objective was the dissemination of knowledge regarding marine environmental protection and some basic notions of marine biology and ecology; with INGV-memory we wanted to give relevance to the three main lines of research developed by the INGV: earthquakes, volcanoes and environment; in Mareopoli the objective was, instead, to enhance the historical oceanographic heritage, extrapolating from ancient texts the evolution of the tide theory and comparing it with the contemporary scientific explanation; finally, with the VISUAL QUESTIONNAIRE, we would like to investigate the perception of science and scientists in very young children, such as primary school students or preschoolers. The three games illustrated in this paper are explained in a short video: https://www.youtube.com/watch?v=DX6au97UP3A&t=128s (last access: 22 July 2020).
Once we defined the educational goal, we chose the type of game to be inspired to develop the structure of the didactic tool. For the three board games, we have chosen the Game of the Goose for the first one, Memory® of Ravensburger for the second one and Monopoly® of Hasbro for the last one. In all three cases, we added, to the standard structure of the game, specific scientific information and questions, and we planned it so that it could be played by two teams.
We have considered it important to divide the players into teams, in order to establish a competitive dynamic among children, but without mortifying a single player in case they cannot answer the questions correctly. The games have been designed and built in two formats, laboratory mode and game kit, in order to consent to be used in two ways: under the guidance of trainers (researchers, teachers or suitably educated young people during peer education approaches) during the didactic workshops, or independently (or under the guidance of their parents) at home. For the first purpose (laboratory mode), therefore, boards and related playing cards have been realized in a very large format, suitable to be placed on the floor, in order to give the opportunity to children to feel more involved during the activity and better visualize the drawings without losing attention. At the same time, “tabletop” formats (game kit) have also been prepared, to be distributed as gifts to the workshop participants, inviting them to disclose, in turn, the information acquired during the activity to friends and relatives. Moreover, for Mareopoli a dissemination book to supplement the information was made (Locritani and Garvani, 2020).
The realization of the materials was made thanks to a close collaboration with the graphic designers, who have translated into images the researchers' ideas.
For their part, researchers initially had to simplify without trivializing the concepts and devise understandable, but at the same time engaging and informative, questions. The graphic designers tried to visually imagine the questions and concepts, proposing solutions and graphic styles suitable for the age group for which the game was intended and the topics addressed. This part of the design was very interesting for both researchers and designers, but not at all simple (Fig. 1).
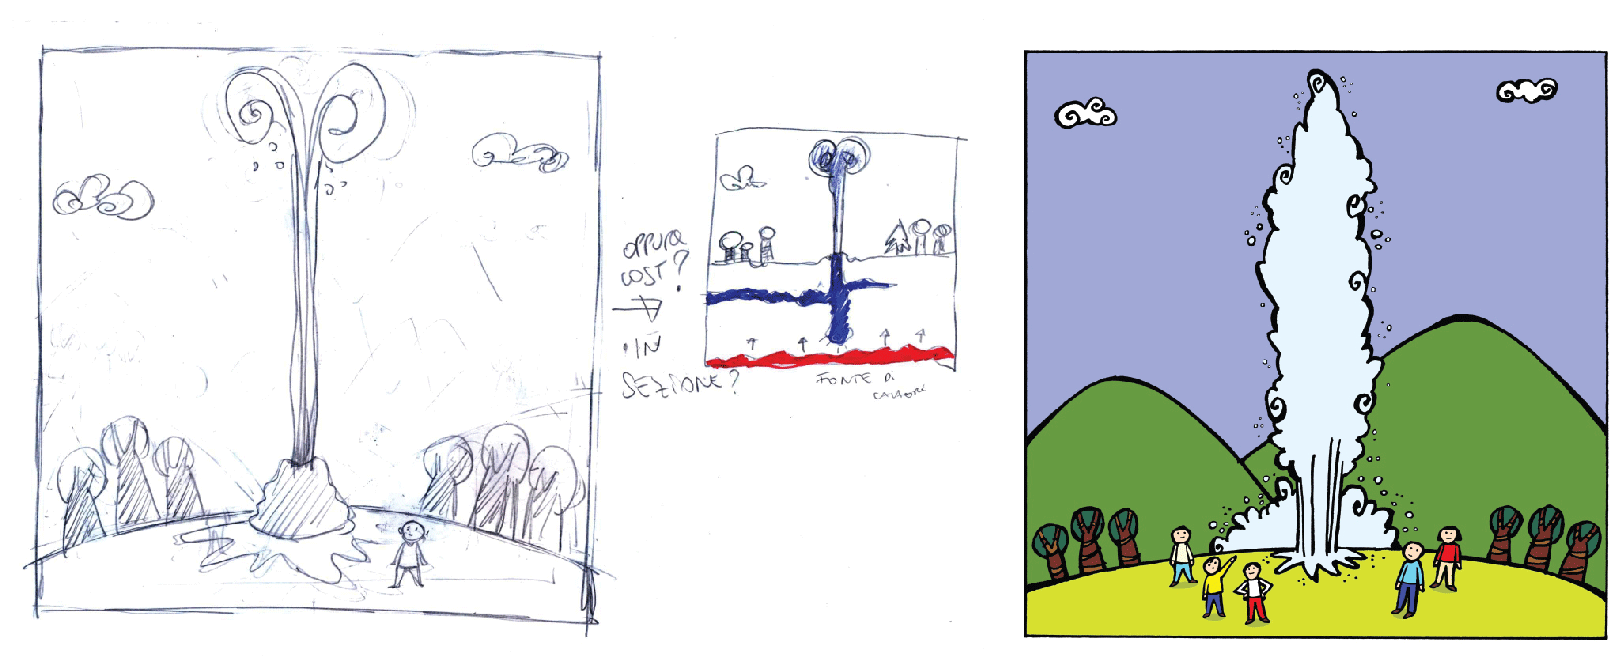
Figure 1Memory graphic draft for the geyser playing card. The artist proposed two different solutions to the researcher and together decided on the final illustration (illustration made by Consuelo Zatta).
In fact, a scientific concept or argument can already be intrinsically not easy and immediate to understand, and trying to express it through a static image is not immediate. In this context the expressive capacity and universality of art comes into play, which often manages to reach where words do not arrive. In some cases, the images only had to be the background to the scientific theme; but even in this case, the choice of how to represent it and make it attractive stimulated the minds of researchers and artists involved in this task. In other more difficult cases, the graphic itself had to indicate and help to understand the concept or the application submitted: the teamwork between the two different skills was, thus, particularly important and essential, including continuous adjustments and corrections, until obtaining a final product that could meet the graphic and conceptual requirements.
3.1 Specific description of didactic tools
3.1.1 Octopus game
The Octopus game, based on the traditional Game of the Goose, consists of a big board of 2 m × 2 m, containing a round track with 20 spaces numbered anticlockwise. Three colours have been used for the different spaces, associated with three different topics. Some spaces have symbols that correspond to specific indications of how to move inside the board. Each space has a different question, indicated in a separate game kit (Fig. 2). When choosing the graphic layout, drawings, accessories (dice, placeholders) and colours for this game, the preferences of children of the age in question have been taken into account, thanks to the experience of the involved illustrators and researchers in this field. The spaces have three possible colours: blue, green and yellow, each one corresponding to a specific topic: water column, life in the sea, and coast and seabed. The best-known characteristics of animals have been used to indicate the special spaces such as, for example, shrimp, which makes the player jump two spaces, or jellyfish, which makes the player stop for a round.
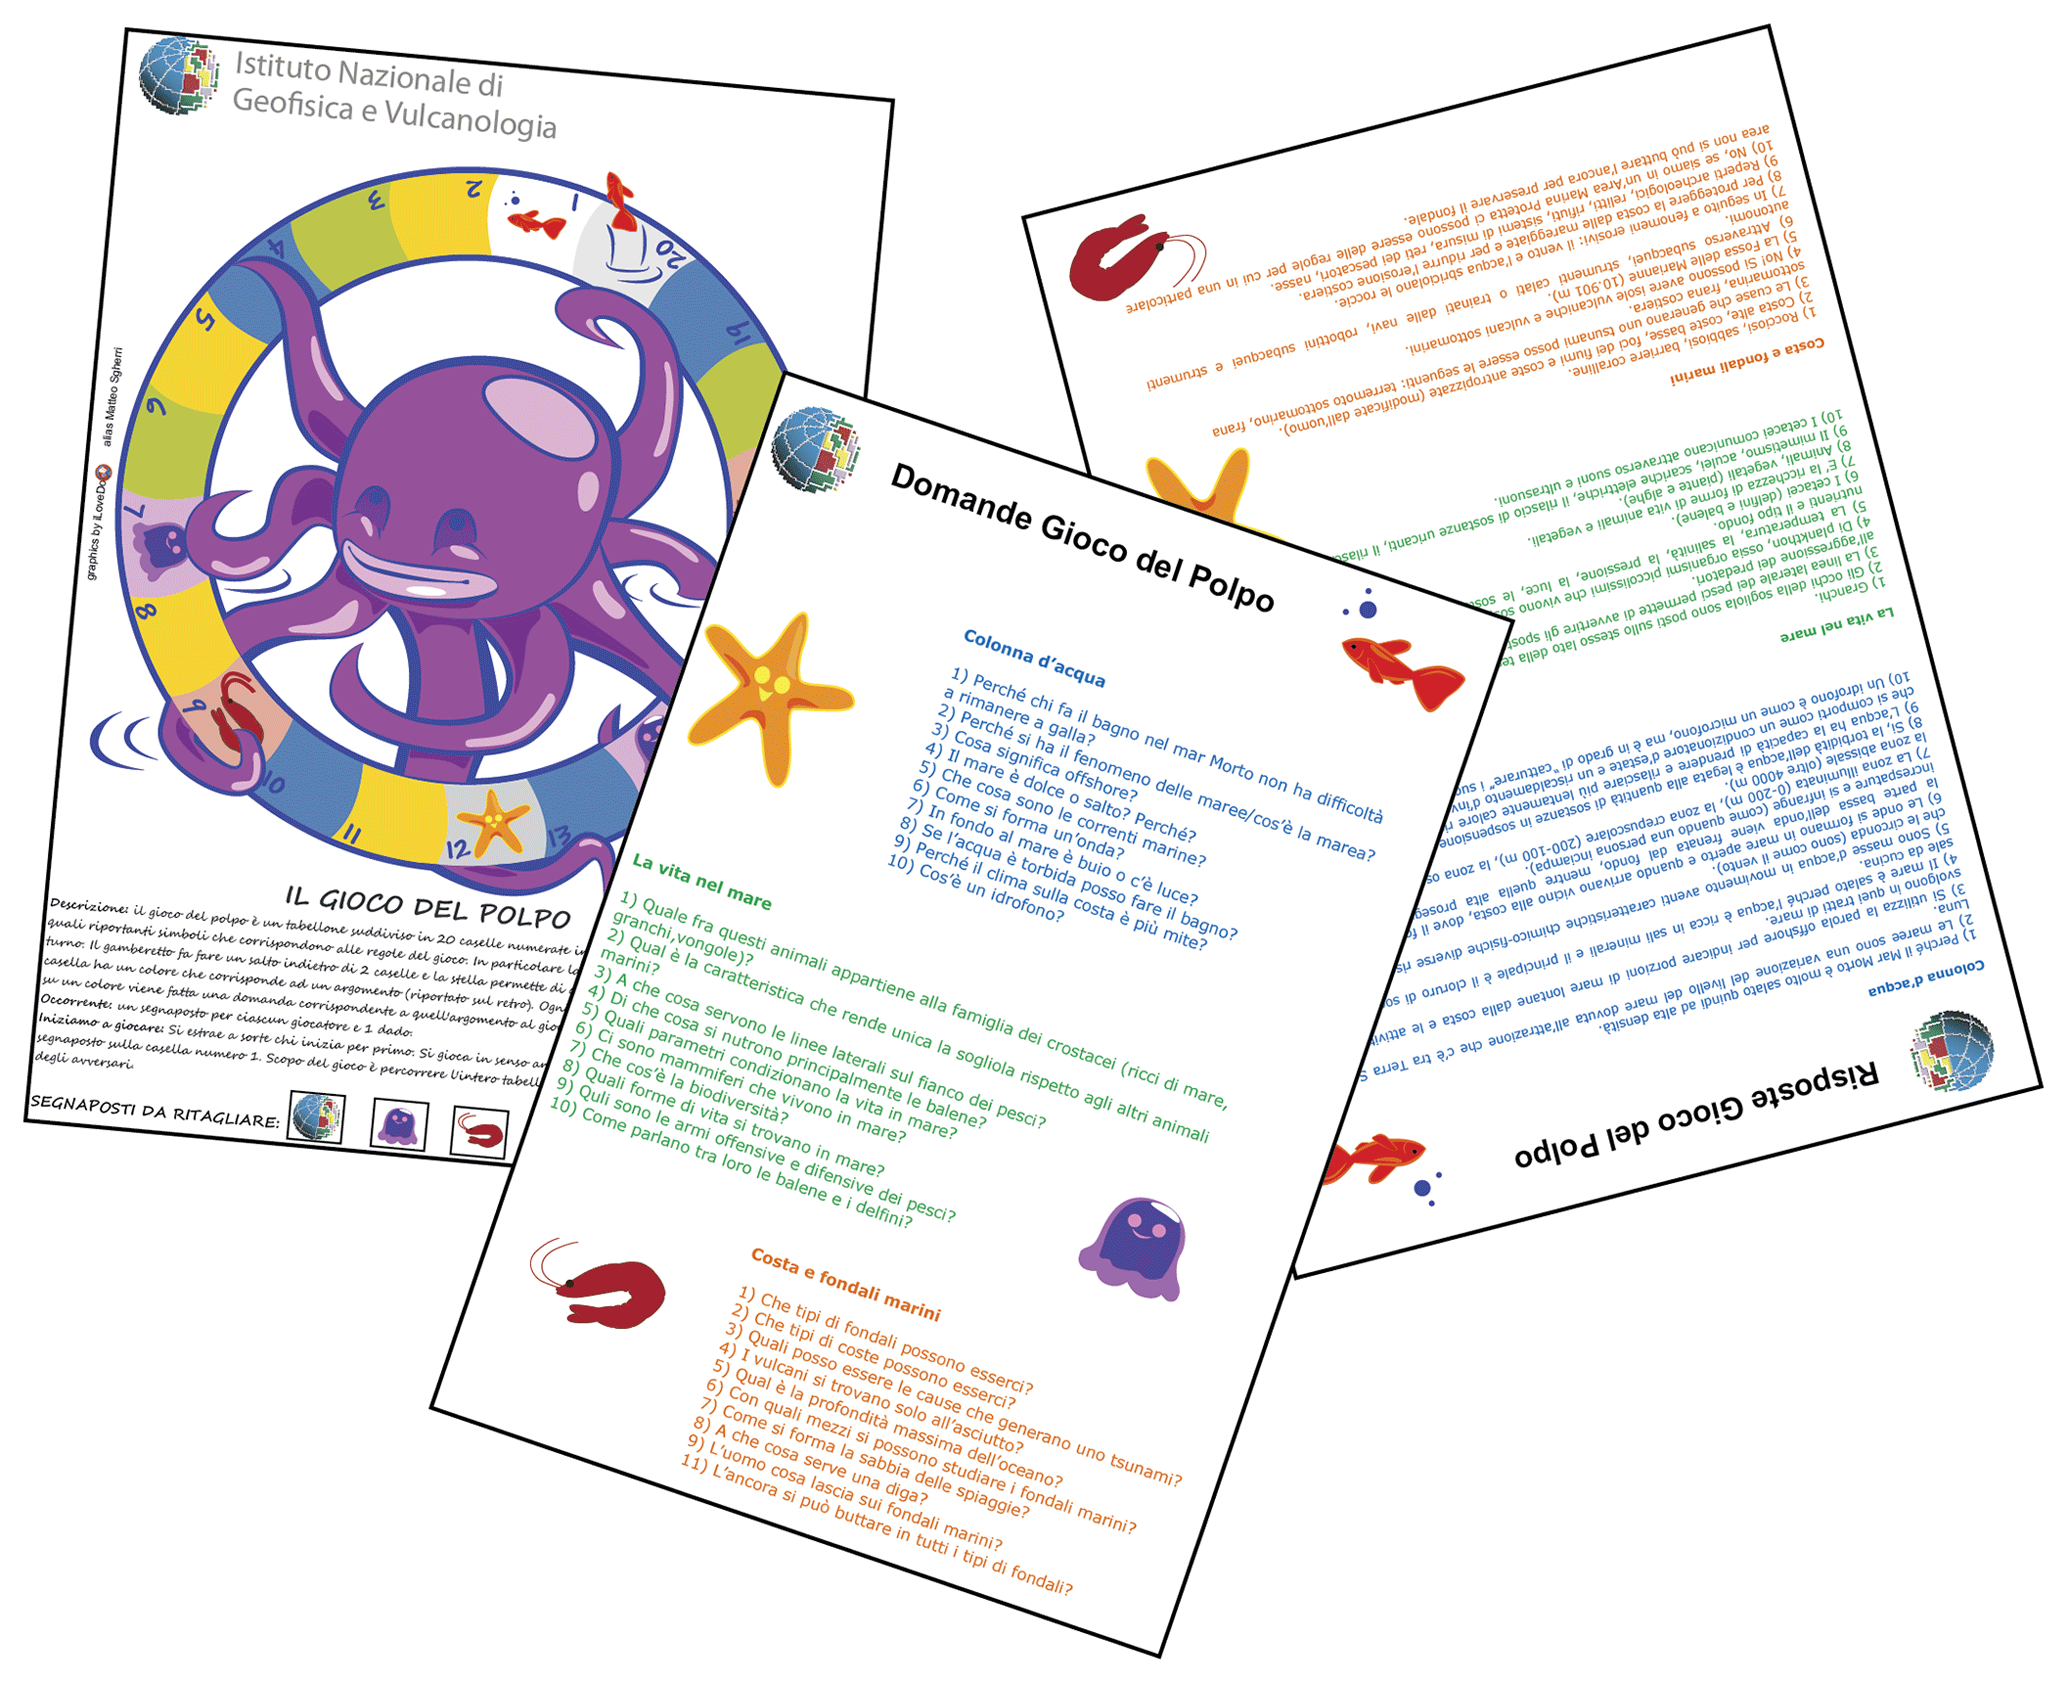
Figure 2The kit game of the Octopus game. One paper includes the board and the rules of the game. Another paper includes the questions and the corresponding answers about the marine water column, marine life, and seabed and coast (illustrations made by Matteo Sgherri).
The educational laboratory is organized as a competition between two teams, to be carried out under the supervision of an expert, who holds the ranks of the game, asks the questions and guides the teams towards the correct answer (Fig. 3). It takes place in about 1 h. The children, using large dice, extract numbers to advance the placeholder boats made of coloured sheets of paper on the board. Players take turns to roll the dice and move their piece forward by the sum of the two dice. Every time a placeholder stops on a space of a special colour, a question corresponding to the associated topic is asked to the group whose turn it is. During this path, children have fun and, thanks to the spirit of competition created between the two groups, try to actively answer the questions asked. At the end of the educational laboratory, play kits are distributed that allow children to play at home with the help of their parents (Fig. 2).
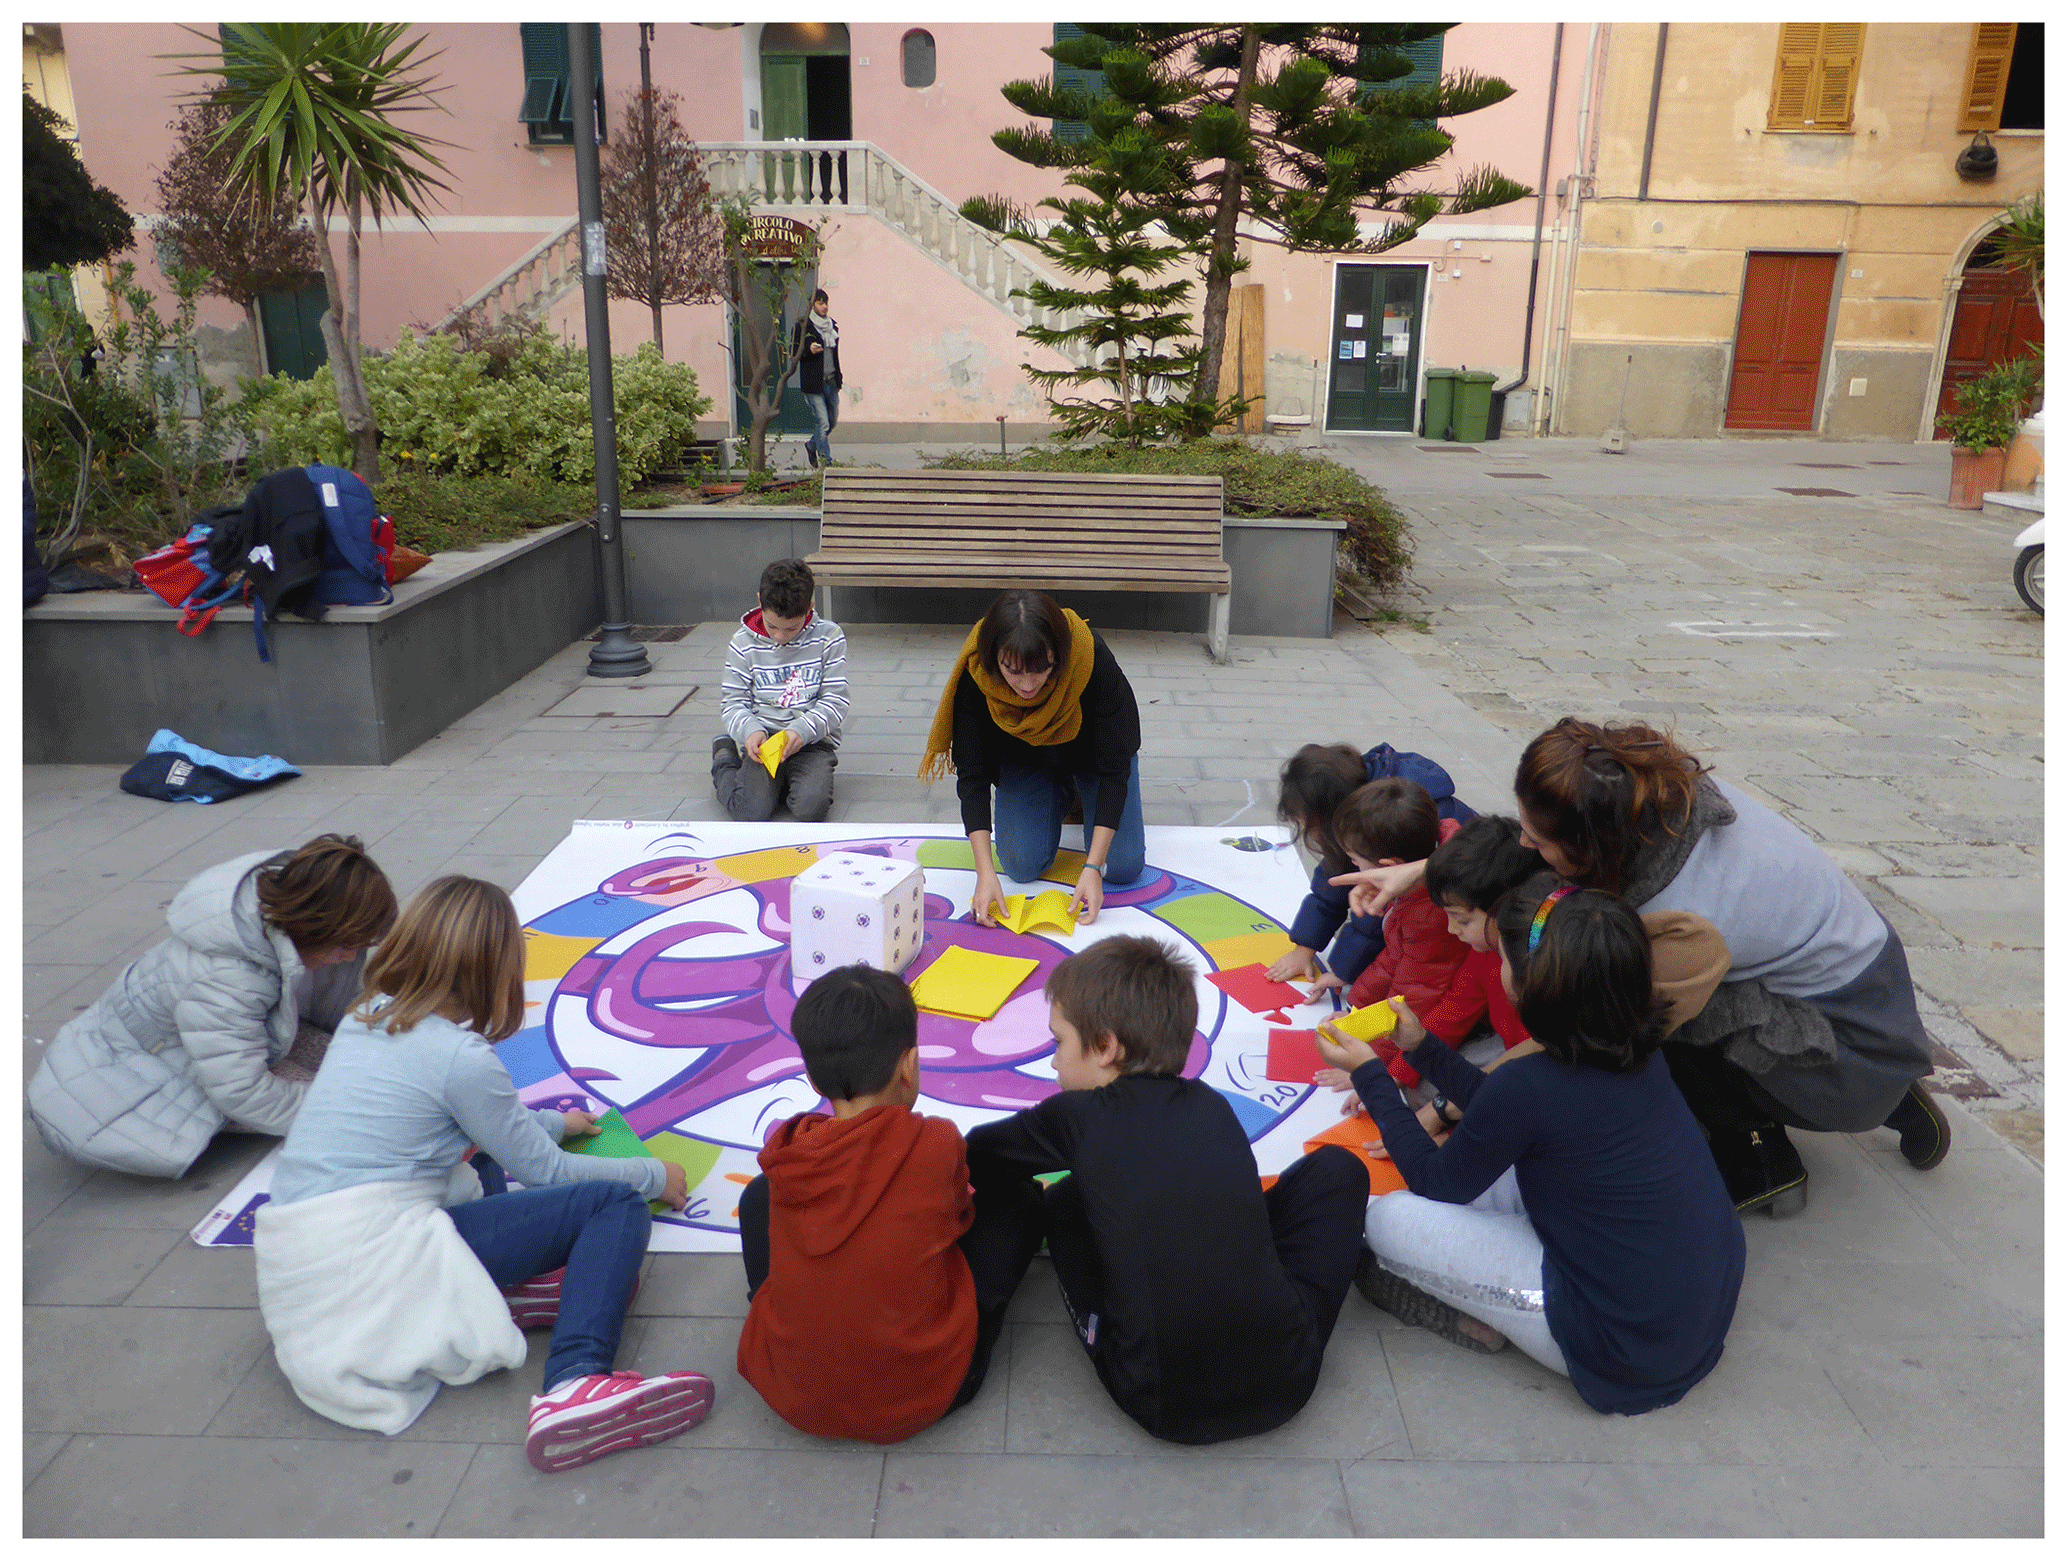
Figure 3A group of students play the Octopus game with a INGV researcher (“conductor” of the game), during an outreach event in the city of Monterosso (La Spezia).
What happens if players do not understand a question? In this case, the conductor of the game starts asking other questions related to the first but simpler one, trying to refer to practical examples, easily referable to everyday life. In this way the group always, or in most cases, manages to give the right answer.
The role of the “conductor” during the educational laboratory is therefore important, but it does not necessarily have to be a researcher or a teacher. In fact, the game has also been performed during peer education courses, with students, older than the involved children, properly trained. The peer education has proven to be an efficient method to stimulate learning. The conductor students experience an increase in self-esteem and self-confidence, which in turn conveys a greater retention of the concepts acquired during the experience. Moreover, the verbal and nonverbal language of the conductor of the game is similar to that of the participant and consequently more attractive. Since the topics dealt with in this game are quite simple, it lends itself well to be used in peer education mode, since it does not put students under pressure and, instead, leads to strengthening their knowledge in the field and also to discovering new things. The playful aspect of the experience is stimulating not only for the children involved in the workshop, but also for the peer educator themselves. A game kit is available at the INGVambiente website (https://ingvambiente.com/2020/01/17/il-gioco-del-polpo/, last access: 22 July 2020).
3.1.2 INGV-memory
The INGV-memory game is a board game based on the classic Memory® of Ravensburger and has the same game rules. It has been especially designed to help improve concentration and train visual memory by turning over pairs of matching cards; at the same time children must also associate images with some basic concepts on vulcanology, geophysics and environment, with particular attention to natural hazards: volcanoes, earthquakes and tsunamis. A small version of the game, game kit, is available (Fig. 4) for all at the INGVambiente website (https://ingvambiente.com/2020/01/17/memory-terremoti-vulcani-e-ambiente/, last access: 22 July 2020), and at the end of the educational laboratory the game kit is released to each student to play at home.
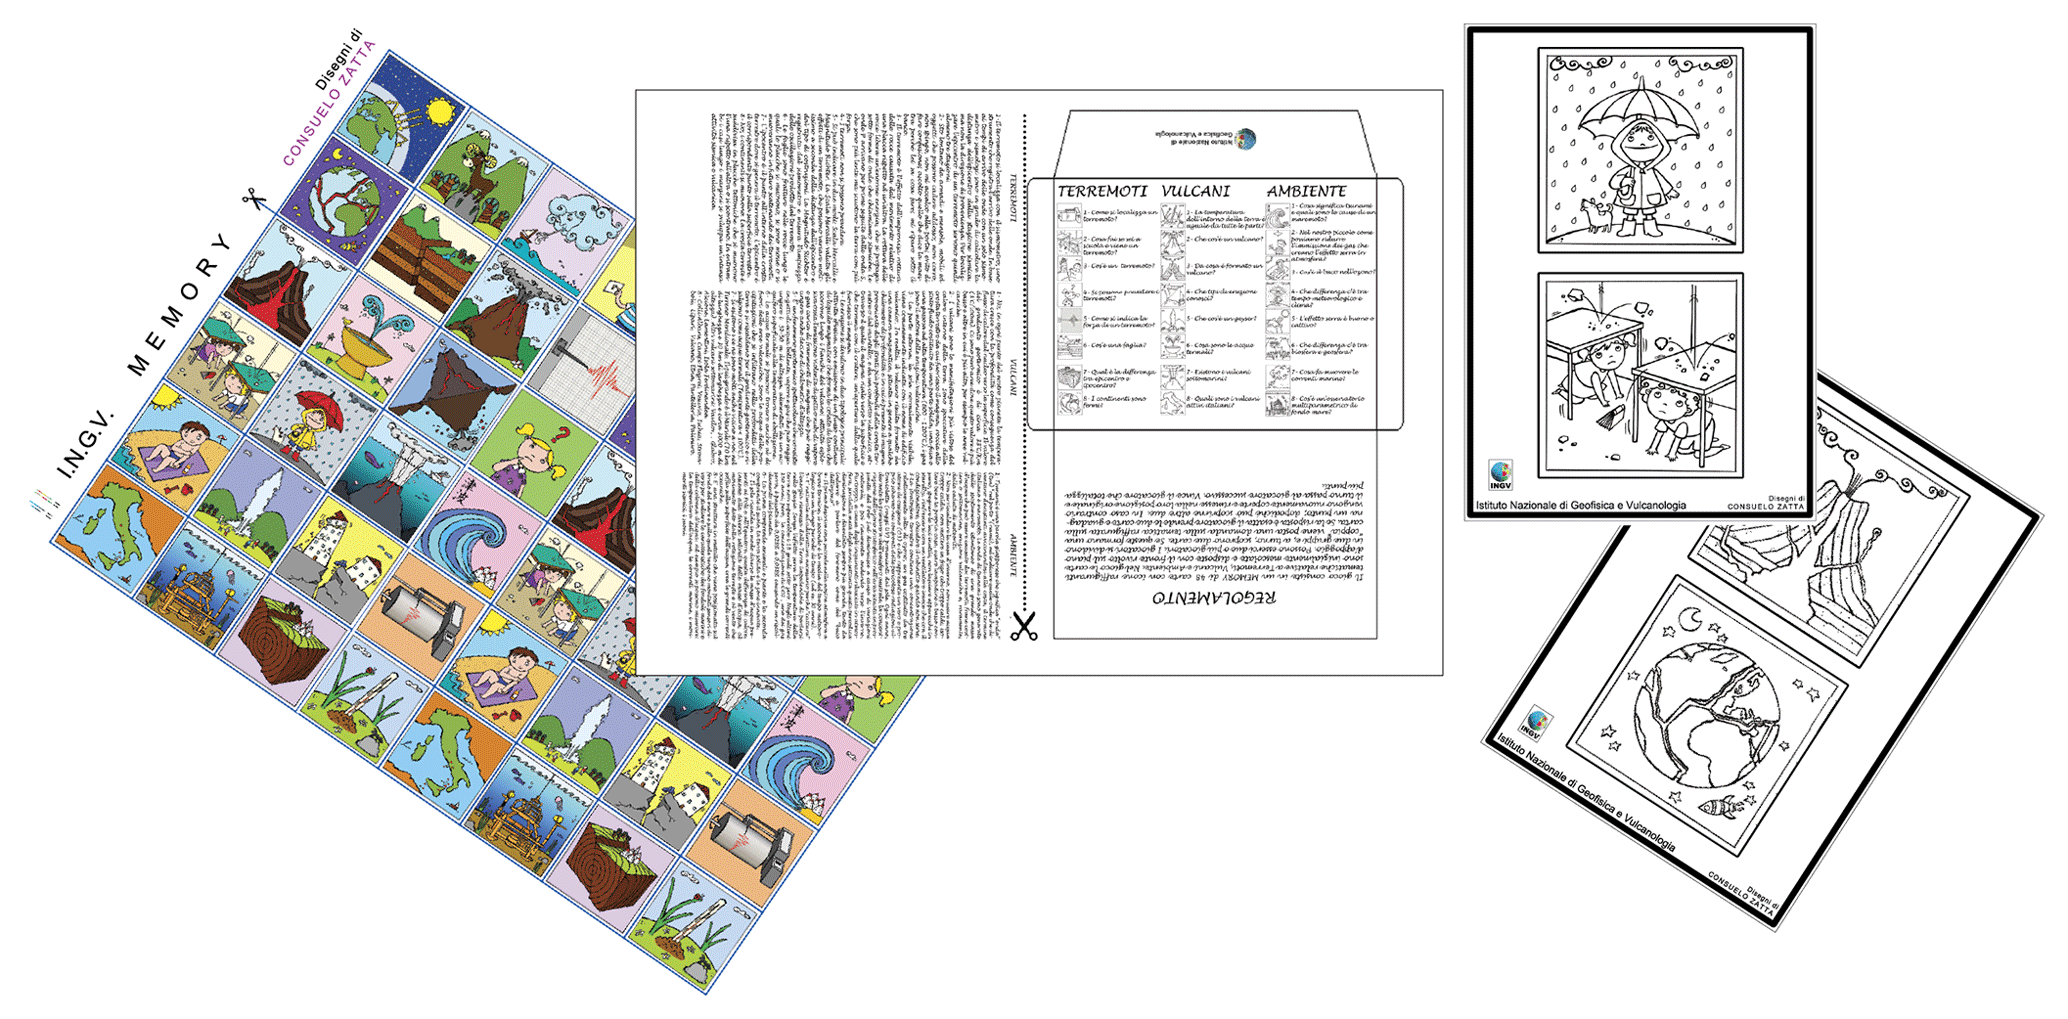
Figure 4INGV-memory kit game. The kit includes 48 cut-out cards, the corresponding questions and answers, and the colouring sheets (illustration made by Consuelo Zatta).
The game consists of 48 40 cm × 40 cm cards with icons depicting the game topics: earthquakes, volcanoes and environment. Also in this game, the dynamics during the educational laboratory mode are those of a team game: the cards are initially shuffled and laid out covered on the floor. The players are divided into two groups and, in turn, reveal two cards. If these form a pair of matching cards, the researcher/conductor asks a question, established by the game, about the theme depicted on the paper. If the answer of the team is correct, the cards are kept by the player whose turn it is, who can then uncover two more; otherwise, the cards are placed back in their original position on the floor, and the turn moves on to the next player. The player who can discover the most pairs wins.
The game is preferably aimed at middle schools (Fig. 5). As for the Octopus game, for the INGV-memory game the educational laboratory also takes place in 1 h during which the students will be able to test their mnemonic skills and scientific knowledge.
The graphic of this game is more polished than the Octopus game. The figures are better defined, even if the colours and the typology are always similar to the cartoon style or typical of illustrations for children.
In this case, however, what is represented in the different boxes has to do with the proposed topic, and sometimes it is also useful to suggest the answers of the questions. The graphic and artistic challenge of interpreting the scientific concepts was therefore more complex, compared to what was done in the Octopus game.
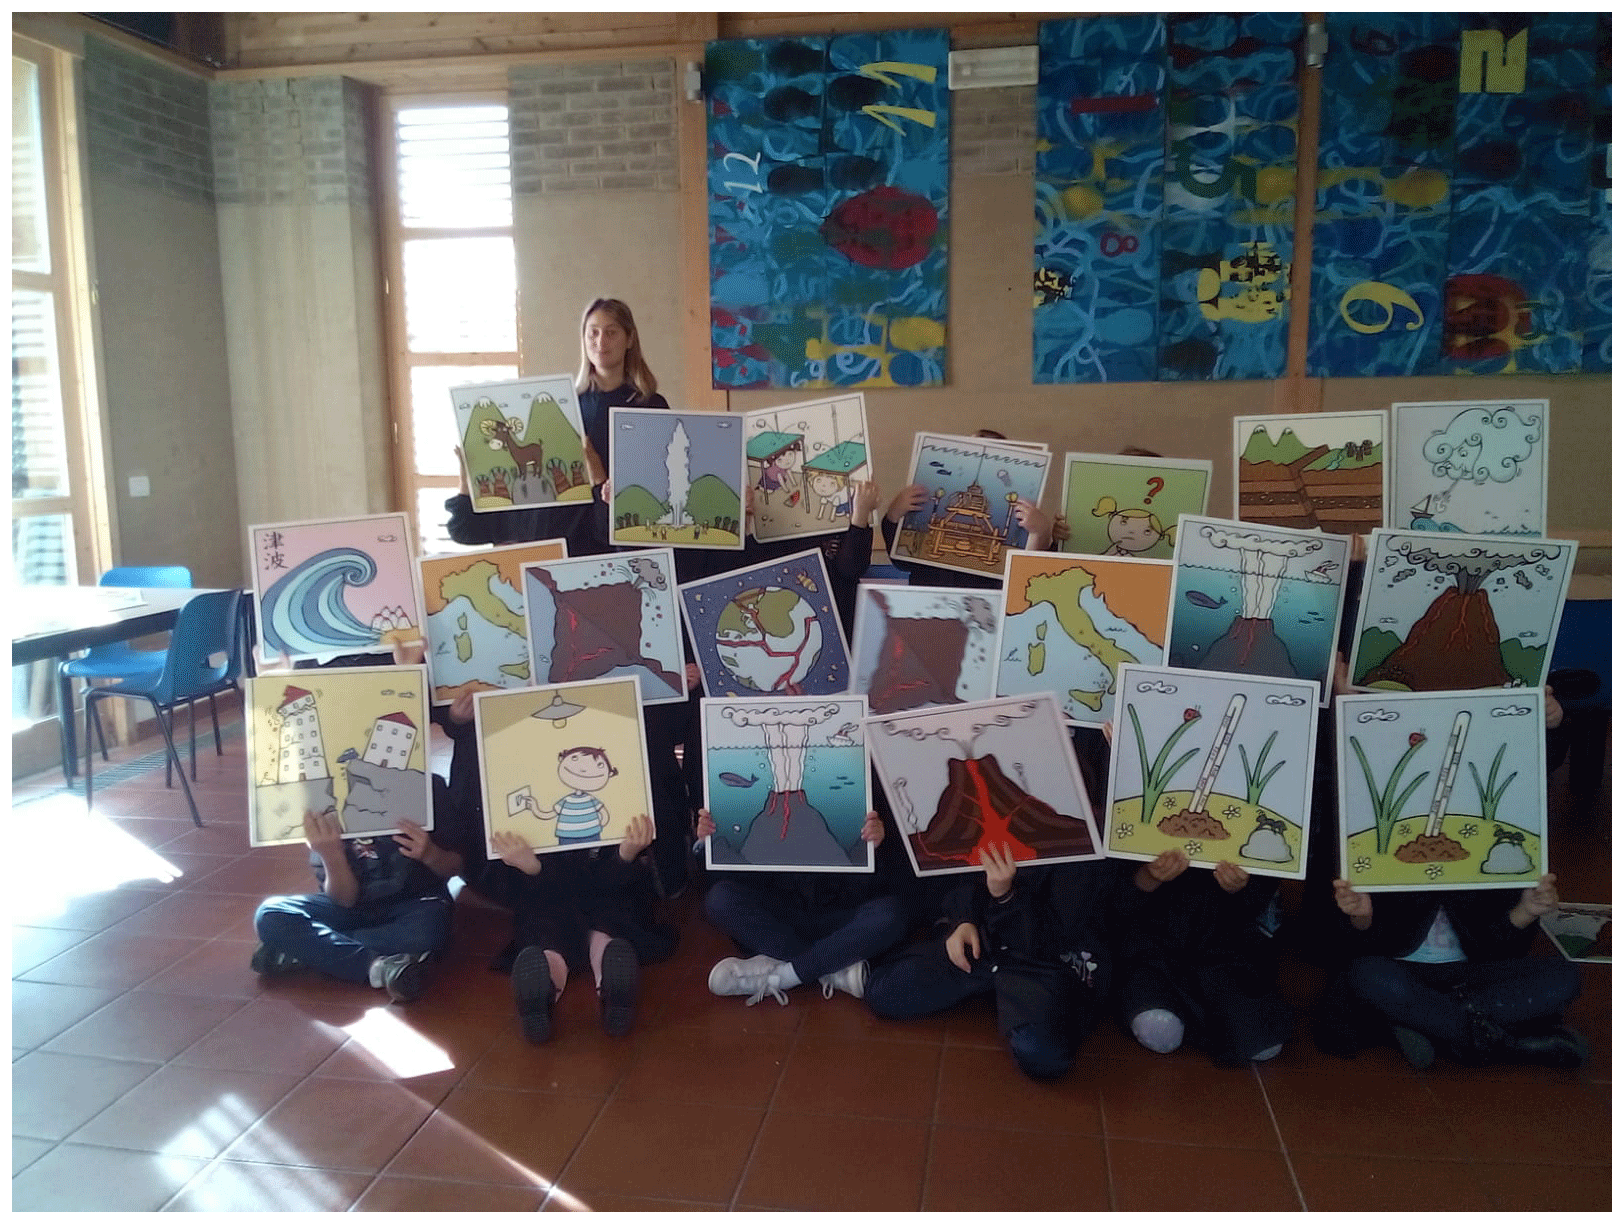
Figure 5The educational laboratory INGV-memory game at the Istituto comprensivo di Vezzano Ligure – ISA11.
3.1.3 Mareopoli
Mareopoli is a reinterpretation of the famous board game Monopoly® of Hasbro (Fig. 6). It was created with the aim of spreading the knowledge of historical oceanography and the scientific path of tidal theories, from the Greek period until the end of the eighteenth century. Many scholars, in fact, have tried to understand and interpret this phenomenon. Among the most ancient we can mention Aristotle and Eratosthenes, but also seventeenth-century figures such as Galileo Galilei, up to the physicists who have formulated modern theory like Newton and Laplace. The importance of the historical basis of our knowledge is an issue that is very close to our hearts and which is often not sufficiently highlighted.
The INGV houses a collection of historical oceanographic books ranging from 1494 to 1799, some of them of inestimable historical and artistic value, with handmade drawings and xylographies. Part of the graphic material created for this game (the curiosity cards), therefore, has been designed so that it can be extrapolated from the game and used as a comic book for adults, which reconstructs the entire history of the evolution of tidal theory from Aristotle to Laplace (Fig. 7). This aim of public awareness of science and historical knowledge is combined with the educational aim of providing scientific information on the history and scientific theory of tides, but also on transversal but tide-related issues, such as renewable energy, biodiversity and protection of the planet.
The board created for this game recalls the graphics of Monopoly® (Fig. 6). The board format for playing it in groups during edutainment laboratories measures 2 m × 2 m. The board is made up of 36 spaces: the space “GO”, 16 city spaces, 18 curiosity spaces and 18 unforeseen spaces. To each curiosity space corresponds a curiosity card (Fig. 7) with notions of historical and general knowledge on the tides, while to each unforeseen space corresponds an unforeseen card, with scientific questions on tides; to each city space correspond 16 city cards describing the tidal phenomena typical for those real cities in the world.
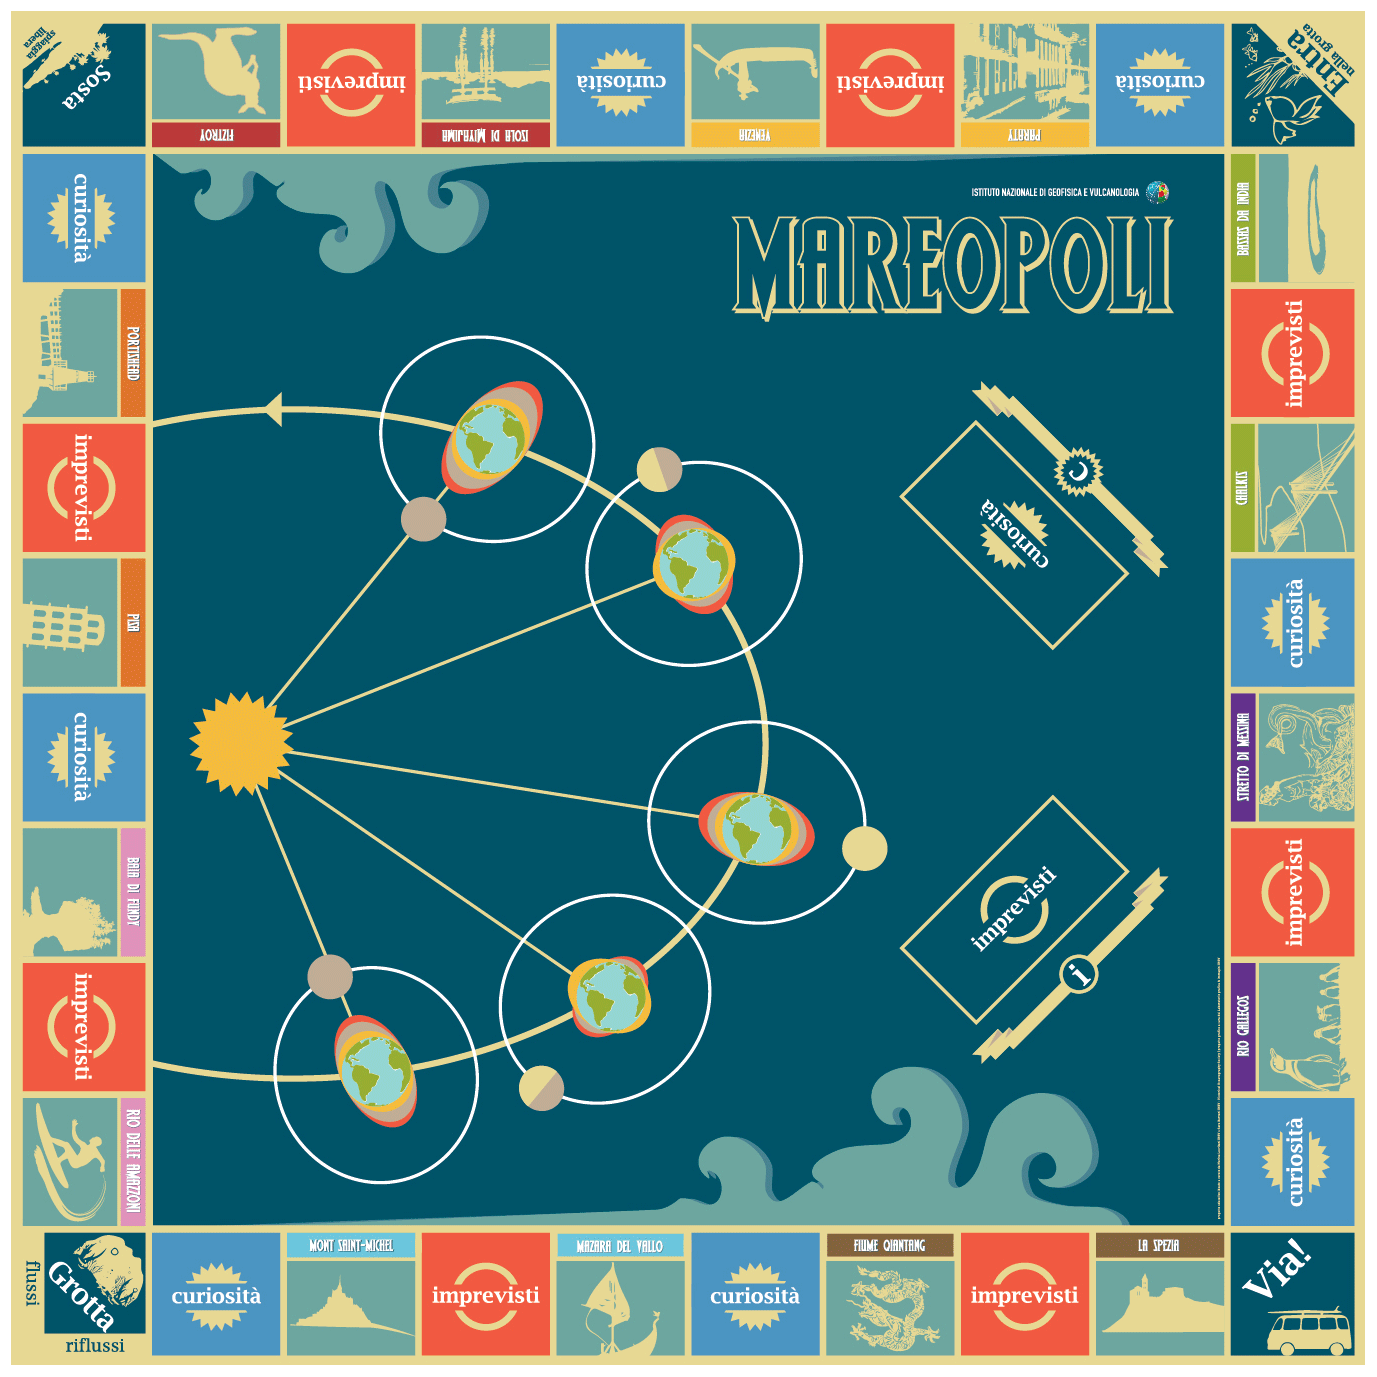
Figure 6Mareopoli game. The board and the curiosity, unforeseen and city cards explain the tide formation and the evolution of tide theory (illustration made by Francesca di Laura from INGV Laboratorio di Grafica e Immagine, graphic office).
The game is aimed at students of high schools but, as already said, also at adults (Fig. 7).
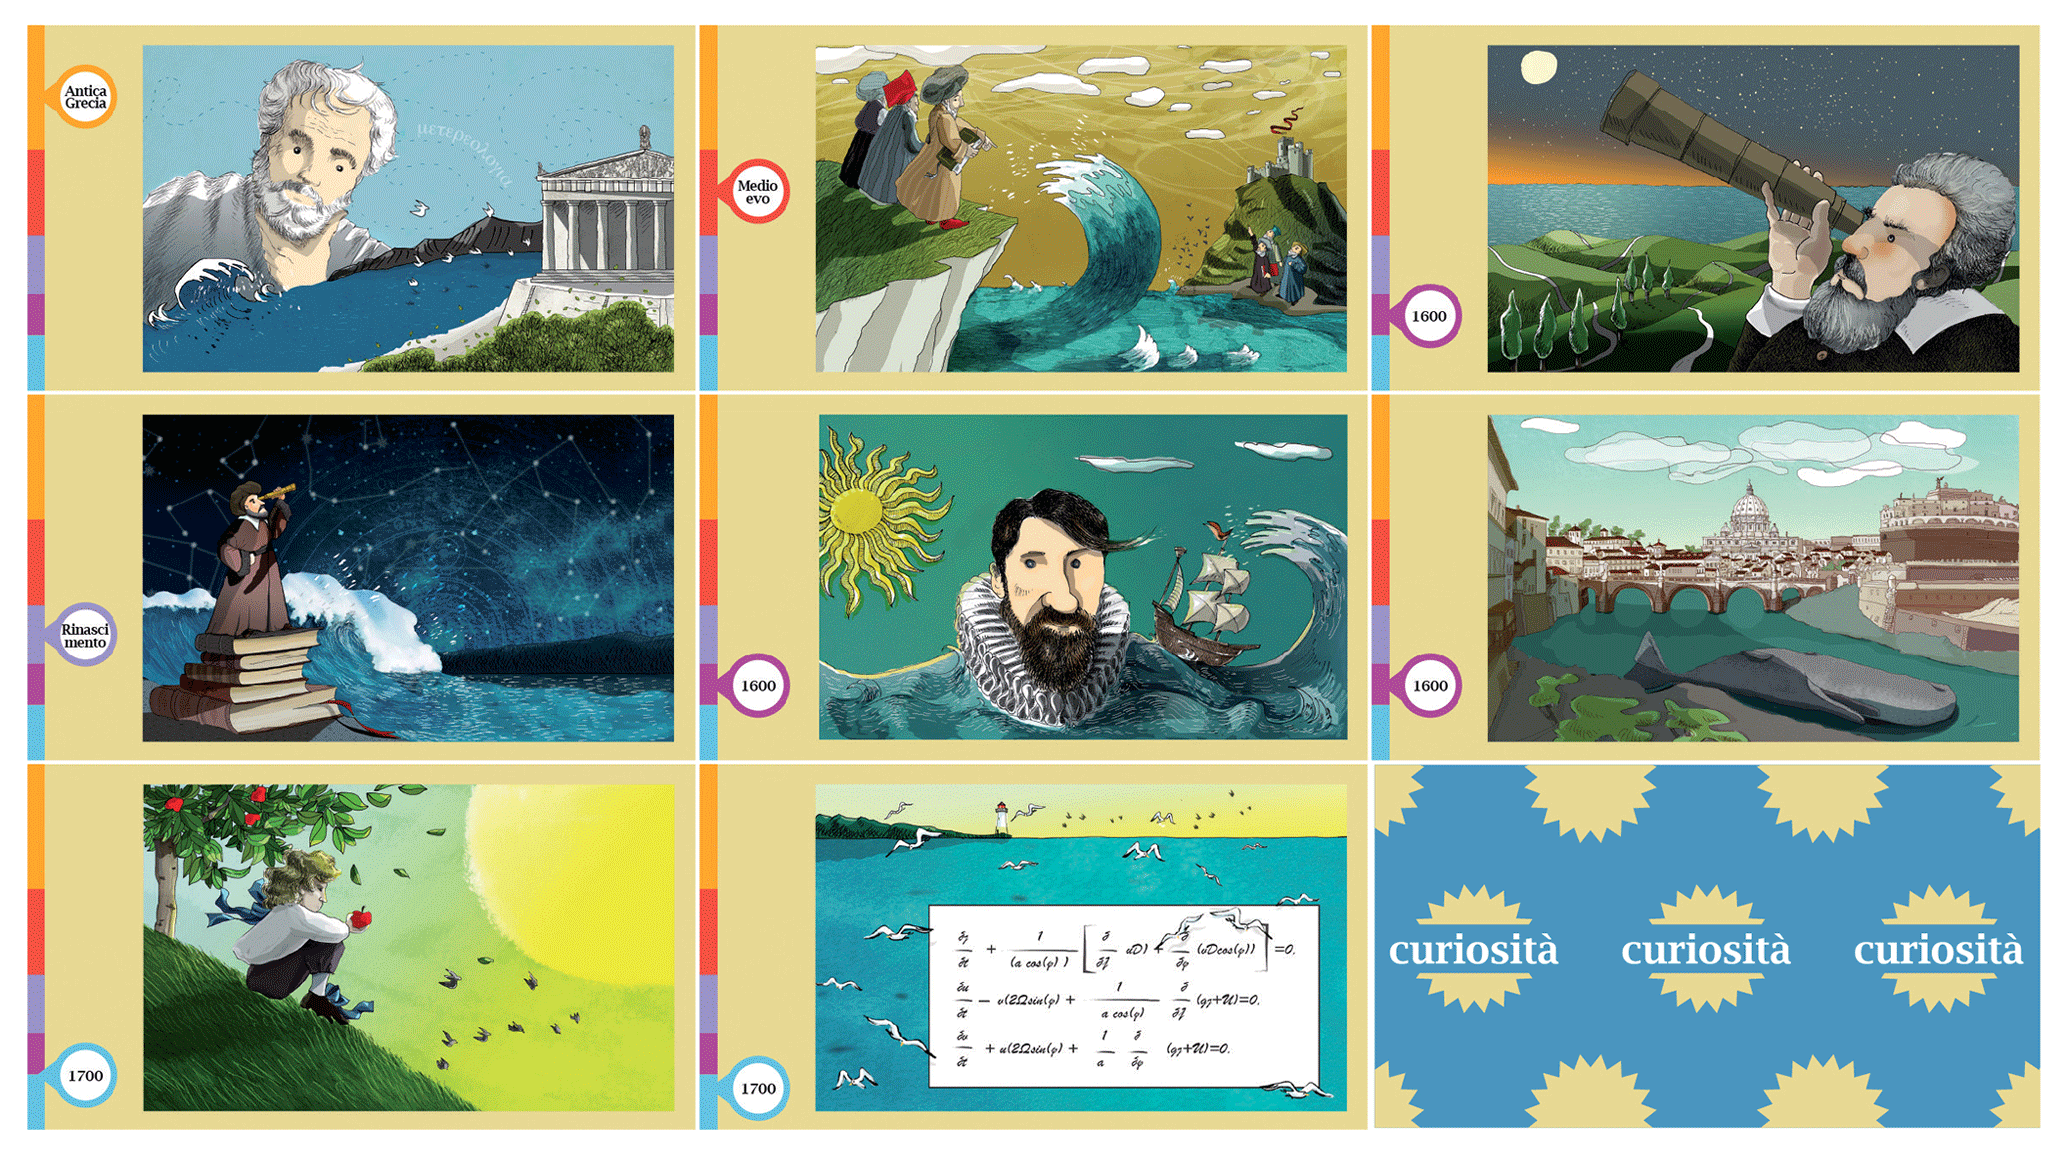
Figure 7The curiosity cards, if extrapolated from the game, can be used as a comics book, a graphic–artistic tale of the history of the scientific tide theory evolution (illustration made by Francesca di Laura from INGV Laboratorio di Grafica e Immagine, graphic office).
The twofold objective behind the planning of this tool led us to develop a particular graphic style as well. The graphic layout of Mareopoli appears less friendly than that of the two previous games: the drawings are more refined and made with less of a comic book style, to be appreciated by adult users.
The game is therefore the result of the work and cooperation of scientists and illustrators, who have shared information, ideas and images to get the final product (Fig. 8).

Figure 8Different stages of making a curiosity card. The first draft, at the top left, is that of the researcher who tries to convey to the illustrator their idea of graphics (the graphic storyboard). The others are the different proposals and evolutions made by the illustrator (illustration made by Francesca di Laura from INGV Laboratorio di Grafica e Immagine, graphic office).
The scoreboard itself looks very “sober” but elegant at the same time. The choice of colours was also made with end users in mind, so not very young children: the colours are not gaudy, and they have some retro tones that bring us mentally back in time, or at least emotionally to a different age.
Also, in this case there is a “board” game kit to give as a present, but, compared to the two previous games, it is supported by a dissemination book (Locritni and Garvani, 2020), which elaborates all the issues addressed in the game and the correlated fields. The toolkit of the game is available on the INGVambiente website at the present link: https://ingvambiente.com/2020/03/23/mareopoli/ (last access: 22 July 2020).
3.1.4 Visual questionnaire
The visual questionnaire has been elaborated in collaboration with Liguria Cluster of Maritime Technologies (DLTM), Centro Supporto Sperimentazione Navale – Italian Navy (CSSN), CNR-ISMAR, INGV and Steam Factory (private company) in order to assess science perception in school students of very low scholastic levels (primary and kindergarten school students) and to understand whether participation in extracurricular dissemination events contributes to increasing interest in science subjects (Schibec, 2006). The project was the second step of a previous study that investigated science perception in older students with a written questionnaire (Locritani et al., 2015). In the specific case of 6–7-year-old kids, acquired stereotypical images were usually monitored through the draw-a-scientist test (DAST) (Fig. 9). DAST is time-consuming and does not allow us to quickly discern the child's response. In fact, DAST always needs to be coupled with an interview for posterior interpretation of drawings. We decided, thus, to use an alternative approach that goes beyond DAST: an entirely graphic projective questionnaire, a paper kit with pre-drawn characters, accessories and clothes inspired by mainstream cartoon aesthetics, which allow children to assemble stereotypical personages, as in a mix–match game (Fig. 9).
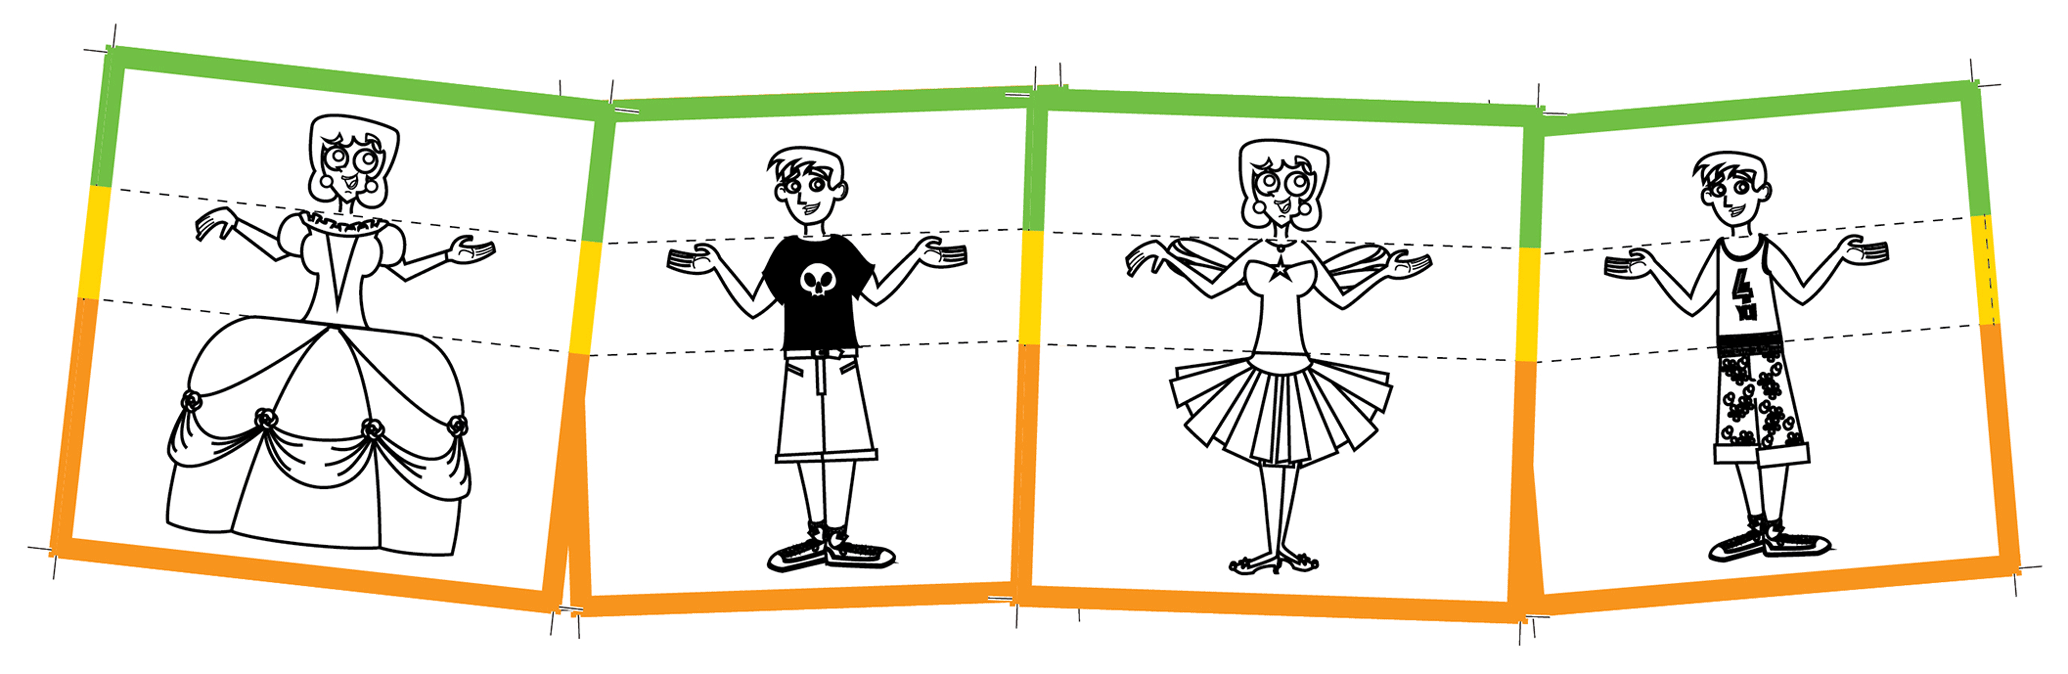
Figure 9Sketch of some of the available options for characterizing the clothing of the citizens of the Kingdom of Science. From left to right: old-fashioned lab coat (science kingdom), princess dress (historical kingdom), kingdom suit, fairy tale dress (fantasy kingdom), music kingdom dress. (Illustrations and graphic project made by Giacomo Guccinelli and Lucrezia Benvenuti; Locritani et al., 2015.)
A try-out phase has been necessary – with a group of 6-year-old children – in order to understand the background culture of this generation and language, pop culture, i.e. models and aesthetics references (TV, web, etc.), basic knowledge/perception of science (Saris and Gallhofer, 2007). Some direct questions allowed researchers to understand students' drawings, and in this phase DAST has been an essential initial tool for refining the visual questionnaire. Each character is the result of the assemblage of three paper strips representing five different heads, four different bodies and arms, four different legs and feet, and clothes and accessories (Fig. 10). Each personage can be male, female, young or adult; moreover, a fifth neutral character halfway between the four previous characters has been added.
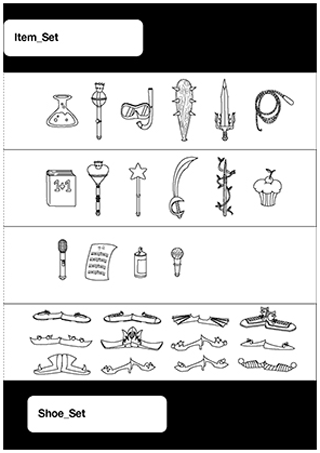
Figure 10Accessories of different characters (illustrations and graphic project made by Giacomo Guccinelli and Lucrezia Benvenuti; Locritani et al., 2015).
The visual questionnaire needed to be released from scientific context, so as not to affect the children's response: we have decided then to administer it through storytelling. The choice of the narrative makes questionnaire administration more involving for children, who are free to use their imagination, but at the same time are assisted in giving a clear response. During the questionnaire administration, children are asked to represent themselves (an “avatar”), the hero of the story who visits five fantastic kingdoms (that cover different areas of the imagination and possible interests of children),
-
feelings
-
science
-
history
-
music
-
fantasy,
and the citizens living in these five kingdoms for a total of six characters (including avatar) that will be photographed and analysed by researchers (Fig. 11). In this way, it will be possible to see how children identify themselves by seeking similarities amongst their own representation, the hero and the citizens of the five kingdoms. A score chart will allow them to have numerical results comparable with those of the other questionnaire with close-ended questions, but this part is still a work in progress.
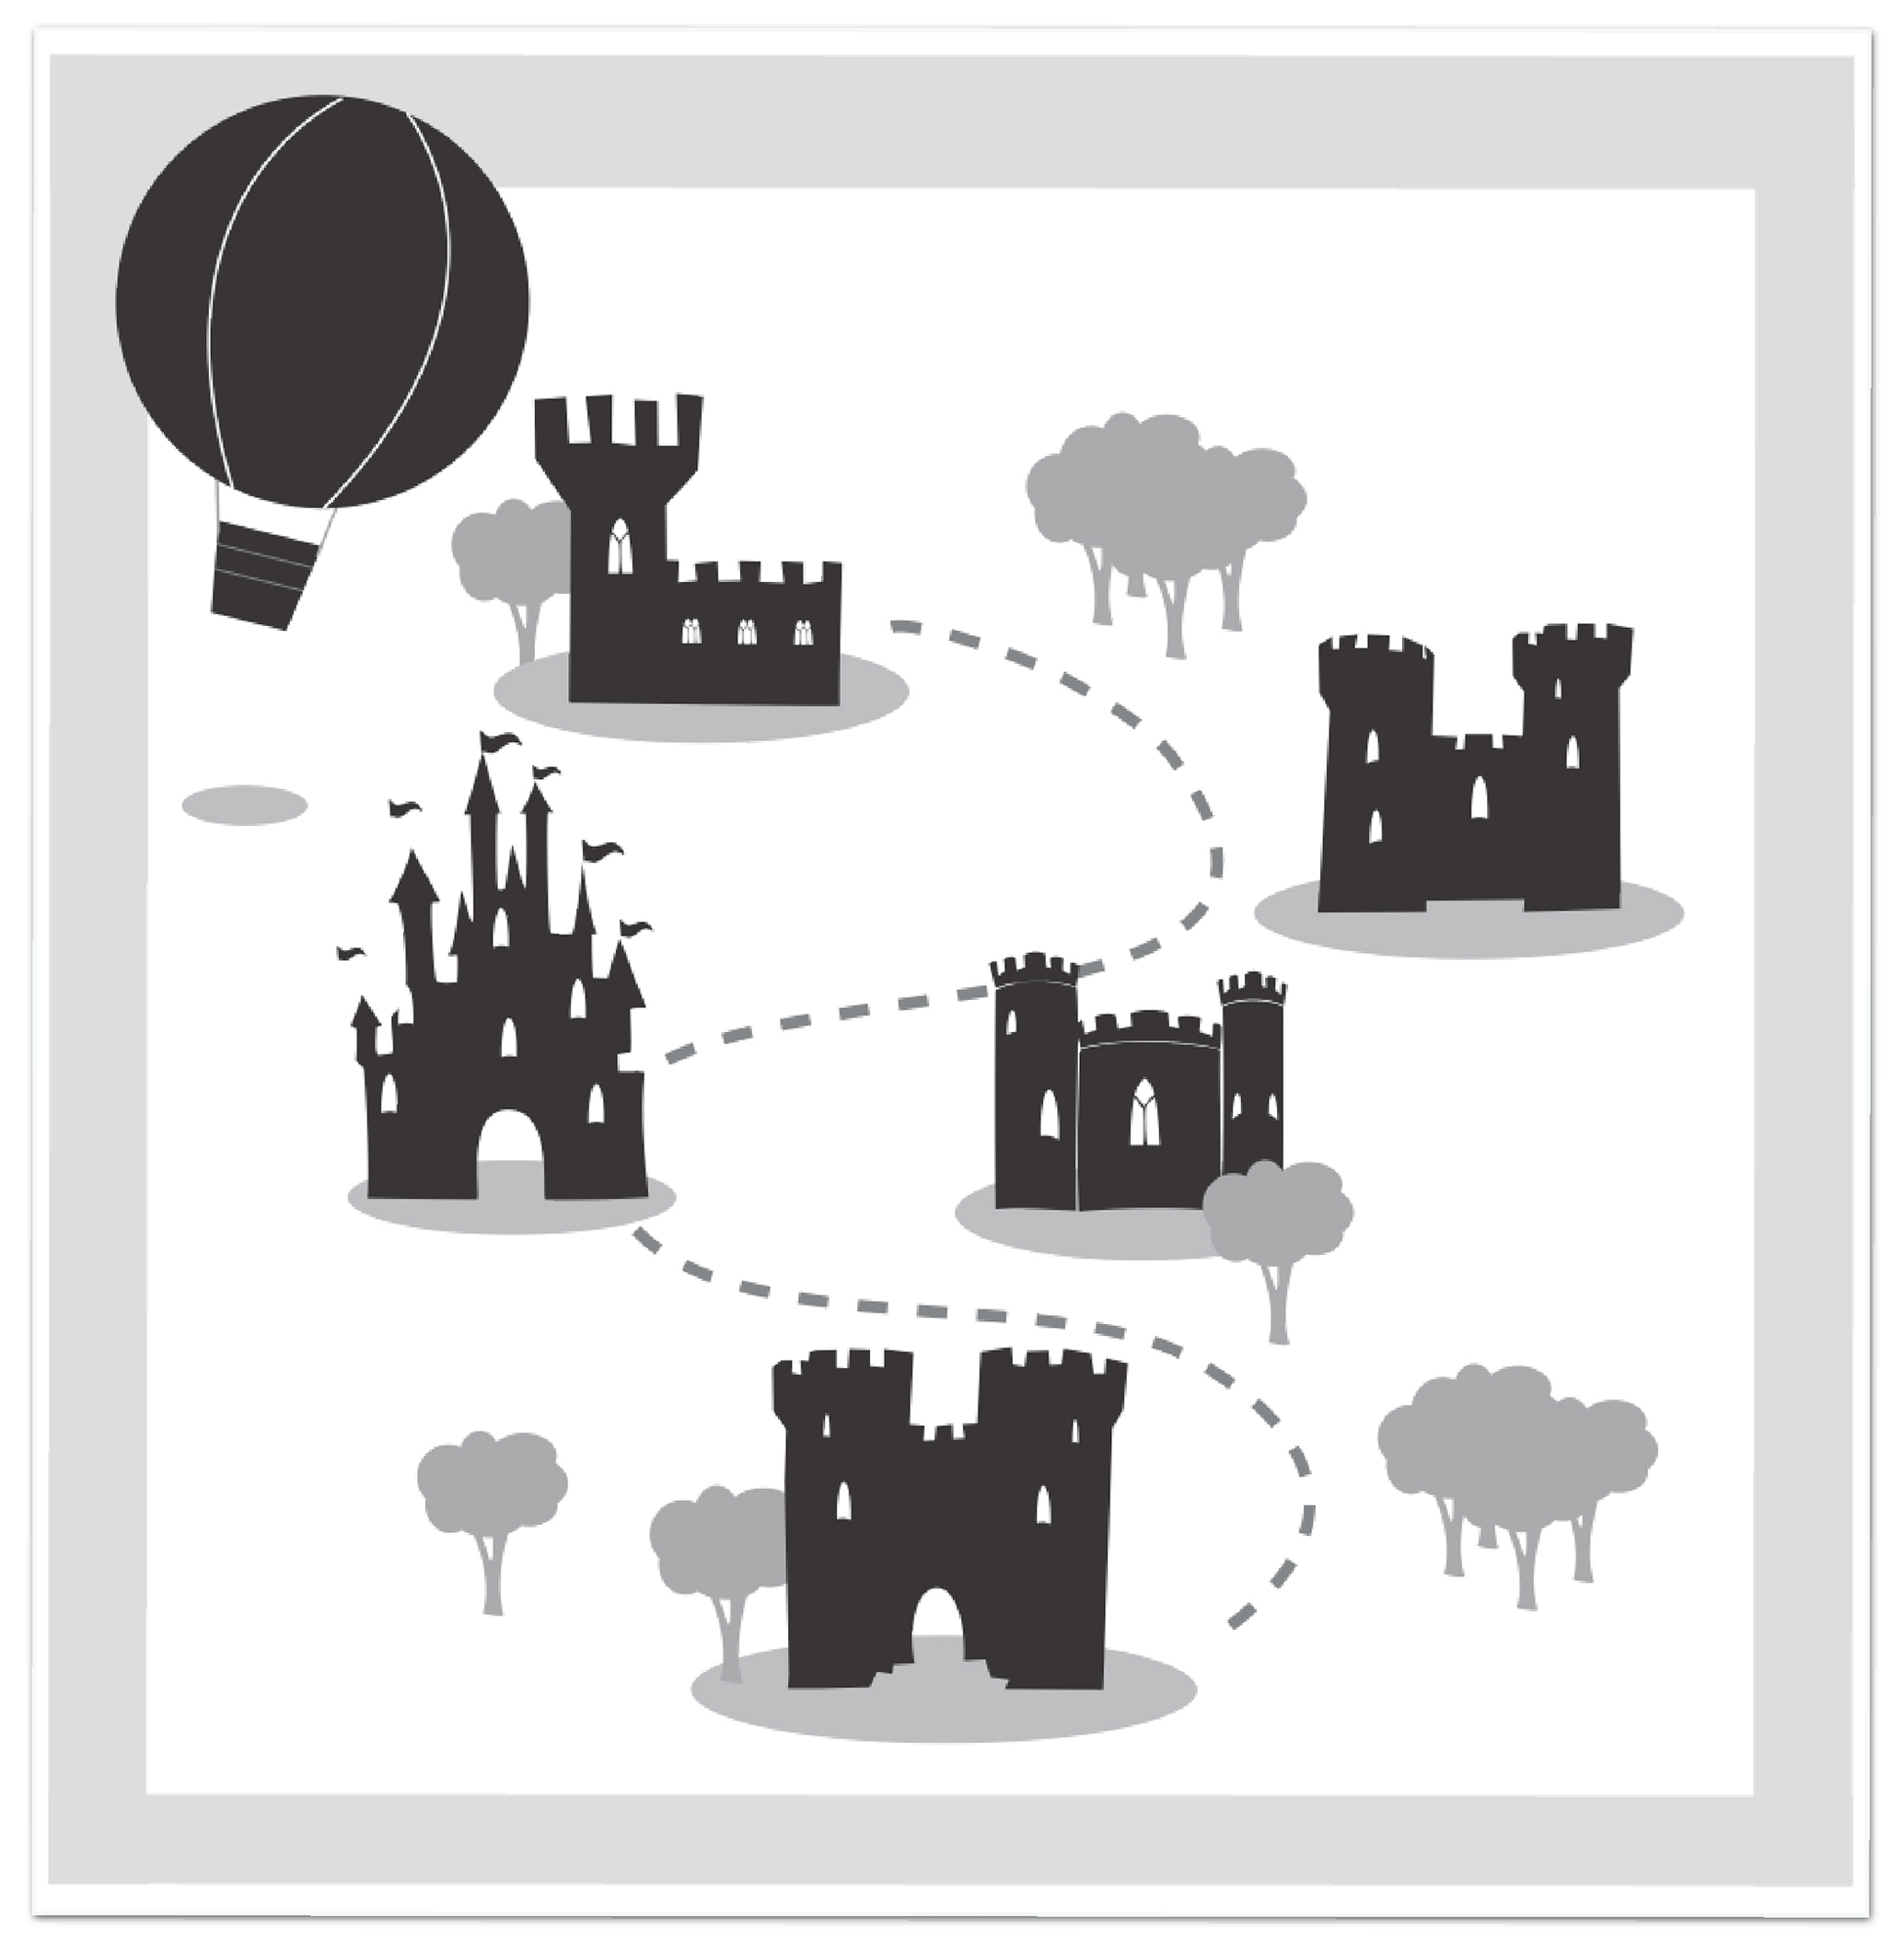
Figure 11Five kingdoms of feelings, science, history, music and fantasy (illustration and graphic project made by Giacomo Guccinelli and Lucrezia Benvenuti; Locritani et al., 2015).
The visual questionnaire is designed to give us information about how children think and imagine science and scientists and is organized to be read and interpreted by “blocks”:
-
block 1 – interest in science subjects,
-
block 2 – projection of future personality,
-
block 3 – science perception,
-
block 4 – perception about scientists,
-
block 5 – interest in extracurricular activities.
The five blocks of the graphic questionnaire are the same as the “standard” paper questionnaire with multiple-choice answers previously used (Ref Locritani et al., 2015). We started from this questionnaire with the idea of also extending it to preschool children. The methods of interpretation are currently still under development, with the help of psychologists and sociologists, and are based on the frequency with which some characters are used, depending on the “chosen kingdom”, and which gadgets and dresses are used, as well as other parameters such as, for example, the preference of the “gender” of the character. These are, however, evaluations that will have to be chosen, among several possible options, after having analysed the first “tests” performed on a small number of children, as we are currently trying to do through collaboration with some kindergartens and early elementary school. This part of the work is certainly very demanding and delicate and would require special treatment. In regards to the possible choices between clothes and accessories with which to dress and then interpret the figure of the scientist, we have deliberately proposed those of the stereotype scientist, then white lab coats, ruffled hair, etc., but also possible alternate choices, such as female figures, or modern lab coat, or scuba suit, etc. Today's scientist, even the one proposed by the mass media, is different from the one of the past (typical “lab rat”), and this questionnaire will allow us to understand whether the social changes of the last years, especially those related to female figures in many fields of work once male dominated, have been received by children.
In this phase, collaboration with an expert designer, such as Steam Factory team, was fundamental, in order to create the appropriate framework for the questionnaire addressed to very young generations. These choices were in fact the result of a process, prior to the creation of the visual questionnaire, in which many children from kindergarten and primary school were probed, in a discreet way, to understand their tastes and preferences in terms of graphics, art, pop culture, etc. Some preliminary tests were done in some primary (first 3 years) and kindergarten classes. During these tests, the children involved were asked to make drawings that concerned science and scientists. From this they drew some conclusions regarding the use of the main characterizations preferred by children in this age group. Interpretation of the questionnaire results will require collaboration with psychologists and sociologists. This part will be developed soon.
The previously described educational tools can be applied in a lot of contests, for example during outreach events, scientific challenges, school activities, scientific festivals or high school work-related learning internships, using non-formal methods as peer education and/or intergenerational learning with the support of unconventional educators.
Through a case study the efficacy of games and images to communicate science concepts will be evaluated. During a “work-related learning” internship called PCTO (Percorsi per le Competenze Trasversali e l'Orientamento), four classes composed of 74 students have been involved, by INGV researchers and GAD (Gruppo Astronomia Digitale – Digital Astronomy Group) experts, in four different types of activities: frontal lesson, practical activity, game and direct experience.
The PCTO aims to provide general knowledge about some topics faced less by the school curricula: gravitational field, astronomy and tides from a scientific and historical point of view. Frontal lessons about gravitational field and astronomy, planetarium visit, an educational game about tides (Mareopoli) and a practical activity devoted to measuring the gravitational field were performed.
After the PCTO the students compiled a questionnaire about the level of satisfaction. The questionnaire was elaborated following the previous experience in this field (Locritani et al., 2019).
Results show that the preferred topic was astronomy (50 %) followed by gravitational field (28.4 %) and tides (21.6) (Fig. 12). The most difficult topic was gravitational field (50 %), followed by tides (29.7 %) and astronomy (20.3 %). Students affirm an improving knowledge in gravitational field (41.9 %), followed by tides (37.8 %) and astronomy (20.3 %).
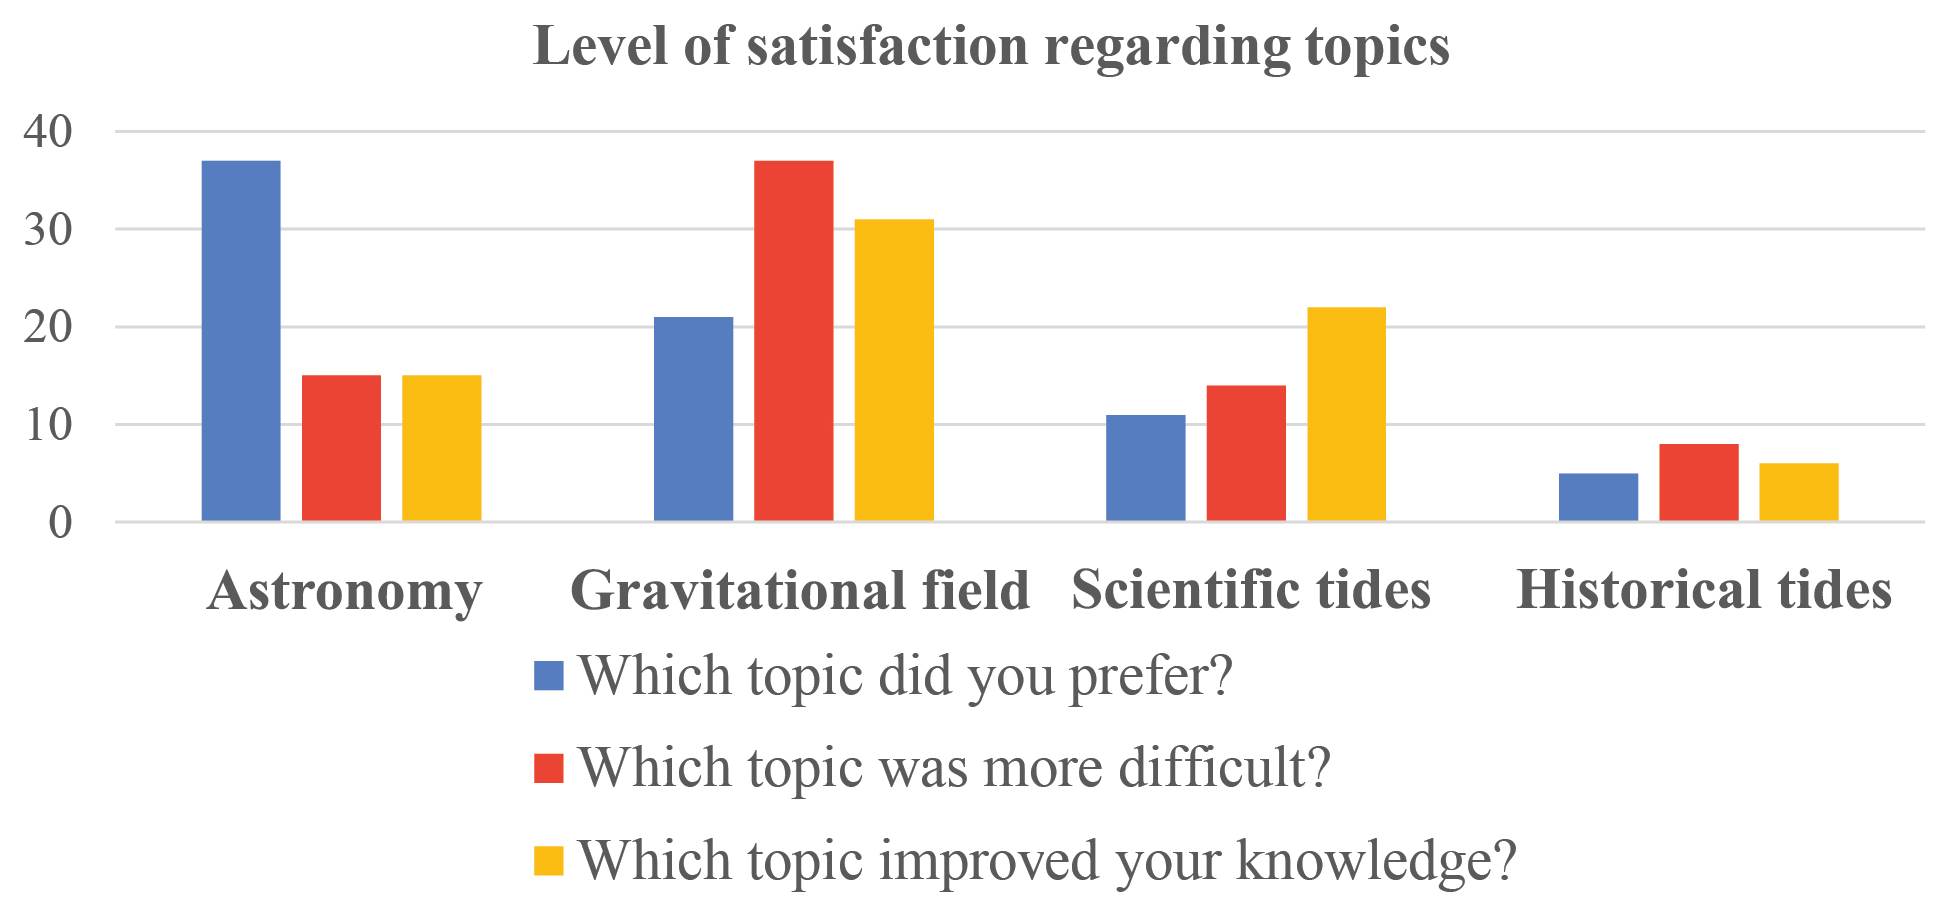
Figure 12The histograms show the level of satisfaction regarding work-related learning internship topics.
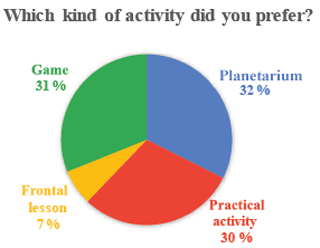
The favourite activity was the direct experience at the planetarium (32 %), the game Mareopoli (31 %) and the practical activity (30 %) (Fig. 13).
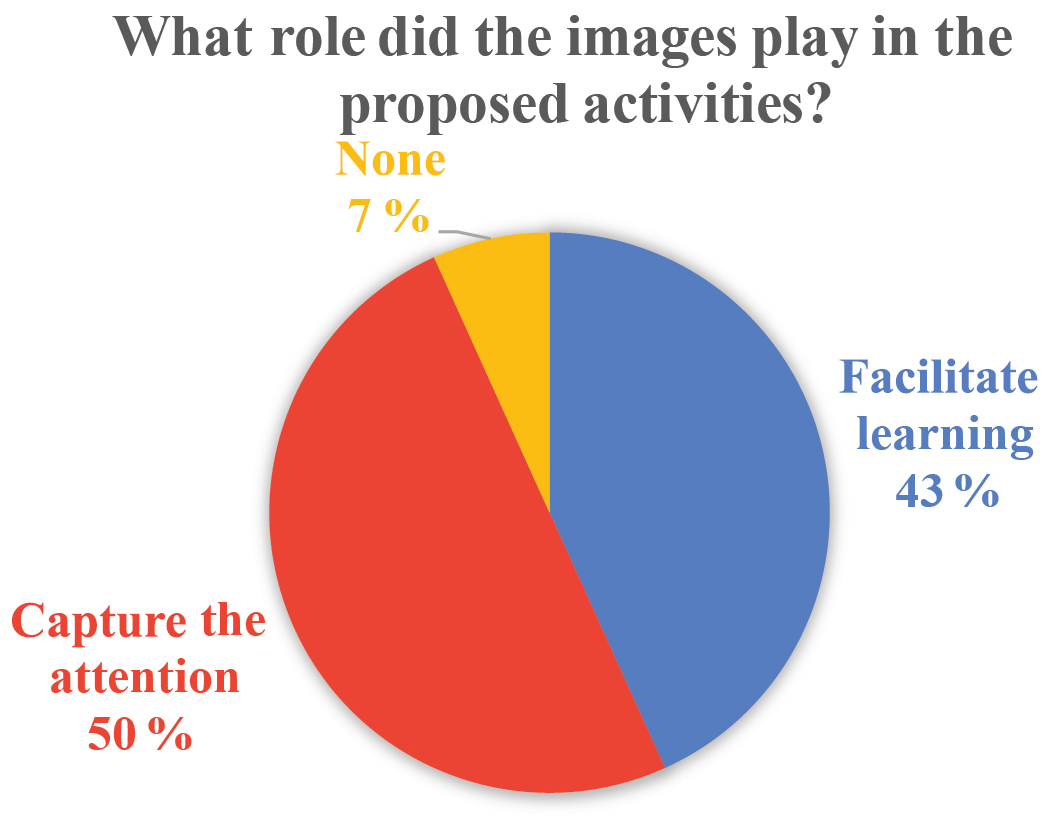
The questionnaire was designed to understand whether for the student the role played by the image in the proposed activities was important. In detail, three specific questions, about this theme have been included in the questionnaire. (1) What role is played by the images in the proposed activities? (2) Did a particular image capture your attention? (3) Which one?
The results for the first question indicate an interest in the image; in fact, student answers highlight that for 50 % the images capture their attention and for 43 % the images facilitate learning (Fig. 14).
A total of 59 % of the students affirm that they do not remember a specific image in particular (Fig. 15a). Nevertheless, it is interesting to note that each activity has influenced, by means of images, some students and that the illustrations capture the interest of the 45 % of the students in different way (Fig. 15b). In detail, about 7 % of the students were impressed by images included in the presentations, even if the presentation itself did not pique the interest of the students (see above). This indicates that images have a great power to capture attention, because students also remember illustrations if shown during the “boring” presentations. The best result emerges for the images of the game, with 14 % showing interest (Fig. 15). In this case, students remember the historical characters, such as Aristotle or Newton, and the schemes used to explain the tide formation in particular. The historical character illustrations have been created to focus attention on historical aspects that, often, turn out to be very unattractive, especially for technical school students. The schemes to explain the formation of tides, instead, have been specially designed to simplify the complex concepts and make them easier to understand, thus exploiting the potential offered by graphics compared to just written text.
Questionnaire results highlight the importance of the image in keeping attention and in capturing the interest of the student, indicating that our objective has been reached. The playful approach that in our opinion and for our experience is particularly useful for better conveying scientific content lends itself very well to being combined with the use of images or other art forms. The synergy between these two “modes” is, in our opinion, an effective means to overcome potential barriers due, in many cases, to language and promotes a greater diffusion of these tools.
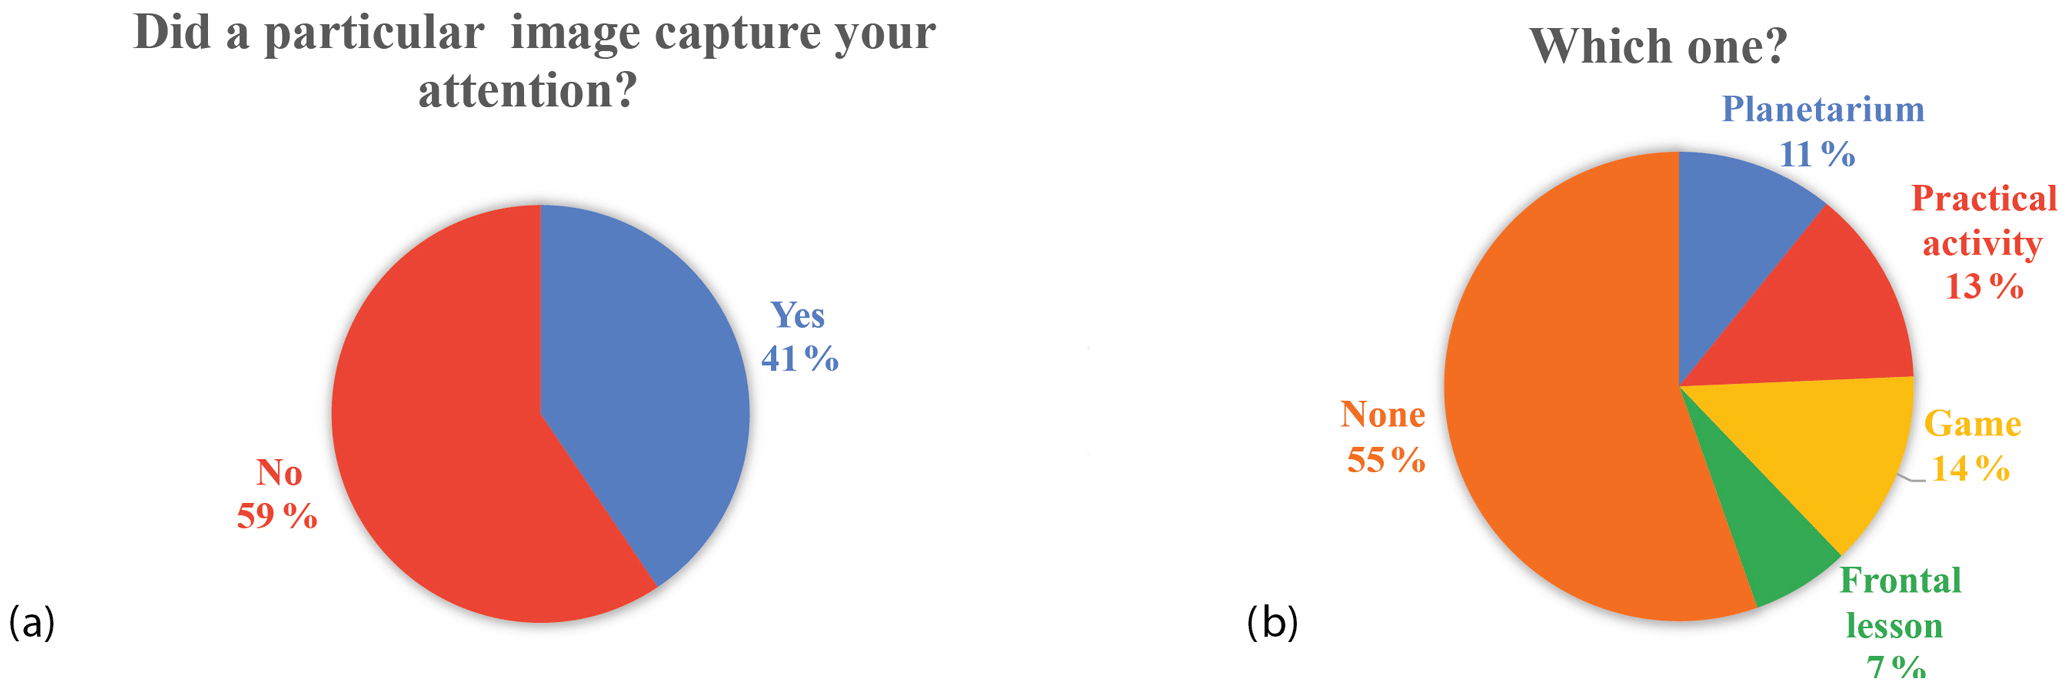
Figure 15The pie chart in the panel (a) illustrates how much the students think they were captured by an image and the panel (b) shows which ones.
The involvement of children and students in educational paths is a useful method to transmit scientific knowledge and awareness about today's great environmental problems. In addition, through the young generation it is simple to reach their families and with them different types of stakeholders. The decennial science outreach experience of the researchers involved in the activities highlighted in this paper was characterized by a growing use of images and the use of games as educational tools to raise students' awareness on scientific issues. Researchers noted, in involved students, an appreciation of the use of this kind of approach as an educational tool. This also emerges from the results of the questionnaire reported in the last paragraph, which shows that students show more interest in educational and playful activities and information transmitted through images than in standard frontal lectures. Moreover, the authors could observe qualitative results: such as higher interest of students in scientific matters and testimonies by teachers. Some students decided to frequent scientific degree courses after the participation in scientific laboratories. Some students decided to participate more times in our laboratories. Some families give us good feedback about the participation of the students in the laboratories.
Through games and images we can more easily pique interest in younger learners, but this also applies to all users, taking care to choose the right game and the right graphic style, depending on the target audience. For these reasons, these methodological approaches are becoming increasingly useful in the field of scientific dissemination.
Data sets are available upon request by contacting the corresponding author.
All authors contributed to the preparation of the article. In particular, the first author, ML, conceived and realized most of the scientific educational games used during the events and workshops described in the paper. She also contributed to the writing of the article, to the preparation and elaboration of the questionnaires (graphic and non graphic), and to the graphic part of the article. SM contributed to the conception and writing of the article. She also participated, together with the first author, in the experimentation phase of some of the interactive games described, proposed during events and workshops. Both the first and the second authors presented some of the activities carried out in the years 2015 to 2019 to the EGU by means of posters and PICO presentations. SG contributed both to the writing of the article and to the experimentation of many of the activities proposed through the interactive games described in the article, together with ML. FDL has taken care in particular of the graphic and artistic part of some of the interactive games proposed.
The authors declare that they have no conflict of interest.
This article is part of the special issue “Five years of Earth sciences and art at the EGU (2015–2019)”. It is not associated with a conference.
The authors kindly thank the artists and researchers that collaborated in the realization of the games: Matteo Sgherri and Valentina Sgherri (Octopus game), Consuelo Zatta (INGV-memory), Daniela Riposati (Laboratorio di Grafica e ImmagineINGV, Graphic Office), Giacomo Guccinelli, Lucrezia Benvenuti, Mascha Stroobant, and Roberta Talamoni (visual questionnaire). Moreover, we especially thank the Capellini-Sauro High Schools that participated in PCTO and Paolo Stefanelli (INGV) and Claudio Lopresti (GAD – Gruppo Astronomia Digitale), who organized the PCTO activities with us. Finally, the authors thank the Historical Oceanography Society for the support in the interpretation of historical topics then explained in Mareopoli.
This paper was edited by Isaac Kerlow and reviewed by two anonymous referees.
Bateson, G.: Form, substance, and difference, General Semantics Bulletin, Vol. 37, Reprinted in Steps to an Ecology of Mind, 1970.
Bertram, T. and Pascal, C.: Early childhood policies and systems in eight countries, International Association for the Evaluation of Educational Achievement (IEA), Springer, Cham, 2016.
Bianchi, L. and Chippindall, J.: Learning to teach engineering in the primary and KS3 classroom, A report for the Royal Academy of Engineering, ISBN 978-1-909327-41-2, University of Manchester, 2018.
Braglia, C. M.: Sviluppo delle forme espressive grafiche infantili: storia, teorie, pratiche, Università degli Studi di Siena, Facoltà di Lettere e Filosofia Dipartimento di Filosofia e Scienze Sociali Dottorato di Ricerca in Metodologie della Ricerca Etno-Antropologica XXI∘ Ciclo, 2011.
Bucchi, M. and Saracino, B.: Visual Science Literacy: Images and Public Understanding of Science in the Digital Age, Sci. Commun., 1–8, https://doi.org/10.1177/1075547016677833, 2016.
Cavallo, F. and Favilli, E.: Storie della buonanotte per bambine ribelli, 100 vite di donne straordinarie, Mondadori, ISBN: 880467637X, 9788804676379, p. 211, 2016.
Damasio, A. R.: Descartes' Error, Emotion, Reason and the Human Brain, N. Y.: Grosst/Putnam, 1994.
Davidson, R. J.: Anxiety and effective style: role of prefrontal cortex and amigdala, Biol. Psichiatry, 51, 68–80, 2002.
Ellis, H. D., Thomas, R. L., and Rodríguez, L. A.: Emotional mood states and memory: Elaborative encoding, semantic processing and cognitive effort, J. Exp. Psychol. Learning Memory and Cognition, 69, 237–243, 1984.
EUROBAROMETER: Special, 419 “Public perceptions of science, research and innovation”, 2014.
Friedman-Krauss, A. H., Barnett, S. W., Weisenfeld, G. G., Kasmin, R., Di Crecchio, N., and Horowitz, M.: The state of preschool 2017: State preschool yearbook, National Institute for Early Education Research, New Brunswick, 2018.
Geymonat, L. V.: Reflection: Visual Memory and a Drawing by Villard de Honnecourt, Bibliotheca Hertziana, Max Planck Institute for Art History, Rome, available at: http://blogs.cuit.columbia.edu/oxford/files/2011/11/Geymonat-Reflection-Memory-and-Drawing-Final-1.pdf (last access: 22 July 2020), 2011.
Goleman, D.: Emotional Intelligence: Why It Can Matter More Than IQ, Bantam Books, 1996.
Hartley, B. L., Thompson, R. C., and Pahl, S.: Marine litter education boosts children's understanding and self-reported actions, Mar. Pollut. Bull., 90, 209–217, https://doi.org/10.1016/j.marpolbul.2014.10.049, 2015.
Hooke, R.: Micrographia: or some physiological descriptions of minute bodies made by magnifying glasses, With observations and inquiries thereupon, Printed by Jo. Martyn and Ja. Allestry, printers to the Royal Society of London, 1665, https://doi.org/10.1088/1361-6552/aac202, 2018.
Kahneman, D.: Thinking, Fast and Slow, trad. di Laura Serra, Pensieri lenti e veloci, Milano, Mondadori, p. 548, ISBN 978-88-04-62108-9, Special Eurobarometer 340 Report, Science and Technology (2010), Survey equested by the Research Directorate – General and coordinated by the Directorate-General for Communication (“Research and Speechwriting” Unit), available at: http://ec.europa.eu/public_opinion/archives/ebs/ebs_340_en.pdf (last access: 24 July 2020), 2012.
Locritani, M. and Garvani, S.: Caracol editore, 48 p., ill., Brossura, ISBN 9788832240191, 2020.
Locritani, M., Talamoni, R., Stroobant, M., Guccinelli, G., Benvenuti, L., Abbate, M., Batzu, I., Benedetti, A., Bernardini, M.I., Carmisciano, C., Casale, L., Centi, R., Furia, S., Giacomazzi, F., La Tassa, H., Marini, C., Merlino, S., Mioni, E., Muccini, F., Nacini, F., Tosi, D., and Vannucci, C.: Feeling the pulse of Public Perception of Science: does Research make our hearts beat faster?, in: Proceedings of OCEANS'15 MTS/IEEE Conference: Discovering Sustainable Ocean Energy for a New World, Genova, Italy: IEEE, 2015.
Locritani, M., Merlino, S., and Abbate, M.: Assessing the citizen science approach as tool to increase awareness on the marine litter problem, Marine pollution bulletin 140, 320–329, https://doi.org/10.1016/j.marpolbul.2019.01.023, 2019.
Maltese, A., Melki, C., and Wiebke, H.: The nature of experiences responsible for the generation and maintenance of interest in STEM, Sci. Educ., 98, 937–962, https://doi.org/10.1002/sce.21132, 2014.
Merian, S. M.: Metamorphosis insectorum Surinamensium. Lannoo Publishers and Koninklijke Bibliotheek, National Library of the Netherlands in collaboration with Amsterdam University 200 p., ISBN 9789401433785, 1705.
Morgan, P. L., Farkas, G., Hillemeier, M. M., and Maczuga, S.: Science achievement gaps begin very early, persist, and are largely explained by modifiable factors, Educ. Res., 45, 18–35, 2016.
Pert, C.: Molecules of Emotion: The Science Between Mind-Body Medicine, Scribner, 1999.
Renninger, K. A. and Su, S.: Interest and its development, in: The Oxford handbook of human motivation, edited by: Ryan, R., 167–187, Oxford University Press, New York, 2012.
Saris, W. E. and Gallhofer, I. N.: Design, evaluation and analysis of questionnaires for survey research, Hoboken, Wiley, 2007.
Schibeci, R.: Student Images of Scientists: What are they? Do they matter? Teaching Science, The J. Aust. Sci., 52, 12–16, 2016.
Shapiro, J., Tekinbas, K. S., Schwartz, K., and Darvasi, P.: MindShift Guide to Digital Games and Learning, KQED, available at: https://a.s.kqed.net/pdf/news/MindShift-GuidetoDigitalGamesandLearning.pdf (last access: 12 April 2019), 2014.
Souza, P. V. S., Morais, L. P., and Girardi, D.: Spies: An educational game, Phys. Educ., 53, 045012, https://doi.org/10.1088/1361-6552/aac202/meta, 2018.
Vygotskij, L. S.: Il ruolo del gioco nello sviluppo mentale del bambino, edited by: Bruneret, J. S. Bruner, Jolly, A., and Sylva, K., in: Il gioco, 4 vll., Armando, Roma 1981, 657–678, 1933.
Wilgenbus, D. and Léna, P.: Early science education and astronomy, in: The Role of Astronomy in Society and Culture, edited by: Vallsabaud, D. and Boksenberg, A., 629–641, Cambridge University Press, International Astronomical Union Symposium 260, 19–23 January 2009, Paris, France, 2011.