the Creative Commons Attribution 4.0 License.
the Creative Commons Attribution 4.0 License.
 | 08 May 2020
Training citizen scientists through an online game developed for data quality control
Simon Etter
H. J. Ilja van Meerveld
Jan Seibert
Some form of training is often necessary for citizen science projects. While in some citizen science projects, it is possible to keep tasks simple so that training requirements are minimal, other projects include more challenging tasks and, thus, require more extensive training. Training can be a hurdle to joining a project, and therefore most citizen science projects prefer to keep training requirements low. However, training may be needed to ensure good data quality. In this study, we evaluated whether an online game that was originally developed for data quality control in a citizen science project can be used for training for that project. More specifically, we investigated whether the CrowdWater game can be used to train new participants on how to place the virtual staff gauge in the CrowdWater smartphone app for the collection of water level class data. Within this app, the task of placing a virtual staff gauge to start measurements at a new location has proven to be challenging; however, this is a crucial task for all subsequent measurements at this location. We analysed the performance of 52 participants in the placement of the virtual staff gauge before and after playing the online CrowdWater game as a form of training. After playing the game, the performance improved for most participants. This suggests that players learned project-related tasks intuitively by observing actual gauge placements by other citizen scientists in the game and thus acquired knowledge about how to best use the app instinctively. Interestingly, self-assessment was not a good proxy for the participants' performance or the performance increase through the training. These results demonstrate the value of an online game for training. These findings are useful for the development of training strategies for other citizen science projects because they indicate that gamified approaches might provide valuable alternative training methods, particularly when other information materials are not used extensively by citizen scientists.
- Article
(5099 KB) - Full-text XML
-
Supplement
(13483 KB) - BibTeX
- EndNote


Citizen science projects can be grouped into two different types with regard to data collection and training: either citizen scientists are engaged in relatively straightforward tasks so that no training is needed, or they perform more advanced tasks that require detailed instructions and training (Breuer et al., 2015; Gaddis, 2018; Reges et al., 2016). Training needs depend on the tasks within the projects and the project organizers' perceived need for training. Environment-focused projects, in which citizen scientists perform simple tasks and, therefore, receive no prior training are, for example, the global project iNaturalist, where citizen scientists take a picture of plants and animals and upload it to a server (Gaddis, 2018; Pimm et al., 2014); CrowdHydrology, where people passing by a stream, such as hikers, read the water level of staff gauges in the USA (Lowry et al., 2019); a similar water level study in Kenya (Weeser et al., 2018); or a survey of the occurrence of hail in Switzerland (Barras et al., 2019). Projects in which citizen scientists receive training prior to being able to participate are, for example, CoCoRaHS (Community Collaborative Rain, Hail and Snow network), where citizen scientists operate a weather station (Reges et al., 2016); a groundwater study in Canada where volunteers measure the water level in wells (Little et al., 2016); a water quality study in Kenya and Germany (Breuer et al., 2015; Rufino et al., 2018); or a water clarity study in lakes in the USA (Canfield et al., 2016). Bonney et al. (2009, p. 979) write “Projects demanding high skill levels from participants can be successfully developed, but they require significant participant training and support materials”.
In practice, there is a range of citizen science projects, and many projects can be positioned between these two training types, especially when the tasks are relatively easy but data quality can be significantly improved with training. An example is Galaxy Zoo, which requires participants to classify galaxies in an online test, before they can start to submit data (Lintott et al., 2008). Another project is a malaria diagnosis game, which offers a short online tutorial for players (Mavandadi et al., 2012). Some projects offer in-person training (Kremen et al., 2011; Krennert et al., 2018; Rufino et al., 2018), but for many projects training has to be online because the projects are global (e.g., CrowdWater, Seibert et al., 2019a; CoCoRaHS, Reges et al., 2016; and an invasive-species training programme, Newman et al., 2010). Computer-based training can be tricky because the participants cannot be monitored. However, Starr et al. (2014) found that such computer training methods, e.g. via video, can be just as effective as in-person training. Computer-based training, furthermore, requires less time from the project organizers once the material has been developed.
The topic of training and learning in citizen science has received more interest in recent years (Bonney et al., 2016; Cronje et al., 2011; Jennett et al., 2016; Phillips et al., 2019). Many citizen science projects that provide training focus more on topic-specific knowledge often because this is required to complete the task successfully. Examples are the Flying Beauties project (Dem et al., 2018); the Neighbourhood Nestwatch programme (Evans et al., 2005); or invasive-species projects (Crall et al., 2013; Cronje et al., 2011; Jordan et al., 2011), where participants have to learn to identify species before they can participate in the project. However, some citizen science projects found that the participants did not increase their factual learning possibly because they were already quite advanced (Overdevest et al., 2004). Contributory projects often emphasize specific skills more than general topic knowledge. Examples of training for specific skills rather than knowledge are the Canadian groundwater study (Little et al., 2016) or the water quality study in Kenya (Rufino et al., 2018). However, “Engagement in contributory citizen science might, by way of the methods employed, result in more data reliability but fewer science literacy gains among participants.” (Gaddis, 2018).
A novel approach to training was developed within the CrowdWater project. The CrowdWater project explores opportunities to collect hydrological data with citizen science approaches. On the one hand, the project develops new approaches to collect hydrological data by public participation (Kampf et al., 2018; Seibert et al., 2019a, b) and on the other hand assesses the potential value of such data for hydrological modelling (Etter et al., 2018; van Meerveld et al., 2017). In this study, the focus is on the collection of water level class observations based on the virtual staff gauge approach (Seibert et al., 2019a). This virtual staff gauge approach allows for water level observations without physical installations, such as staff gauges (Lowry et al., 2019; Weeser et al., 2018), so that it is scalable and can be used anywhere in the world. However, it is also more challenging for the user and potentially prone to mistakes (Seibert et al., 2019a; Strobl et al., 2019a). Previously we developed a web-based game for quality control of the water level class data (Strobl et al., 2019a). Here, we investigate whether playing this game might also be a useful preparation for using the virtual staff gauge approach in the CrowdWater app. The objective was to evaluate whether playing the game helped participants to understand the virtual staff gauge approach. More specifically, we addressed the following three questions:
-
Are participants better at placing a virtual staff gauge after they have played the game?
-
Are participants better at assessing the suitability of a reference picture after they have played the game?
-
Are participants more confident in their contributions after playing the game, and is this confidence related to their performance in playing the game?
2.1 CrowdWater app
The CrowdWater smartphone app enables citizen scientists to collect data for several hydrological parameters without requiring any physical installations or equipment. The app allows citizen scientists to set up new observation locations and to submit new observations for existing locations. The app uses OpenStreetMap (Goodchild, 2007) and thus allows for the georeferencing of observations worldwide. To start water level class observations at a new location, the citizen scientist takes a picture of a stream, showing the stream bank, a bridge pillar or any other structure that allows for the identification of the water level. Within the app, a virtual staff gauge is inserted onto this picture, which then becomes the reference for all further observations at this location (and is therefore called the reference picture). The virtual staff gauge is basically a sticker that is positioned as an additional layer onto the initial picture (Fig. 1a); i.e., there is no physical installation at the location. The citizen scientist can choose from three virtual staff gauges in the app, depending on the water level at the time when the picture is taken (low, medium or high; Seibert et al., 2019a). When placing the virtual staff gauge in the reference picture, the citizen scientist has to move the staff gauge so that it is level with the current water level and change the size of the staff gauge so that it covers the likely range of high and low water levels. When taking the reference picture, it is important that it is perpendicular to the stream bank to avoid distortions when comparing the water level with the virtual staff gauge at a later time. Poor staff gauge placement is one of the most common errors and occurs in about 10 % of the new reference pictures (Seibert et al., 2019a). The most common errors are making the virtual staff gauge too big (or more rarely too small) to be useful to record water level fluctuations, not placing the staff gauge on the opposite river bank or perpendicular to the flow, or choosing the wrong staff gauge (Seibert et al., 2019a, b). For further observations (i.e., observations at the same location at a later time), the citizen scientist who created the reference picture or any other person who wants to report a water level class observation for this location looks for the structures in the reference picture (e.g., rock, bridge pillar or wall) and estimates the water level class by comparing it to the virtual staff gauge in the reference picture (Seibert et al., 2019a). In this way, time series of water level class data can be obtained at each observation location.
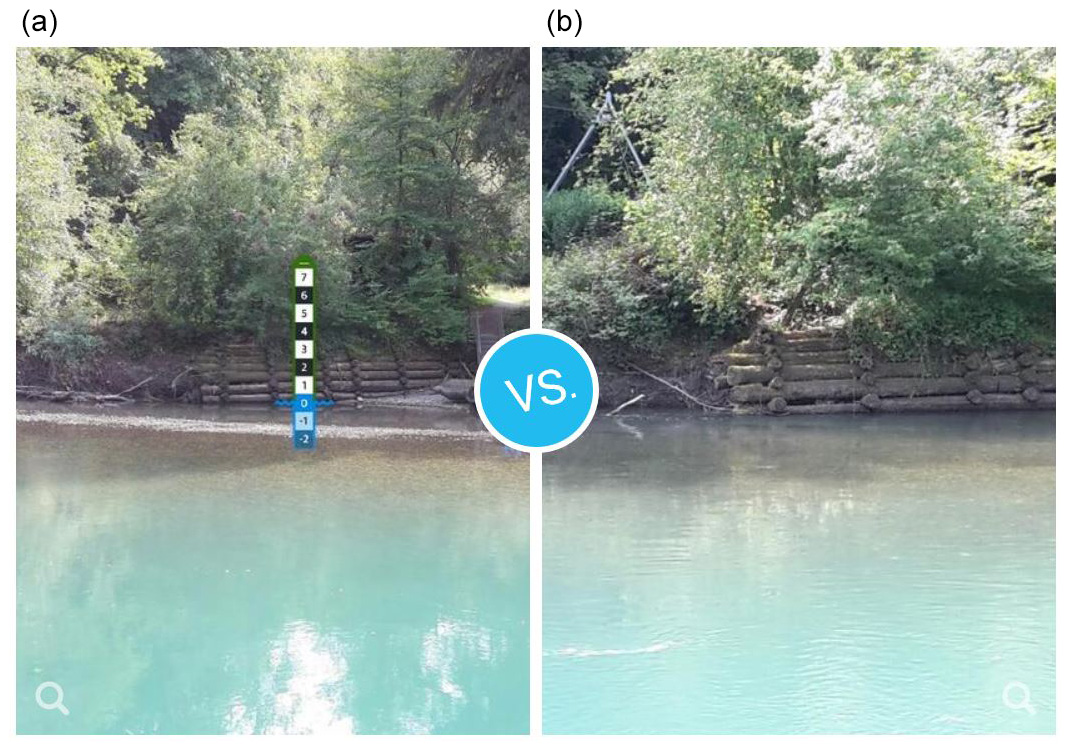
Figure 1An example of a reference picture with the virtual staff gauge (a) and a picture from an observation at the same location at a later time (b). The logs of the stream bank can be used as a reference to estimate the water level class.
2.2 CrowdWater game
In addition to data collection using the CrowdWater smartphone app, citizen scientists can also contribute to the project by checking the collected water level class data in the web-based CrowdWater game (Strobl et al., 2019a). The idea of the CrowdWater game is to crowdsource the quality control of the submitted water level class observations by using the pictures that were taken and submitted by the citizen scientists in the app. In the game, picture pairs are shown: the reference picture with the virtual staff gauge and a picture of the same location at a later time (Fig. 1). The task is to estimate the water level class for the picture without the staff gauge (Fig. 1a) by comparing the water level in this picture with the reference picture, i.e. the picture with the staff gauge (Fig. 1b). Citizen scientists play rounds of 12 picture pairs: eight classified pictures that have already been assigned a “correct” value, i.e. the median based on the evaluations of at least 15 game players and four (so far) unclassified pictures. (This value is assumed to be the correct value but may diverge from the ground truth.) Currently, the CrowdWater game uses “unstructured crowdsourcing” (Silvertown et al., 2015, p. 127), which means that all votes are weighted equally to obtain the correct water level class. The order of the pictures is random so that the player does not know whether a picture pair has already been classified or not. For the classified picture pairs, points are obtained when the correct class (six points) or a neighbouring class (four points) is chosen, and zero points are given if the selected class is more than one class off from the correct value. For unclassified pictures, the player receives three points regardless of the vote. Players can also report a picture if voting is not possible because of, for instance, an unsuitable placement of the staff gauge, poor image quality or otherwise unsuitable pictures. In this case, the player also receives three points. The repeated evaluations of the same pictures by multiple players provide quality control of the incoming water level class data (Strobl et al., 2019a).
2.3 Motivation for this study
When using the CrowdWater app, citizen scientists take a picture of the observation location and upload it, similar to iNaturalist (Gaddis, 2018; Pimm et al., 2014) or iSpot (Silvertown et al., 2015). When starting observations at a new location, some interpretation is needed, which requires an understanding of the possible range of water levels and determination of the current water level. The data collection protocol is, however, simpler than for many projects that do require training; therefore low-intensity training seems to be advisable for the CrowdWater project.
As a first step, manuals (https://www.crowdwater.ch/en/crowdwaterapp-en/, last access: 30 April 2020) and instruction videos (https://www.youtube.com/channel/UC088v9paXZyJ9TcRFh7oNYg, last access: 30 April 2020) were provided online, but in our experience (and based on the number of views on YouTube) these are not frequently used. Thus some citizen scientists occasionally still make mistakes when submitting data in the CrowdWater app, primarily when starting a new location for observations and placing a virtual staff gauge onto the reference picture (Seibert et al., 2019a). Our first approach to handle these mistakes was to implement a method of quality control to either filter out or correct erroneous submissions. This quality control method was gamified in the CrowdWater game. The CrowdWater game proved successful in improving the quality of the water level class data submitted through the app (Strobl et al., 2019a). Shortly after launching the game, we received anecdotal evidence, such as direct feedback from players, that the game also helped them to better place staff gauges and to better estimate water level classes. This feedback was confirmed through a short survey sent out to CrowdWater game players for a different study (Strobl et al., 2019a). Roughly a quarter of all players at the time filled in the survey (36 players). When asked if playing the game helped them to be more aware of how to place a staff gauge in the app, 79 % agreed. Furthermore, 58 % of all surveyed players agreed that the game helped them to better estimate water level classes in the app. The other players indicated no change in their abilities, and none of the survey players indicated a deterioration of their skills. Essentially, the players are training each other in the game as the score per picture pair, which is based on the votes of the other players, shows the new player if they are correct or not. This is similar to iSpot, where experts train beginners in species recognition (Silvertown et al., 2015). Through the CrowdWater game, players learn which staff gauges are difficult to read and which ones allow for an easy comparison of the water levels (Strobl et al., 2019a).
This motivated us to investigate if the CrowdWater game can be used to train potential citizen scientists to place the virtual staff gauge in the CrowdWater app correctly. It is better to train citizen scientists before participation so that they provide useful data rather than to filter data from untrained citizen scientists afterwards. Filtering wrong data afterwards wastes the time of the citizen scientists, and erroneous data can be missed by the filter. In the CrowdWater project, it is particularly important to place the virtual staff gauge correctly because all subsequent observations at an observation location are based on this virtual staff gauge (i.e., a poorly placed staff gauge will influence all following observations).
The CrowdWater game is a project-specific training tool meant to improve the reliability of CrowdWater observations and does not aim to improve scientific literacy. This is similar to some other citizen science projects, especially contributory projects, where data are crowdsourced (Crall et al., 2013). Improving the hydrological knowledge was not necessary in our case, as the data can easily be collected without such background knowledge. However, other materials that provide such knowledge and a link to an open massive online course are provided on the project website.
3.1 Training study
This study aimed to assess if the CrowdWater game can be used to train new participants to place the virtual staff gauge in the CrowdWater app correctly. The placement of the staff gauge is the most important metric for this study because this is the most crucial task when CrowdWater app users start a new observation location. Rating reference pictures gave additional insight into whether participants can recognize well and poorly placed staff gauges, regardless of whether or not they can place them well themselves.
The training study consisted of a number of tasks that were executed before and after playing the game. To focus on the research questions and to exclude other factors, such as differences between locations, flow conditions or daylight, the study was mainly conducted indoors at a computer. For each participant, the experiment took 60–90 min. All instructions and questions were formulated in English; all participants had a good command of English. The study was conducted between August and October 2018, apart from a small outdoor task, which was completed by the participants at a later time. The full study can be found in the “Training study” in the Supplement.
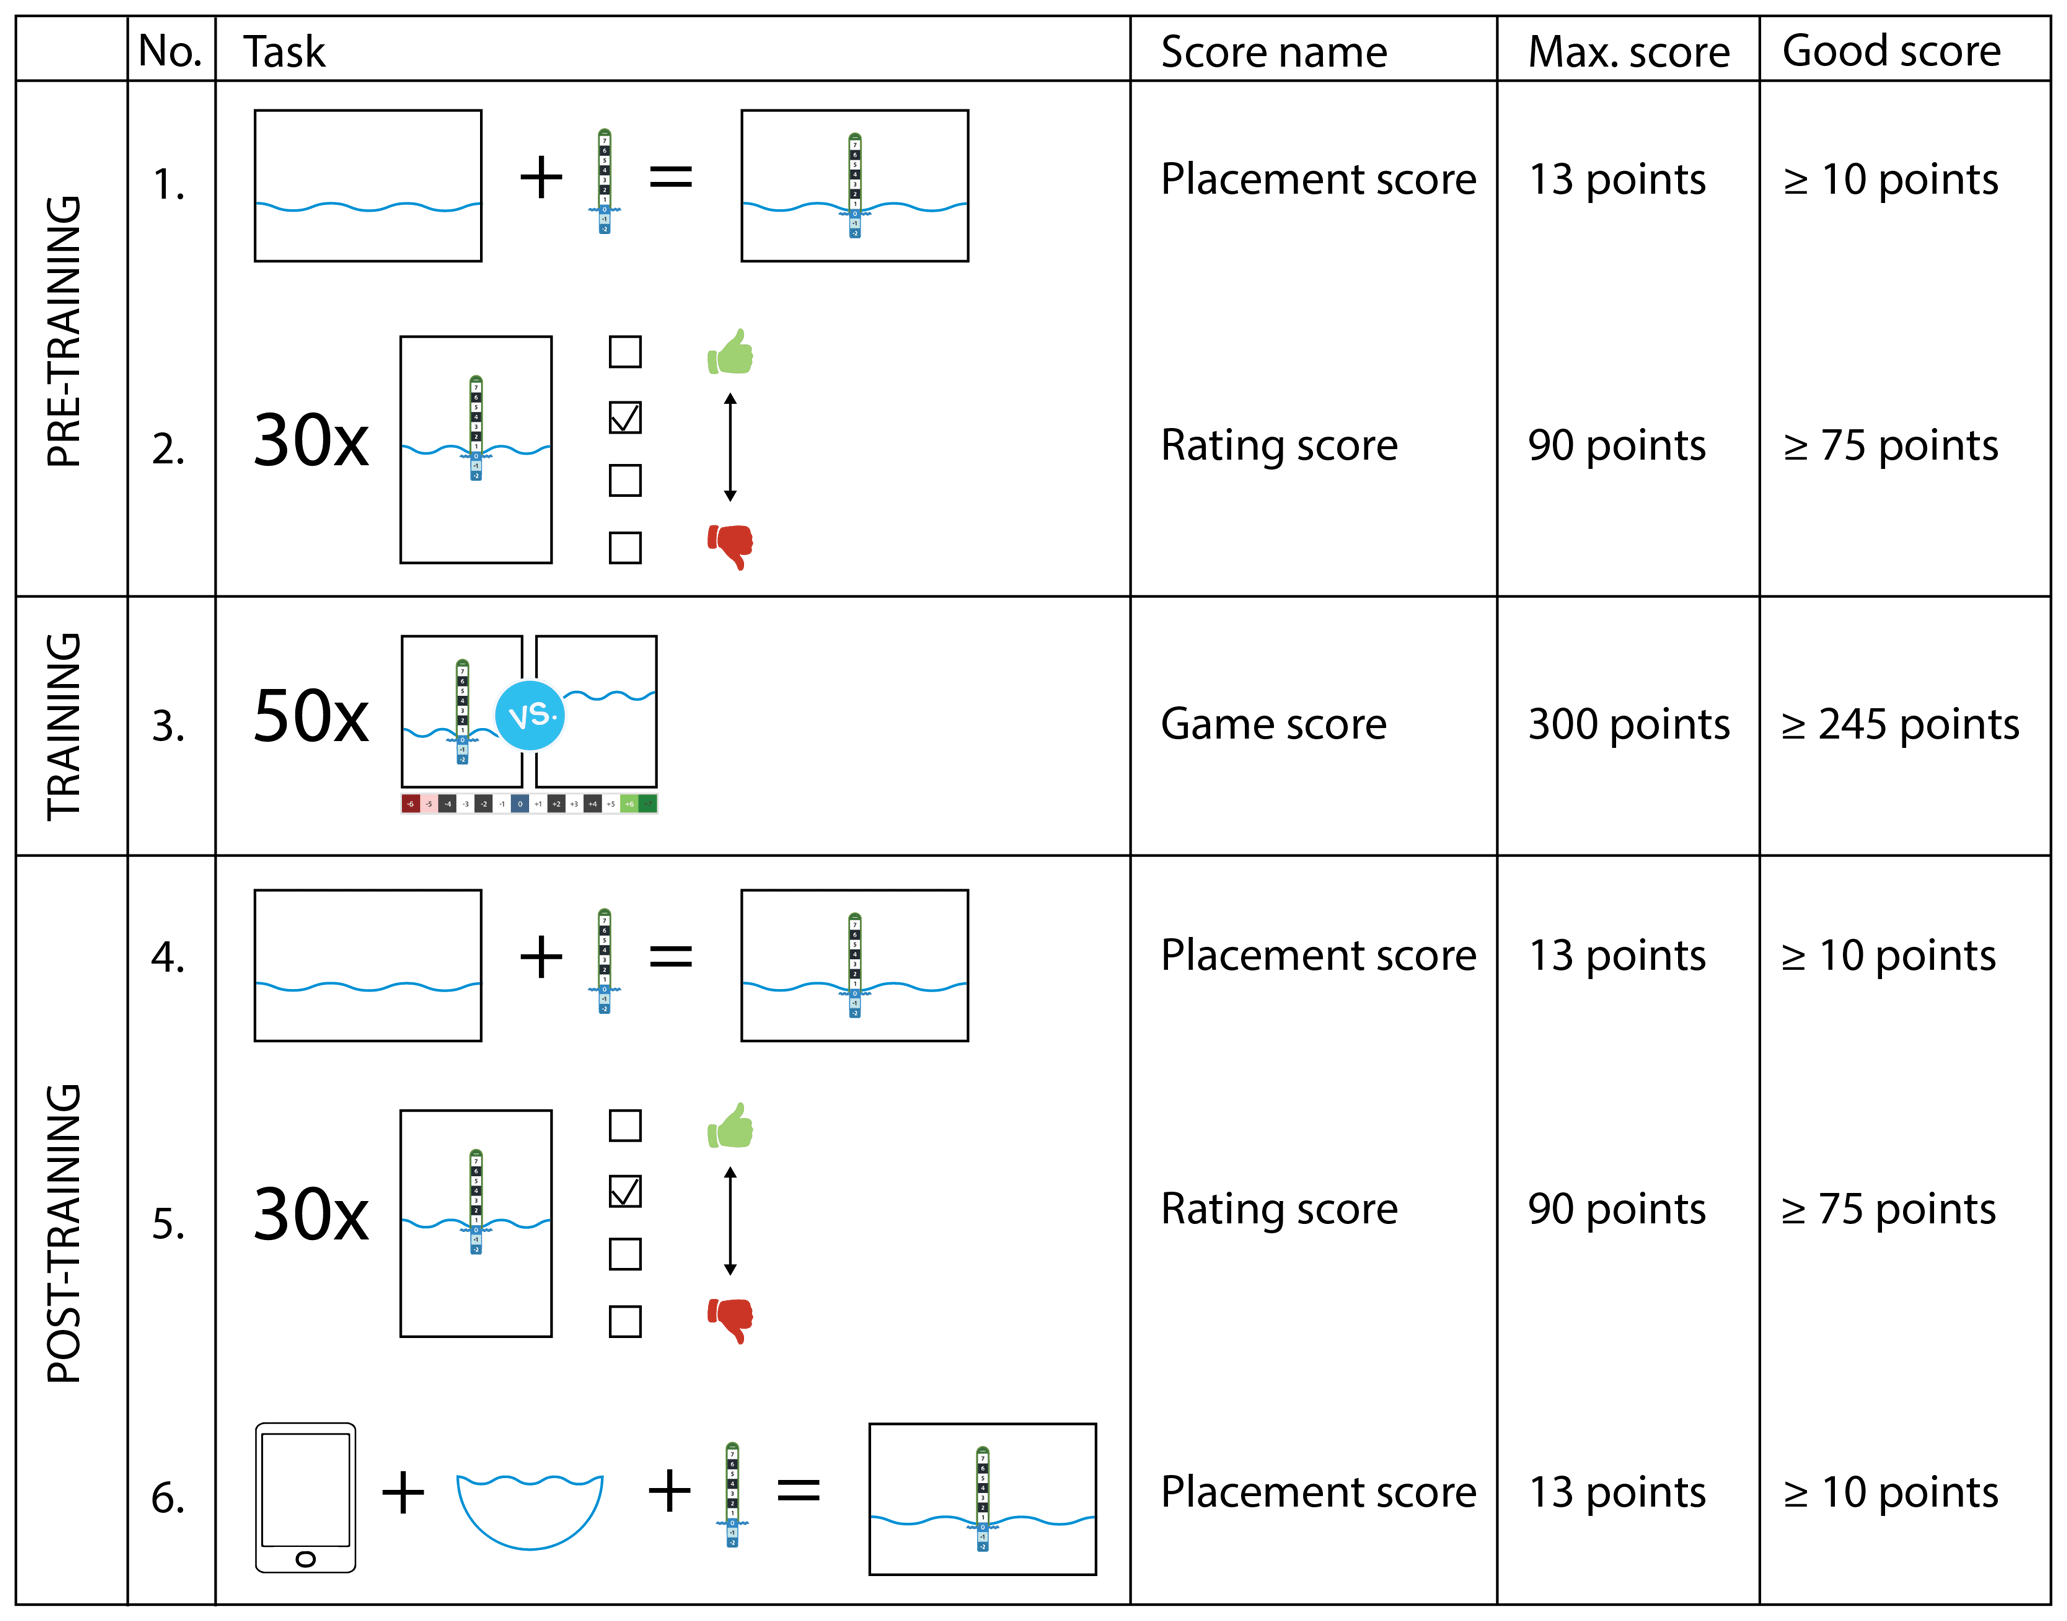
Figure 2Schematic overview of the pre-training, training and post-training tasks. For each task, the maximum number of points and the chosen value for good performance are given.
3.1.1 Study tasks
The six tasks of the training study can be divided into pre-training,
training and post-training tasks (Fig. 2). Each participant completed these
tasks in the same order. Pre-training and post-training tasks are only
intended to assess the participant's performance during this study and are
not part of the training for the CrowdWater project.
The pre-training tasks are structured as follows:
-
First task (staff gauge placement). The study participant looked at 18 stream pictures of the river Glatt (see the stream pictures in the Supplement). The pictures show the same location but were taken from different angles and perspectives. Some were well suited for placing a virtual staff gauge; others were moderately suitable; and some were not suitable at all. Without receiving any further information, the participant was asked to choose 1 of the 18 pictures and to place a virtual staff gauge onto the picture. This was done using an interface on the computer that looked similar to that in the CrowdWater app.
-
Second task (rating of reference pictures). The participant looked at 30 different reference pictures (for examples see “Examples of reference pictures for the rating task” in the Supplement). These pictures were chosen from reference pictures that were uploaded by citizen scientists using the CrowdWater app. The pictures were selected to represent a range of well, moderately and poorly placed virtual staff gauges. The participant rated each of the 30 reference pictures as “unsuitable”, “rather unsuitable”, “rather suitable” or “suitable”.
The training task is structured as follows:
-
Third task (game). The participant played an adapted version of the CrowdWater game. In this version, the participant estimated the water level class of 50 picture pairs. The regular CrowdWater game only offers 12 picture pairs per day, so this extended version corresponds to the training effect of about four rounds of the game. The participant did not receive any explanation on the game but could use the help button to obtain more information on the game.
The post-training tasks are structured as follows:
-
Fourth task (staff gauge placement). The participant repeated the first task and was asked to place the virtual staff gauge for the river Glatt again. The participant received the same 18 pictures but was free to choose another picture and to place the virtual staff gauge in a different location, angle or size compared to the first task or to choose the same picture and to place the staff gauge similarly.
-
Fifth task (rating of reference pictures). The participant repeated the second task for a different set of 30 reference pictures from the app. The distribution of well, moderately and poorly placed virtual staff gauges was roughly the same as in the second task.
-
Sixth task (staff gauge placement). The participant used the CrowdWater app outdoors (instead of the online interface used for the earlier tasks) to create and upload a reference picture for a stream of their choice. The task was meant to be completed within 2 weeks after completing the first five tasks. However, not every participant completed the task within this timeframe (at the latest by March 2019), and 10 participants did not complete this task at all.
After placing the staff gauge online (first and fourth task) and rating the reference pictures (second and fifth task), participants answered several questions to assess the difficulty of the task, their own performance, and their confidence in completing these tasks correctly. After the training (third task), participants were asked about the difficulty of the game and whether they thought the game was fun.
3.1.2 Assessment of the different tasks
The performance of the participants for the different tasks was evaluated based on a score. The scores before and after playing the game (i.e., the training) were compared to determine the effect of playing the game. The scoring system was determined prior to the start of the study according to assessment criteria that were based on previous experiences with pictures submitted through the app and expert judgement (by Barbara Strobl and Simon Etter). A separation of the individual scores into “good” and “poor” was, while somewhat arbitrary, necessary to be able to distinguish the effects of the training on the participants who needed it most, i.e. those who had poor performance (i.e., score) before the training.
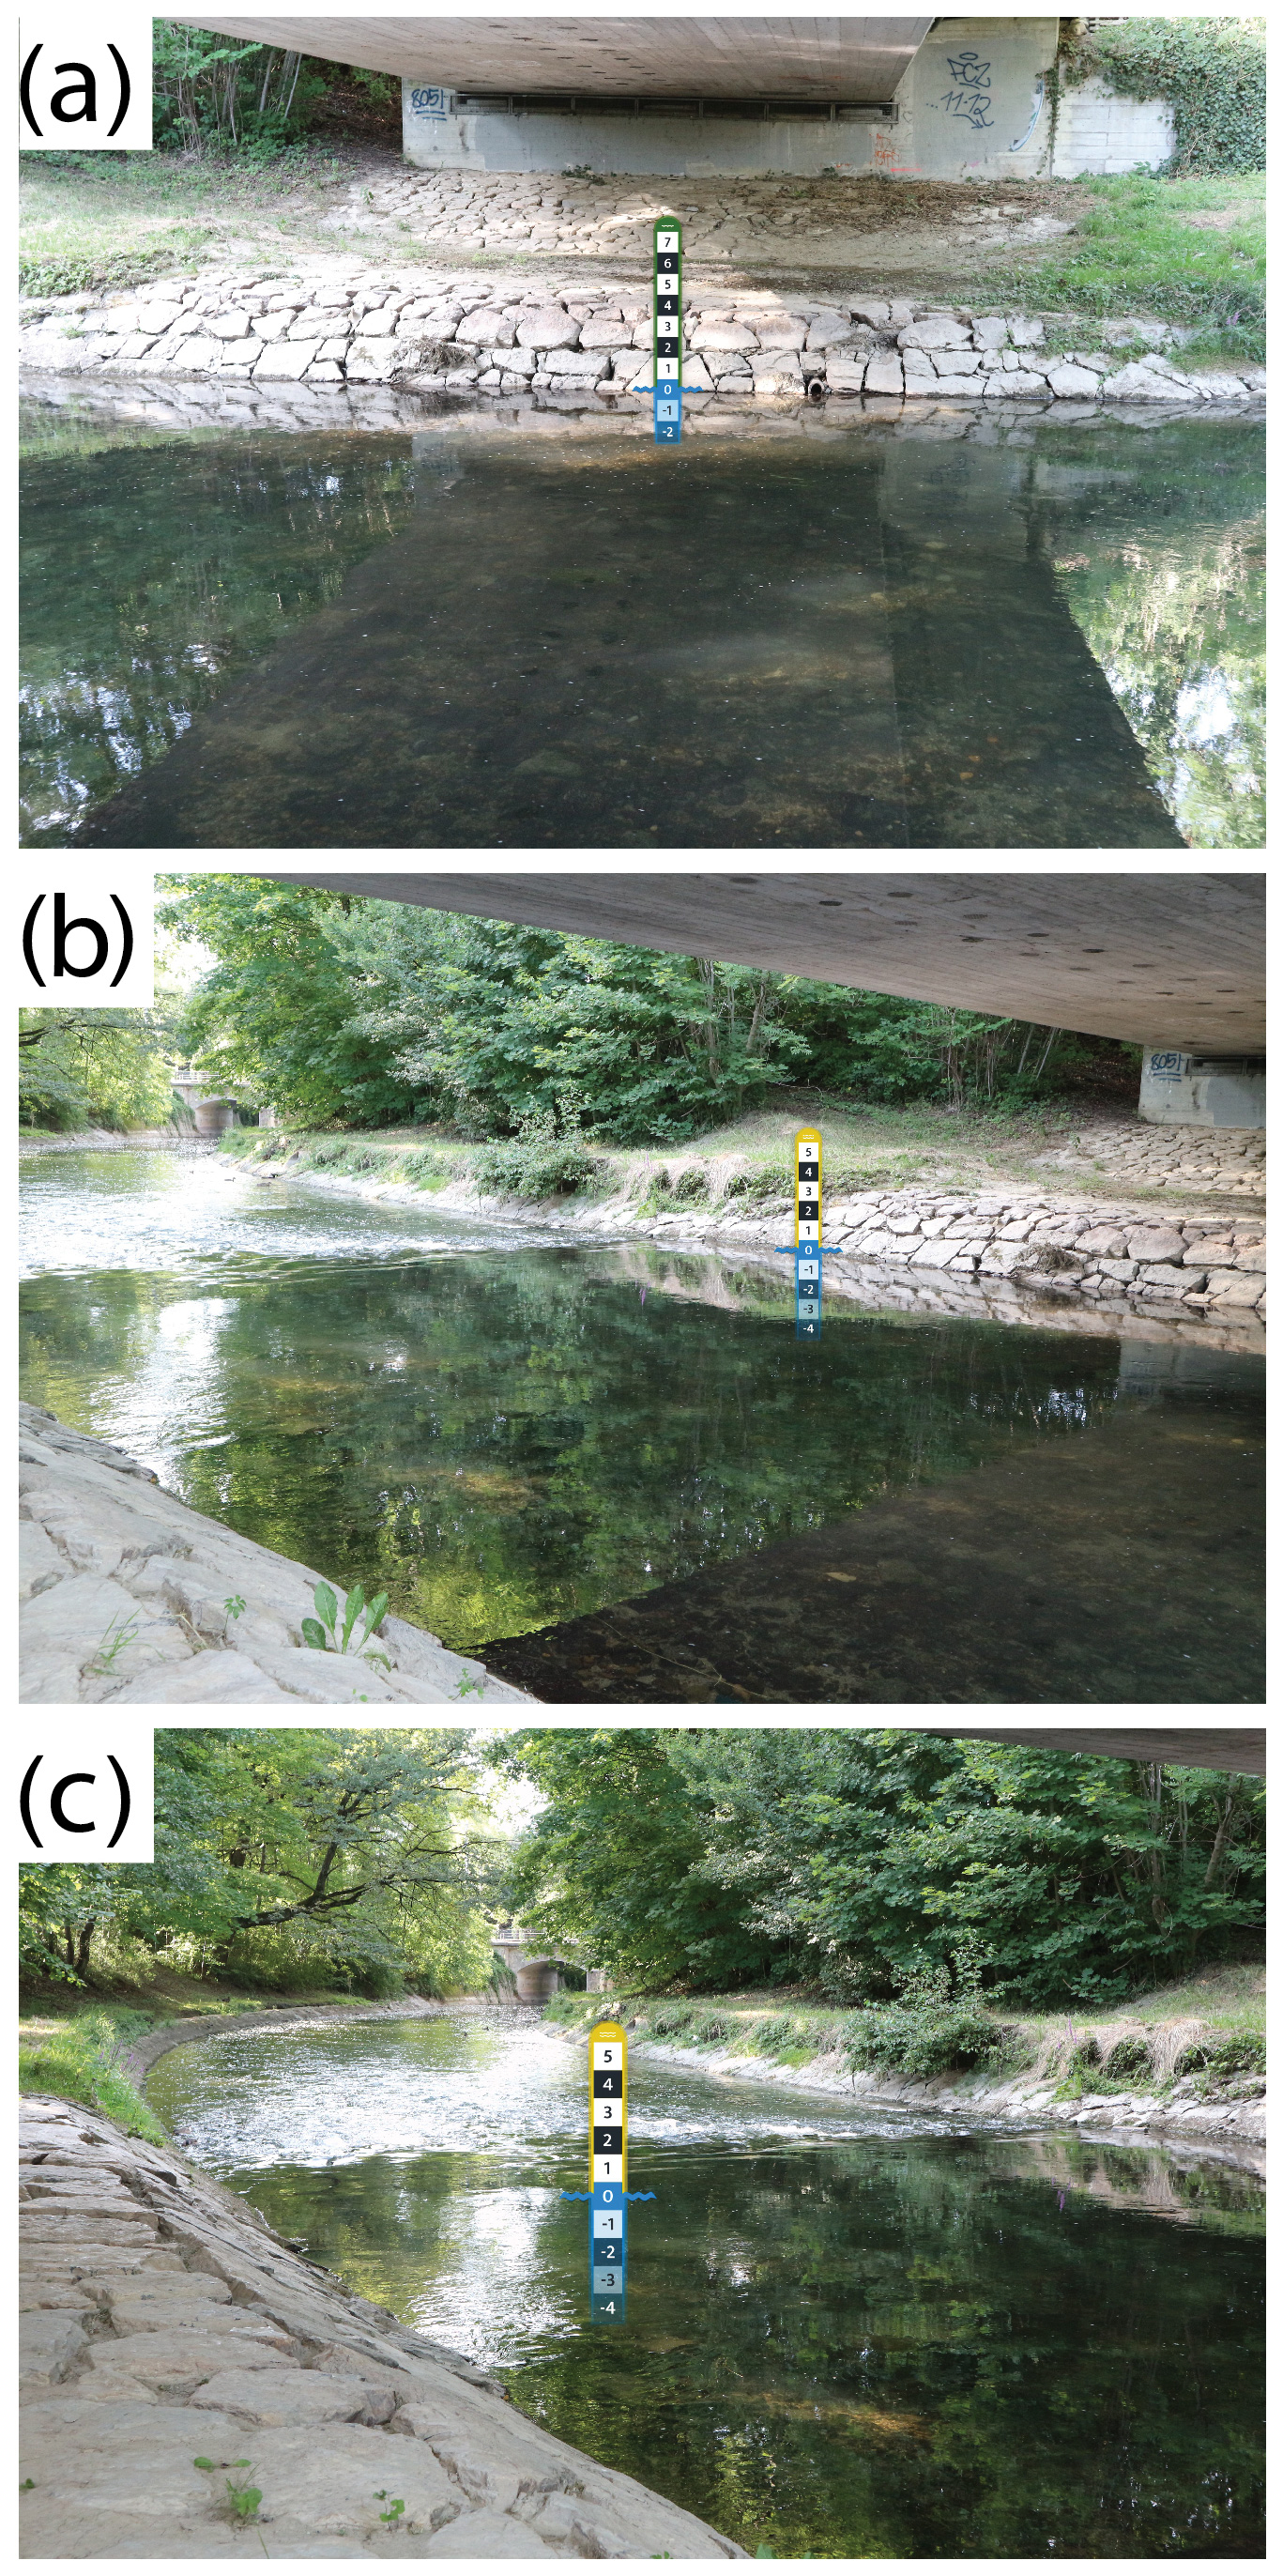
Figure 3Examples of staff gauge placements: (a) 13 points, i.e., a full score; (b) 10 points, just enough points to still be considered suitable for future water level observations; and (c) 3 points, the lowest score obtained throughout the study.
For the staff gauge placement tasks (first, fourth and sixth task), points were given for five different placement criteria. The maximum placement score was 13. A placement score of 10 or higher was considered good because these reference pictures can still be used and would have been left in the CrowdWater database if they were submitted through the app (Fig. 3).
Perspective of the picture. The 18 pictures of the river Glatt were taken from different angles and perspectives and assigned a score: 0 (unsuitable), 1 (rather unsuitable), 2 (rather suitable) and 3 (suitable). The participant could gain more points for the choice of the picture than the other criteria for placing a staff gauge because this is essential for a good reference picture. Because every participant fulfilled the outdoor task (sixth task) for a different stream and the participants could choose a location themselves, points could not be assigned a priori. However, the location and the picture frame were assessed, and a score between 0 and 3 was given based on expert judgement (by Barbara Strobl and Simon Etter).
Choice of the staff gauge. Participants could choose from three different virtual staff gauges depending on the water level at the time that the picture was taken (low, medium or high). The staff gauge for low flow was considered correct, as the water level was low at the time that the 18 pictures of the Glatt were taken. The score for the selected staff gauge varied between two (staff gauge for low flow), one (staff gauge for medium flow) and zero (staff gauge for high flow). For the outdoor task with the app (sixth task), the situation was assessed based on the water level, and points were assigned for the correct assessment of low, medium or high flow by the participant.
Location of the staff gauge. If the staff gauge was placed on the opposite stream bank, as it should be, two points were given; if the staff gauge was incorrectly placed on the participant's side of the stream or in the middle of the stream, zero points were given.
Angle of the staff gauge. The staff gauge should be placed perpendicular to the flow in the stream to avoid contortions of the perspective for future water level class estimates. If the staff gauge was placed perpendicular to the flow (±10∘), two points were given. If the angle was less than 45∘, one point was given, and if it was larger than 45∘, zero points were given.
Water level mark. The blue wave of the staff gauge should be located at the water surface in the reference picture. If this was the case, two points were given; if the blue wave was only slightly off, e.g., due to reflections on the water surface, one point was given; and if the blue wave was not placed on the water surface, zero points were given.
Very rarely, two virtual staff gauges were placed in the reference picture (twice before the training – first task, once after the training online – fourth task – and once after the training outdoors in the app – sixth task). We assume that this was most likely due to technical difficulties. In these cases, we subtracted one point from the participant's score. This, however, had hardly any effect on the results.
The rating of the reference pictures (second and fifth task) was evaluated using a rating score. The participant's choice between unsuitable, rather unsuitable, rather suitable and suitable was compared to the expert judgement of the reference pictures (by Barbara Strobl and Simon Etter). If the participant picked the same suitability class as the experts, three points were given. For each class deviation from the expert judgement, one point was subtracted. Thus the maximum score was 90 points (30 reference pictures times 3 points per picture). A score of 75, which corresponds to being off by one class 5 times and off by two classes 5 times and choosing the correct class 20 times, was still considered good.
For the training task (fifth task, the game), the participants received points for each picture pair that they compared. Similar to the actual CrowdWater game, they received six points if they chose the correct class, i.e. the median of the votes of all previous CrowdWater game players; four points if they chose a water level class that was one class away; and zero points if they chose a class that was more than one class away from the median. When reporting a picture pair, the participant received three points. The maximum score for the training task was 300 points (a maximum of 6 points times 50 picture pairs). The threshold for a good game score was determined before the study and set at 245 points, which reflects a situation where a participant chose the correct class for 35 out of the 50 picture pairs, was one class off five times, was more than one class off for another 5 picture pairs and reported five pictures (we considered five pictures unsuitable and would thus have reported them).
3.1.3 Data analysis
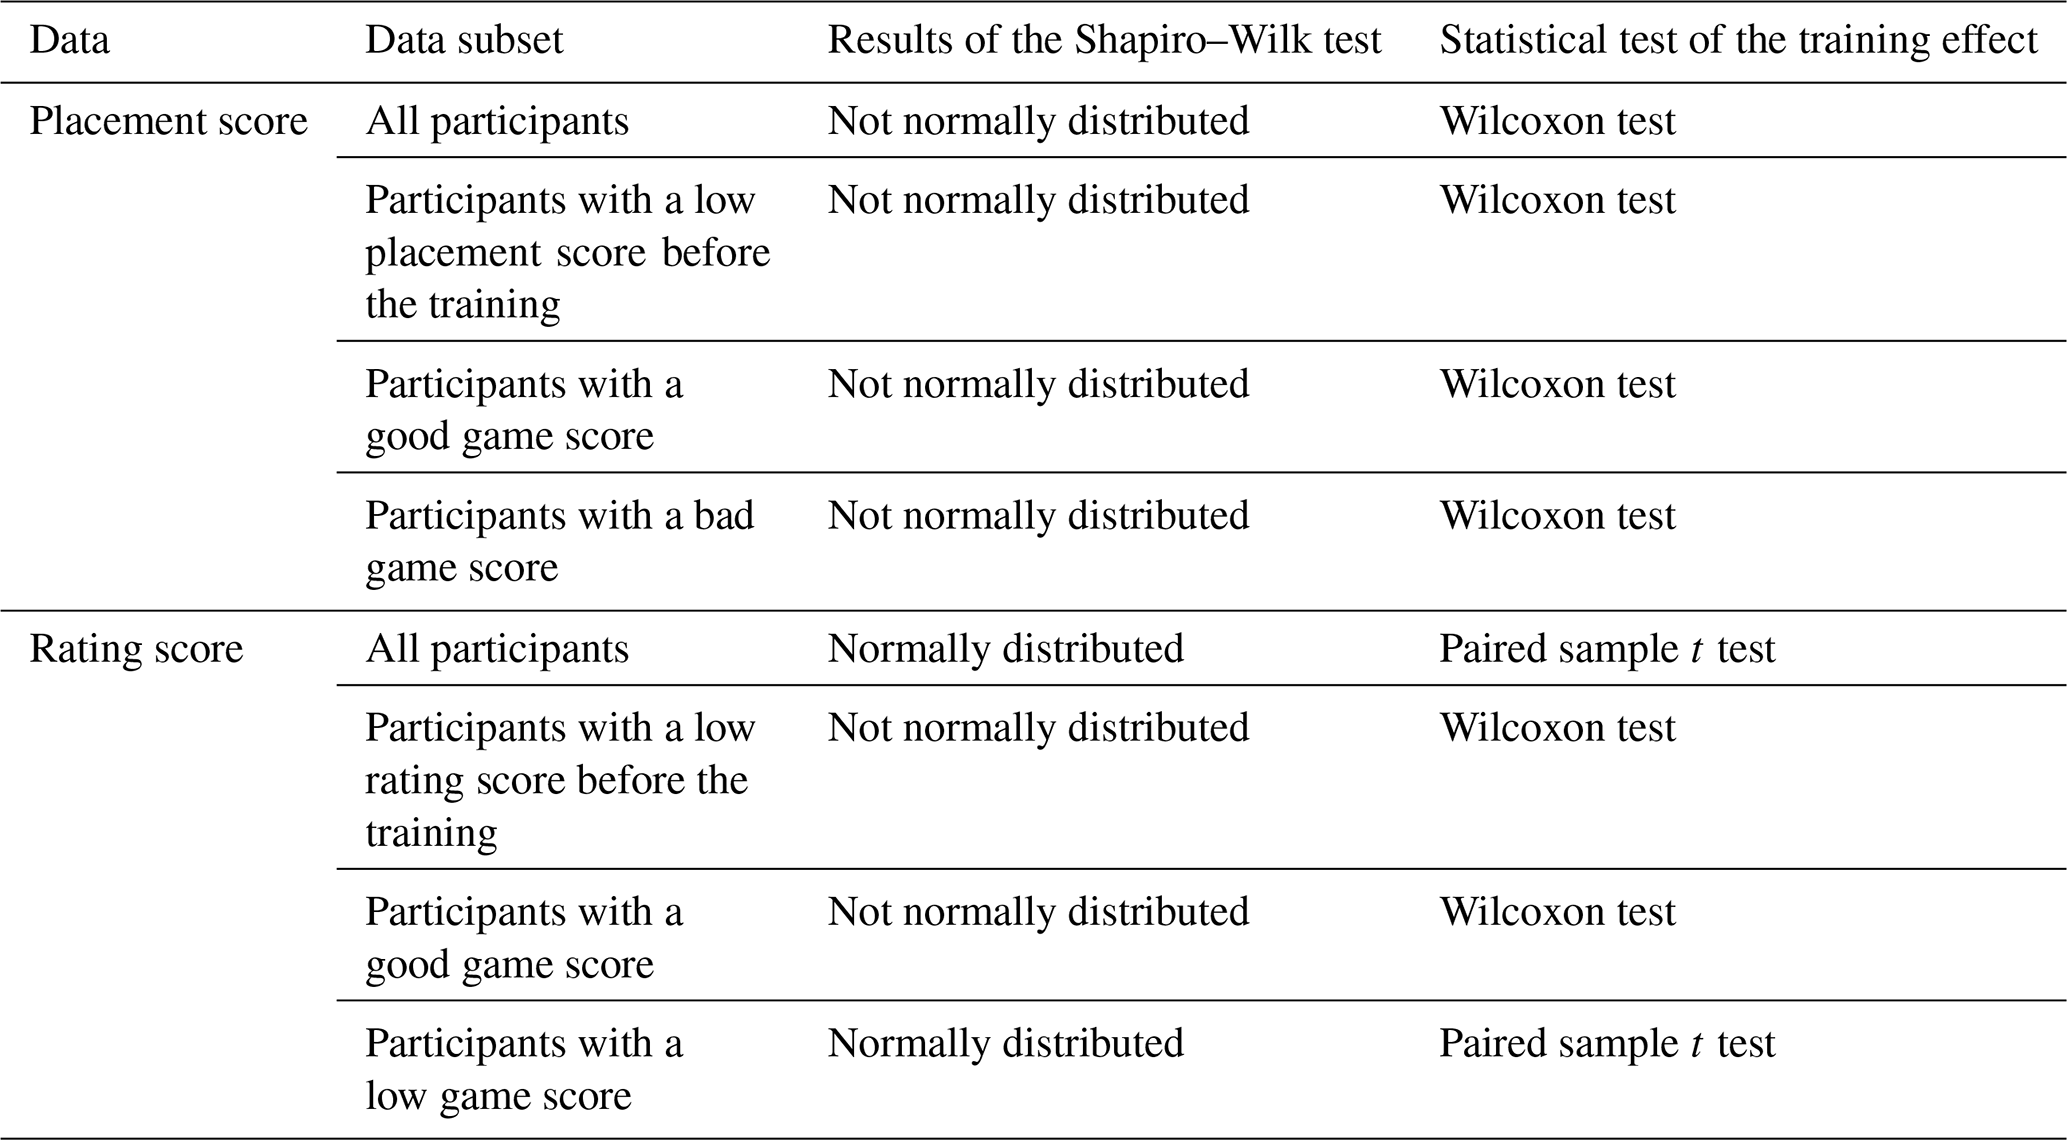
The scores for the staff gauge placement and rating tasks before and after the training were compared for each participant using two paired statistical tests: the paired sample t test for normally distributed data and the Wilcoxon test for data that were not normally distributed (Table 1). We used a one-sided test to check whether the difference in the scores before and after the training was larger than zero and a two-sided test to determine the significance of the difference in the scores between the computer-based and the outdoors app-based staff gauge placement (i.e. between the fourth and the sixth task). We used a significance level of 0.05 for all tests. We performed the tests for all participants together but also divided the participants based on their placement score before the training (first task) in order to determine the effect of training for people who initially did not install the virtual staff gauge correctly. In order to see whether the game performance was related to the improvement in the placement or rating score, we also split the data based on the game score. We used Spearman rank correlation (rs) to evaluate the relation between performance (i.e., scores) and the confidence of the participants in their performance, as well as between the performance and the stated difficulty and fun rating.
Table 1The statistical tests were chosen based on whether or not the data were normally distributed according to the Shapiro–Wilk test. The tests for the placement score compared scores from before and after the training, as well as after the training and outdoors with the app. The test for the rating score compared scores from before and after training.
3.2 Study participants
The participants for this study were recruited through various channels. The University of Zurich offers a database with potential study participants in the vicinity of Zurich; people in this database were contacted via email. Additional emails were sent to staff and students of the Department of Geography. Friends, colleagues and family helped to recruit participants from their social network as well. Local study participants could complete the online part of the study in a computer room at the University of Zurich at specified times; all other participants received the link and completed the study on their own. All participants completed the first five tasks individually in one session.
The participants in this study had neither previously used the CrowdWater app nor played the CrowdWater game. In total, 52 participants completed the first five tasks of the study. Of these 52 participants, 10 did not complete the outdoor app task, but their results were included in the analyses as far as possible. When sending email reminders to complete this sixth task, several participants indicated a lack of time or a suitable nearby river. Most of the 10 participants intended to complete the task but forgot about it in the end. Of the 52 participants, 32 (62 %) were female, and 20 (38 %) were male. Age data were collected in age groups: 6 % of the participants were under 20 years old; 79 % of the participants were 21–40 years old; 8 % were 41–60 years old; and 8 % were 61–80 years old. The highest education level was secondary school for 4 % of the participants, high school for 12 % of the participants, university (BSc, MSc or similar) for 79 % of the participants and a PhD for 6 % of the participants. The education level being higher than the Swiss average and the relatively large group of young people (< 40 years) are due to the recruitment of the participants at the University of Zurich. The education level of the CrowdWater citizen scientists is unknown, but 89 % of the 36 CrowdWater game players who filled in a survey about the game were university educated, and 75 % were under the age of 40 (Strobl et al., 2019a). For a survey about the motivations of CrowdWater app users, as well as citizen scientists from a different phenological citizen science project (Nature's Calendar ZAMG; Zentralanstalt für Meteorologie und Geodynamik), 66 % of the respondents were university educated, and 51 % were under the age of 40 (Etter et al., 2020).
4.1 Training results
Almost two thirds (62 %) of the study participants had a good score (≥245 points) for the game. The highest game score was 274, and the average score was 248. The lowest score (160 points) was an outlier; the second-lowest score was 211 points (Fig. 4). Interestingly the participant with the lowest game score found the game “rather difficult” but still “a bit of fun”, adding “It [the game] was quite tricky. I was curious if my answer is right or wrong”.
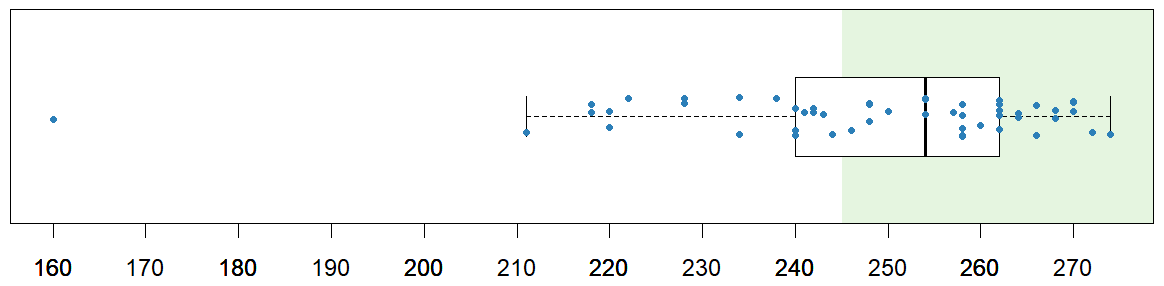
Figure 4Boxplot of the game score for each study participant. Scores ≥245 points are considered good (indicated by the green background). The box represents the 25th and 75th percentile; the line is the median; the whiskers extend to 1.5 times the interquartile range. The individual scores (blue dots) are jittered to improve the visibility of all points.
In the game, participants can report a picture pair if they think that it is not possible to vote on a water level class. The reason for reporting a picture pair can be selected from a drop-down menu. The report function was used by 16 participants (31 %). It is unknown if the other 36 participants did not find the report function or if they did not think it was necessary to report any of the picture pairs. Most of the participants who used the report function reported between 1 and 6 picture pairs, but one participant reported 10, and another participant reported 12 picture pairs. Out of the 50 picture pairs in the game, 22 were reported at least once, and 1 picture pair was reported seven times. When choosing the 50 picture pairs for the game, we included 5 picture pairs that should be reported (Fig. 5). In other words, there were 57 reports in total, 38 of which were not valid (i.e., our expert knowledge suggests that the picture pairs could be used to determine the water level class). For some of these cases, participants considered a spot unsuitable because they did not realize that they could see the entire picture if they clicked on it and therefore thought the reference picture did not have a staff gauge. In another case, they may have been confused by a slightly different angle in the picture for the new observation. The most common reason for reporting a picture was “The location has changed, and the reference image is unrecognizable”. This was indeed a problem with some of the picture pairs (Fig. 5).
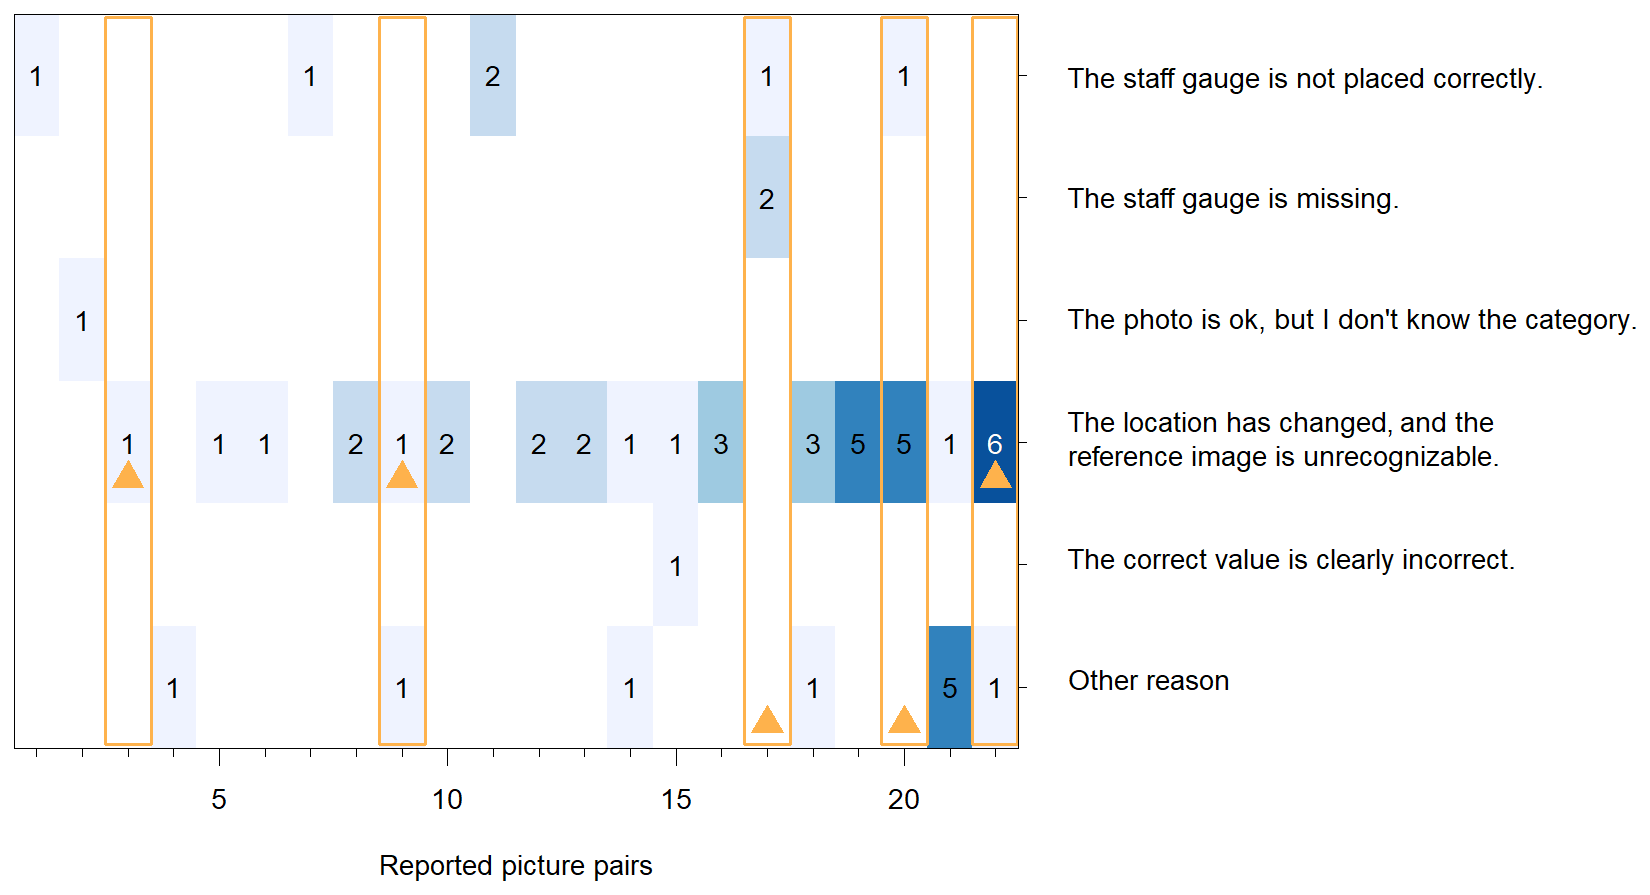
Figure 5The number of times that a picture pair was reported and the reason for reporting the picture pair (y axis) for the 22 picture pairs in the game that were reported at least once (x axis). The picture pairs that should have been reported based on expert assessment prior to the training study are framed with an orange rectangle; the orange triangle indicates the reason based on expert assessment. The blue shading represents the number of reports per picture pair (as also indicated by the printed number).
4.2 Staff gauge placement
4.2.1 Placement scores before training
The staff gauge placement score before the training (first task) was 10 or higher for 70 % of the participants; i.e., the majority of the participants placed the staff gauge in a way that is suitable for further observations. This is a good performance considering that the participants had not yet received any training. Training is more important for the 30 % of participants who had a low placement score before the training. The lowest scores were two points (one participant) and three points (two participants).
4.2.2 Placement scores after training
The placement scores generally improved after the training and were statistically significantly better than the scores before the training (Wilcoxon test, p<0.01; Fig. 7). Improvement is especially important for the participants who had a low placement score before the training. Therefore, the participants with a low initial score (< 10 points) were assessed separately. For this group, the median placement score improved significantly with training as well (Wilcoxon test, p<0.01). Of the 16 participants with a poor placement score before the training, 10 improved their staff gauge placement sufficiently to make it useful for future observations. Participants who performed well before the training have less possibility of improving the placement and also need to improve their placement score less. However, for two of the participants with a good score before the training, the score was poor after the training (Figs. 6 and 7). The placement score improved for participants with a good game score (Wilcoxon test, p<0.01) but not for participants with a low game score (Wilcoxon test, p=0.11).
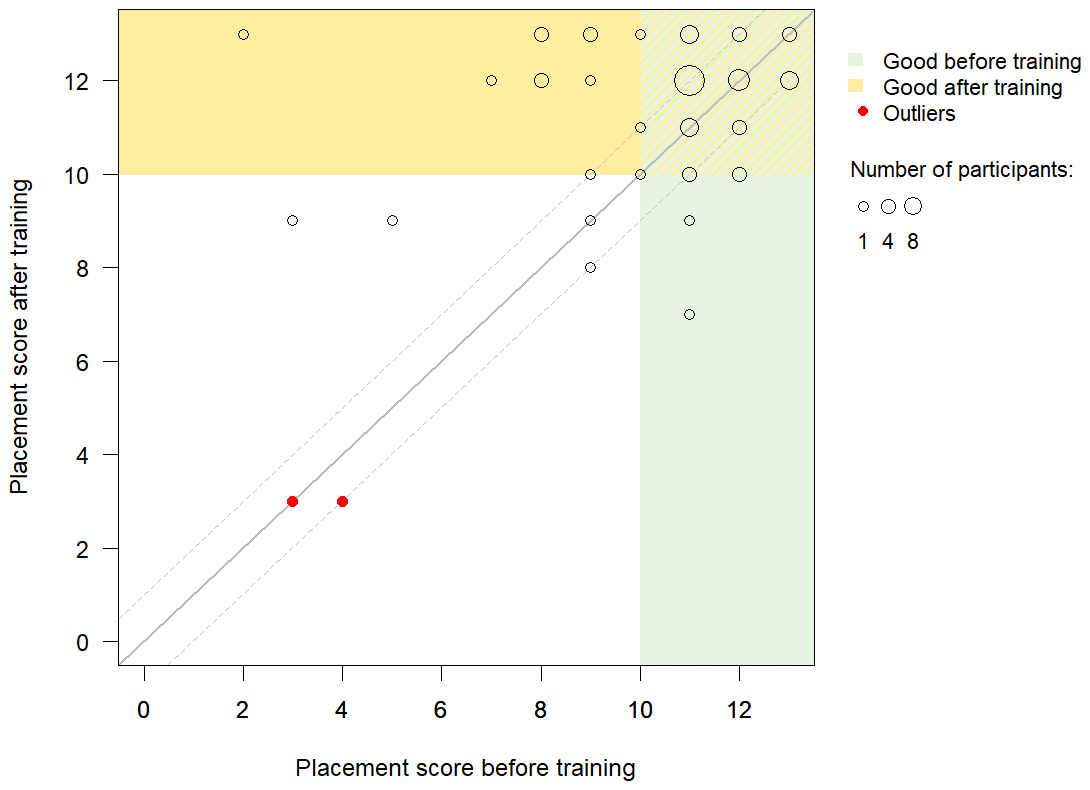
Figure 6Placement scores before the training (x axis) and after the training (y axis). The circle size indicates the number of participants with the same scores. The green background indicates participants who had already performed well in placing the staff gauge before the training (score ≥10), and the yellow background indicates participants who performed well after the training (score ≥10). The solid grey line indicates the 1:1 line (i.e., the same score before and after the training), while the dashed lines indicate a difference of only one point. Points in the upper-left triangle indicate an improvement in staff gauge placement after the training. The red circles indicate outliers.
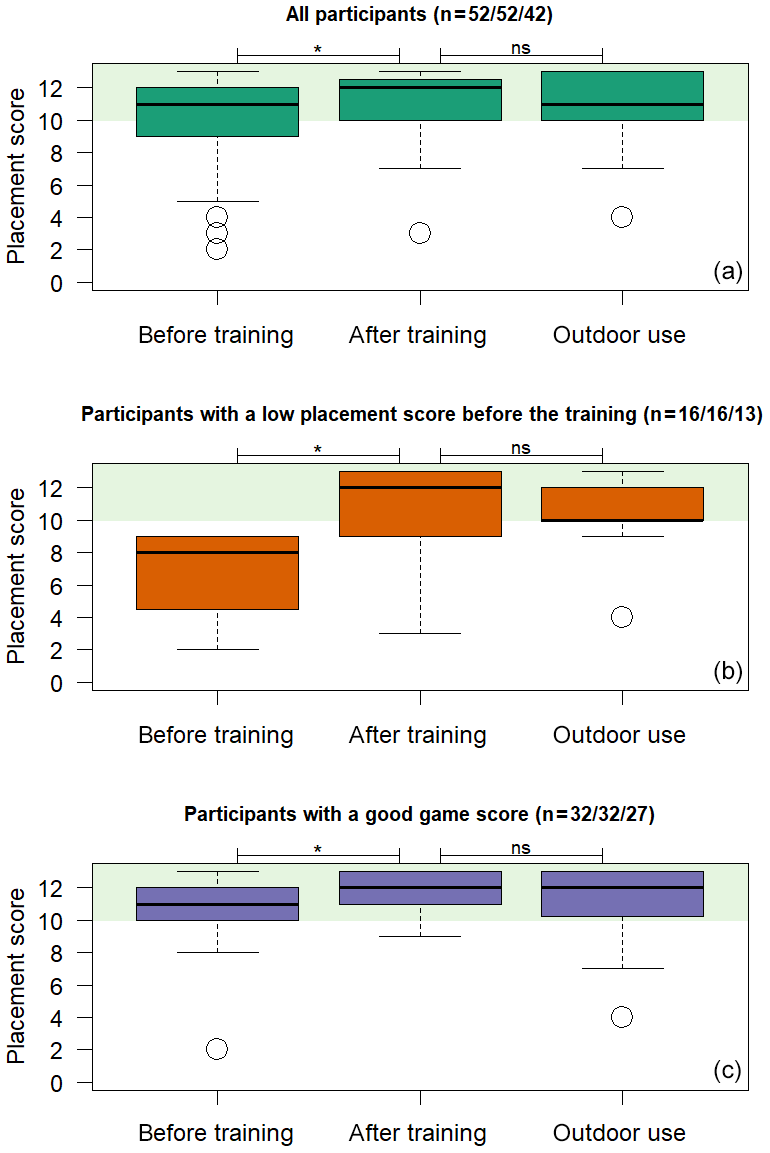
Figure 7Box plots of the placement scores before the training (first task), after the training online (fourth task) and outdoors with the app (sixth task) for all participants (a), for participants who had a low placement score before the training (b) and for participants who had a good game score (c). There was a statistically significant difference in the placement scores before and after the training for all groups (indicated by *) and no statistically significant difference between the computer-based task and the outdoor app task (indicated by “ns”) after the training based on the Wilcoxon test (p<0.05). The green shading indicates a good score.
A total of 19 participants (37 %) picked a different picture for the staff gauge placement after the training. Eight of these participants chose a stream picture with the same suitability score as the first one; nine selected a better stream picture; and two chose a picture that was worse than their original choice. The other 33 participants chose the same stream picture as before. The good scores even before the training suggest that most of them also did not need to change the picture. The participants who changed the stream picture had a median placement score of 9 before the training and 12 after the training. The participants who chose the same stream picture had a median placement score of 11 before the training and 12 after the training. Before the training, 37 participants chose a reference picture with a score of 3, 9 with a score of 2, 5 with a score of 1, and only 1 participant chose a reference picture with a score of 0. Of the six participants who had a score of 0 or 1 before the training, four chose a reference picture with a score of 2 or 3 after the training. For two participants the reference picture score remained 1.
Except for one participant, all participants who performed well in the training task (game score ≥245 points) had a good placement score (≥10) after the training. However, the opposite was not the case: participants with a low game score (< 225 points) sometimes still improved their placement score after the training, and all had a good placement score (≥10) after the training (Fig. 8). The participant with the most substantial improvement in staff gauge placement (from 2 points to 13 points) had an excellent game score of 262 points (Fig. 8). Participants who obtained a low score for the staff gauge placement after the training all had an average score in the game (228–243), except for one participant with a high game score (248; Fig. 8).
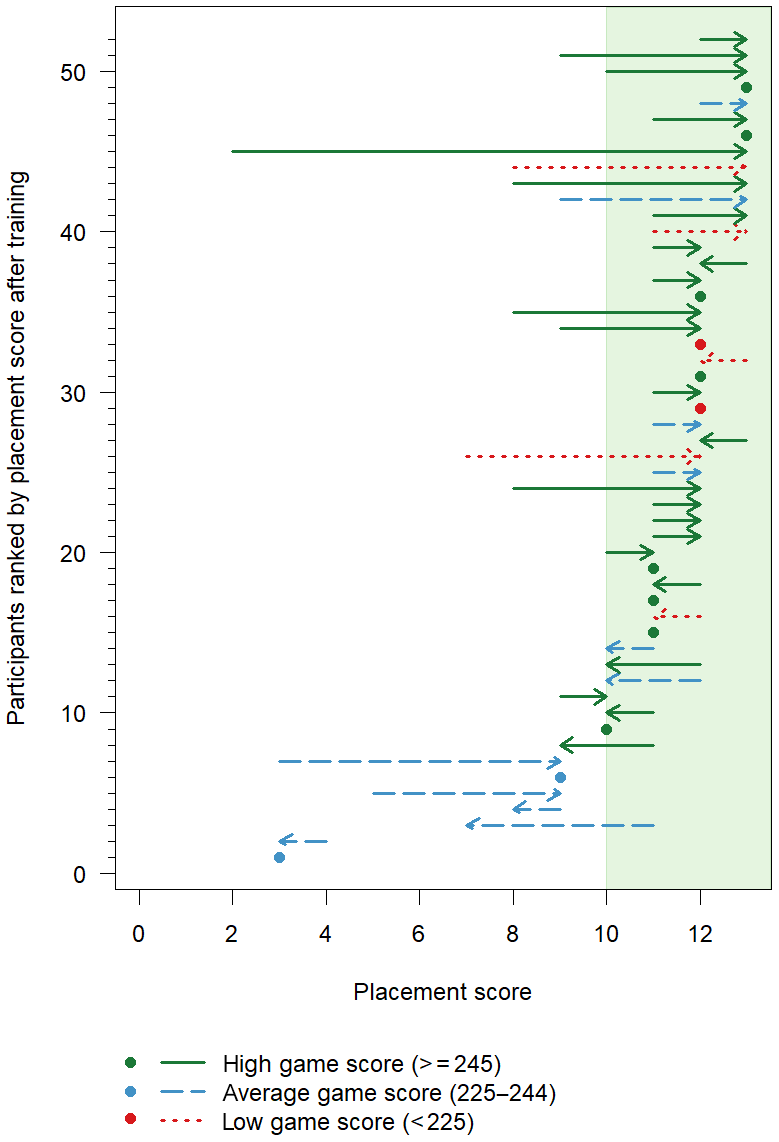
Figure 8Placement scores before and after the training (x axis) per participant (y axis). Arrows point to scores from before to after training. Dots indicate no change in the placement score and are coloured according to the game score they obtained during the training.
There was no statistically significant difference between placement scores after the training for the online (fourth task) and the outdoor task with the app (sixth task), neither for all participants (p=0.50), for participants with a low placement score before the training (p=1.00), nor for participants with a good game score (p=0.20) or for participants with a bad game score (p=0.57; Fig. 7). This indicates that the online task can be used as a proxy for handling the app.
4.2.3 Placement score outliers
When plotting the placement score before the training and after the training, two outliers were visually identified (Fig. 8). Both participants had a low score before the training and, unlike other participants, also a low score after the training. These two participants received few points across all assessment criteria for staff gauge placement and also had a below-average game score (242 and 228 points). They rated the game as rather difficult and very difficult, and when asked whether they enjoyed playing the game, they rated it neutral and stated that “It wasn't fun at all”. Surprisingly both participants were confident that the reference picture for the staff gauge placement was rather suitable. Both participants changed their impression of the difficulty of the staff gauge placement (first task) from very easy before the training to rather easy and neutral after the training (fourth task).
4.3 Rating of reference pictures
4.3.1 Rating scores before the training
Even though the majority of the participants received a good staff gauge placement score before the training, only 13 % of the participants had a good rating score (≥75) before the training. The highest rating score before the training was 80, and the lowest score was 54; the average score was 68 points. Only 9 % of the participants had a good score for both staff gauge placement and rating before the training.
4.3.2 Rating scores after the training
The rating scores improved after the training (Figs. 9 and 10). The median difference in the rating score before and after the training was statistically significantly larger than zero, for all participants (paired-sample t test, p<0.001), for participants with a low rating score before the training (Wilcoxon test, p<0.001), for participants with a good game score (Wilcoxon test, p<0.001) and for participants with a low game score (paired-sample t test, p=0.02; Fig. 10).
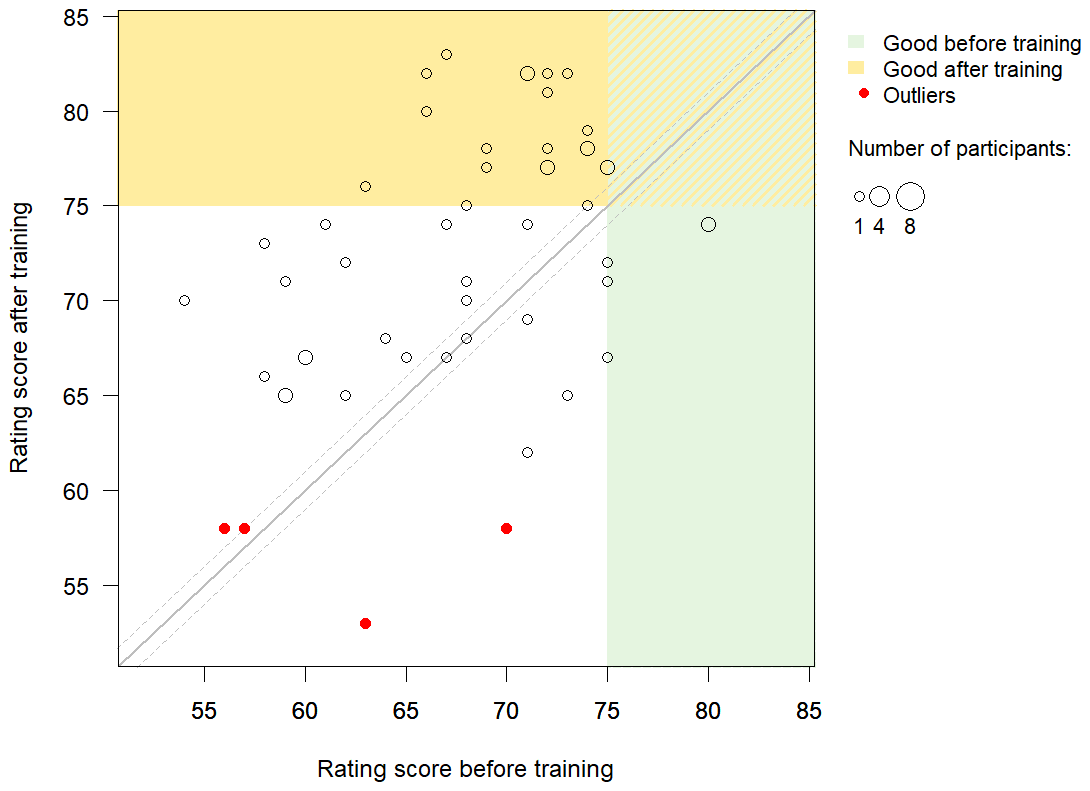
Figure 9Rating scores before the training (x axis) and after the training (y axis). The circle size indicates the number of participants with the same scores. The green background indicates participants who had already performed well (score ≥75) before the training, and the yellow background indicates participants who performed well after the training (score ≥75). The solid grey line indicates the 1:1 line (i.e., the same score before and after the training), while the dashed lines indicate a difference of only one point. Points in the upper-left triangle indicate an improvement in the rating score after the training. The red circles indicate outliers.

Figure 10Boxplots of the rating score before and after the training for all participants (a), for participants who had a low rating score before the training (b) and for participants who had a good game score (c). The difference was statistically significant for all groups based on the Wilcoxon test (p<0.05; indicated by *). The green shading indicates a good rating score.
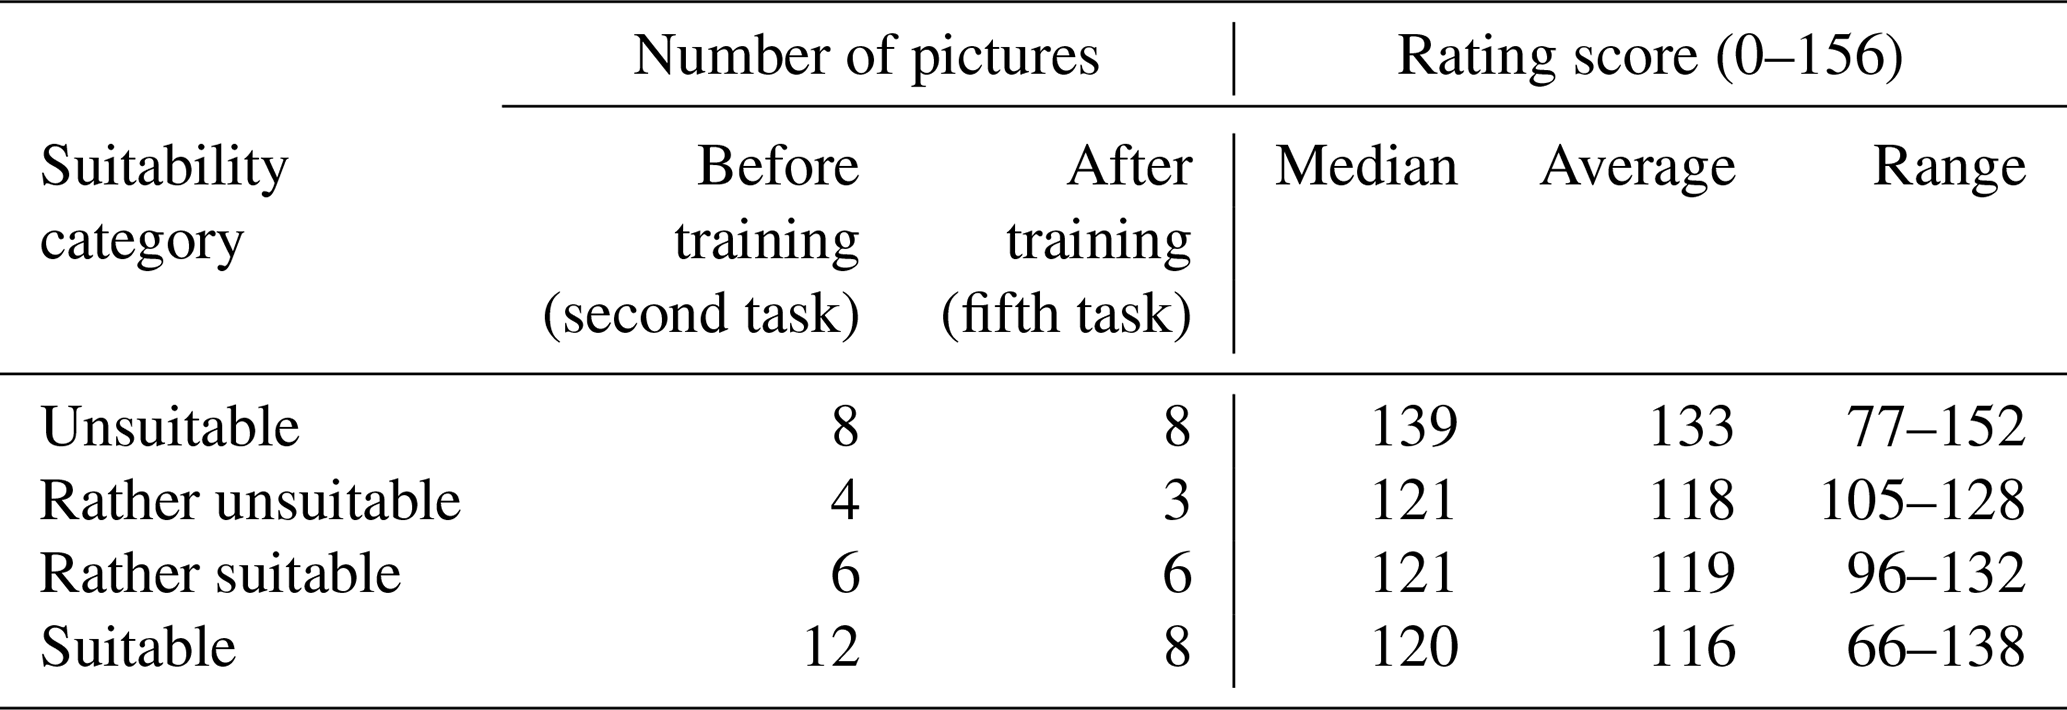
The rating scores can also be analysed per picture. A single picture can receive between 156 points (all 52 participants chose the correct suitability class and received 3 points) and 0 points (all participants chose the suitability class that is furthest from the correct class). The score was higher for the reference pictures that were considered to be unsuitable by the experts before the study (median: 139; range: 77–152) than for the pictures that the experts rated as suitable, rather suitable and rather unsuitable (median: 120–121). This indicates that participants were better at identifying the unsuitable pictures than the more suitable pictures (Table 2).
Table 2Number of pictures to be rated before and after the training per suitability category (as determined prior to the study by the experts) and the median, average and range in rating scores for the pictures in each category. Each picture can receive a maximum rating of 156 points (i.e., all 52 participants chose the correct category and therefore gained three points).
4.3.3 Rating score outliers
Outliers for the rating scores were less obvious than for the placement scores, although there appear to be four outliers (Fig. 9, red circles). One participant was also an outlier for the staff gauge placement. The game scores and the assessment of difficulty and fun of the game varied for these four participants. The confidence in their own performance when rating the reference pictures was mixed before the training, but it was never lower than neutral. After the training, all four participants were confident in their performance and found the task either rather easy or very easy.
4.4 Confidence, difficulty and fun
4.4.1 Confidence and difficulty in staff gauge placement and rating the reference pictures
The participants were in general quite confident in their performance, and their confidence increased after the training (from 67 % to 98 % of participants for staff gauge placement and from 62 % to 90 % for rating the reference pictures; Fig. 11). As shown above for the outliers in the placement score and rating score, the participants' confidence in their performance was not correlated with their actual performance, neither before nor after the training (; p≥0.11).

Figure 11Percentage of participants who chose a certain confidence level (a, b) and their assessment of the difficulty of the task (c, d) for the staff gauge placement (a, c) and rating of reference pictures (b, d) before the training (x axis) and after the training (y axis). Darker colours indicate that a higher percentage of participants chose these options.
Before the training, participants thought that the placement of the staff gauge was a relatively easy task, but the level of difficulty was roughly equally split between difficult, neutral and easy for the rating of the reference pictures (Fig. 11c, d). Participants generally considered the tasks easier after the training (72 % of the participants said that the placement of the staff gauge was easy before the training vs. 84 % of the participants after the training; 43 % of the participants thought that rating the reference pictures was easy before the training vs. 71 % after the training). Similar to the results for confidence, the assessment of the difficulty of the task was not related to the performance, neither before nor after the training (6; p≥0.30).
4.4.2 Difficulty and fun of the game
Of the participants, two thirds thought that playing the game was fun, but when rating the difficulty, they were almost equally split between difficult, neutral and easy (Fig. 12). All participants who thought that the game was not fun (21 %) thought that the game was either difficult or neutral. The level of fun and difficulty was correlated (rs=0.43; p<0.01). Nonetheless, 11 % of the participants stated that they had fun during the game but also thought it was difficult.
4.5 Feedback
Participants had the option to provide unstructured feedback at the end of the online study (after the fifth task); 15 participants decided to do so. Five participants mentioned different issues that had been unclear to them during the study, and four commented that they had enjoyed taking part in the study; two specifically mentioned that they thought that the training had helped them to understand the virtual staff gauge approach, but one participant stated that they thought the training had not helped. Two participants stated that they thought the study was difficult, and two gave feedback on the technical implementation of the study.
5.1 Does the CrowdWater game help participants to place the virtual staff gauge in a suitable way?
The virtual staff gauge approach was developed as an intuitive approach to collect water level data so that many citizen scientists would be able to contribute observations to the CrowdWater project. Such a simple approach is often recommended to citizen science project initiators (Aceves-Bueno et al., 2017). Many other citizen science projects, such as CrowdHydrology and iNaturalist, also deliberately chose to keep the data collection method easy so that citizen scientists do not require training prior to participation (Gaddis, 2018; Lowry et al., 2019).
When starting a new CrowdWater location for water level class observations, the most difficult task is placing the staff gauge. This is also the first thing that most citizen scientists who use the CrowdWater app do. Recording follow-up observations in the app is much easier than placing the virtual staff gauge. However, the staff gauge placement is an essential task, as all subsequent observations of water level classes are based on the reference picture. A well-placed staff gauge makes the subsequent observations easier, more reliable and more informative. This is not ideal, as the citizen scientist might not have fully understood the concept of the virtual staff gauge yet when making the first observation. Mistakes in the placement of the virtual staff gauge occur in about 10 % of the cases.
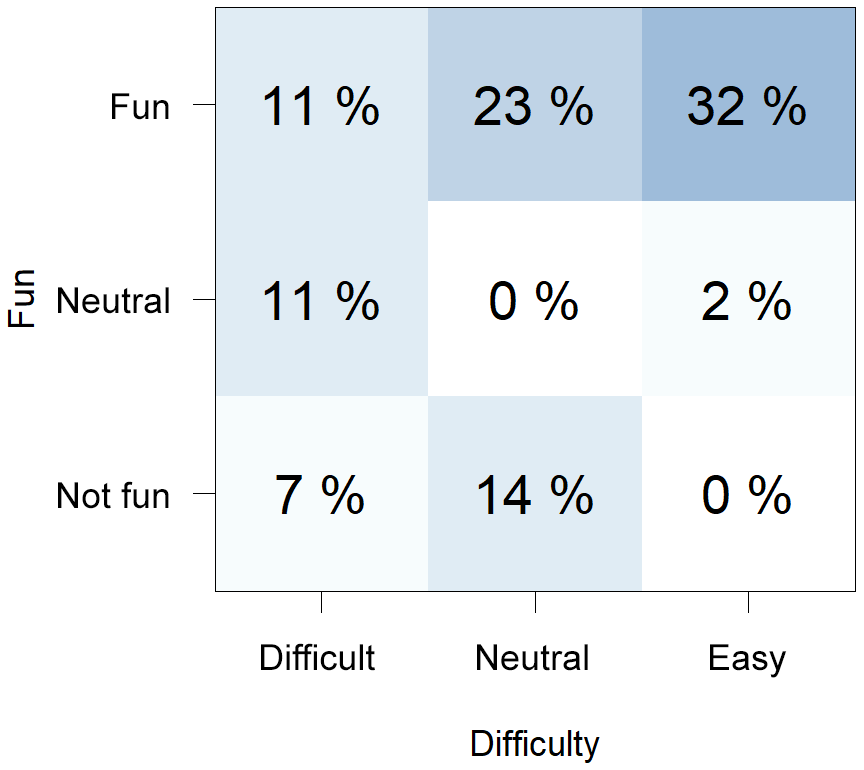
Figure 12Percentage of participants who chose a certain category for the difficulty (x axis) and fun (y axis) of the game. Darker colours indicate that more participants chose these options.
In this study, most participants (70 %) were already good at placing a staff gauge, even before receiving any training. This indicates that the virtual staff gauge is indeed intuitive to use. Training is especially important for the participants who did not place the staff gauge well before the training, i.e., citizen scientists who do not intuitively understand how to place the staff gauge in the app. Starr et al. (2014) reached a similar conclusion in a study that compared different training methods for plant identification and also focused on the beginner group to see the training effects clearly. While the CrowdWater app is reasonably intuitive, the fact that we do sometimes receive submissions with mistakes (Seibert et al., 2019a) suggests that training could be beneficial. The mistakes made when using the app, closely resemble the mistakes made by participants in this study and included making the staff gauge too big, not placing the zero line on the water level, or choosing a picture with an angle that distorts the image and hampers further observations at this location. Playing the CrowdWater game can help to avoid these mistakes in a playful manner for some of the participants (63 % of the participants who performed poorly prior to training did well after training). Based on these findings, we suggest that new citizen scientists play the CrowdWater game before setting up a new observation location.
Playing the CrowdWater game was not helpful for all participants; some participants who had a low placement score before the training had a low placement score after the training as well. Rinderer et al. (2015) reported a similar case, where some groups did improve their skills at classifying soil moisture, but others did not. In the context of this study, this might be due to the CrowdWater game being an implicit approach to training, instead of an explicit one. We did not provide theory about staff gauge placement nor mention the essential criteria of a good virtual staff gauge placement to participants (e.g. angle, size or placement on water level) during the study. Most participants intuitively understood this after playing the game because they noticed that a poor placement of the staff gauge made the estimation of the water level classes for subsequent observations more difficult. The benefit of such an implicit approach is that it is likely more fun than merely providing the theory (which is given on the CrowdWater website and explained in instruction videos). Nonetheless, some participants might have preferred explicit, written instructions on what to look for, instead of having to acquire this knowledge themselves. We, therefore, recommend that citizen science projects offer theoretical material in addition to a gamified training approach. Newman et al. (2010) encourage citizen science project leaders to provide many different training approaches to accommodate different learning styles. We do not know if the participants who benefited most from playing the game had previous experiences with citizen science, online games or smartphones. This could be investigated in a future study and would indicate who might require more training or for whom training via a game is most beneficial.
When rating the reference pictures, participants were better at recognizing unsuitable reference pictures compared to rather unsuitable, rather suitable or suitable pictures. The boundaries between the intermediate categories are of course vague and somewhat subjective, but it is very encouraging that participants could accurately identify unsuitable reference pictures, as this means that they are aware of what constitutes a poor placement and are therefore less likely to make these mistakes themselves. This is slightly contradictory to the results on the use of the report function during the game. While few participants reported pictures, those who did often overused this opportunity and reported more picture pairs than needed. In practice, it is tricky to decide where to set the limit between a suitable and unsuitable picture. For the majority of the reference pictures submitted via the CrowdWater app, the staff gauge placement is neither perfect nor useless. Although many staff gauges are not placed ideally, this does not necessarily mean that they are unusable. Depending on the location, it is often also not possible to place the virtual staff gauge perfectly.
There was no strong correlation between the game score and the improvement after the training. This could partly be due to the fact that learning occurs gradually during the game. Early in the game, participants might get few points and improve later during the game, leading to an average game score and a learning effect before finishing the training. The number of game rounds for optimal training is unknown, but the four rounds used here may be a good compromise between showing enough different pictures and not taking too much time. Strobl et al. (2019a) showed that, on average, players who played more than two rounds of the game (24 picture pairs) chose the right water level class more often than players who played fewer rounds. Players who played more than four rounds (48 picture pairs) were even more accurate.
5.2 Advantages and disadvantages of using an online citizen science game for training
The primary goal of the CrowdWater game is quality control of the crowdsourced data by the citizen scientists themselves. This method has proven successful in improving the quality of the water level class data (Strobl et al., 2019a). The idea to use the game also for training developed over time (see Sect. 2.3). By using an online game for this dual purpose (quality control and training), less effort from project administrators is needed compared to developing a separate online training module and quality control mechanism. Newman et al. (2010) developed multimedia tutorials for a species identification citizen science project and pointed out that they “found the development of multimedia tutorials difficult and time-consuming.” (Newman et al., 2010, p. 284).
The CrowdWater game goes beyond the separation of data quality control into “training before the task” and “checking after the task” (Freitag et al., 2016). Instead, training and checking are combined in a continuous loop, where new citizen scientists train and more experienced citizen scientists check the data with the same task. This, in turn, converts new citizen scientists into more experienced ones after only a few rounds of playing the game. This is similar to iSpot, where citizen scientists upload a picture of a species and identify the species, which is then checked online by other contributors (Silvertown et al., 2015). This leads to the new citizen scientists learning more about species, which will, in turn, make them better at helping other citizen scientists in the future. The approach by Bonter and Cooper (2012) for the FeederWatch project also combined data quality control with training by sending an automatic message to the contributor when a rare and possibly unlikely entry was submitted. They state that these “messages may function as training tools by encouraging participants to become more knowledgeable” (Bonter and Cooper, 2012, p. 306). However, the CrowdWater game is different from these projects in that it does not provide factual knowledge (e.g. on streams or hydrology).
The inclusion of new (and therefore inexperienced) citizen scientists in the quality control process did not negatively influence the quality of the data, mainly due to the averaging of votes of several players (Strobl et al., 2019a). Of course, this is only the case if there are enough experienced players, as well. In the project iSpot, the issue of including beginners in the validation process was solved through reputation scores, which need to be earned through correct species suggestions (Silvertown et al., 2015). This could also be a next step for the CrowdWater game, where an accuracy score can be calculated for each citizen scientist, which can then be used to weight the water level class votes in the game (Strobl et al., 2019a). However, the fact that four rounds of playing the game seem sufficient for training suggests that this is not necessary because new game players quickly turn into experienced ones.
If a citizen science project wants to develop a training task (as opposed to a quality control methodology that also works as a training task), slightly different approaches might be better. In our case, providing the essential criteria for placing a staff gauge in a suitable way (e.g. in between the picture pairs) might have been helpful. Similarly, feedback about the correct water level class could be given directly after each picture pair, rather than after each round of the game (as it is currently implemented). However, this would likely disturb the frequent players. Consequently, our primary goal is data quality control, and most game players are already aware of these criteria and do not want to be disrupted after every picture when they play the game. Therefore, we decided not to add this information to the game. However, additional material, such as tutorial videos, a manual including examples of good and bad staff gauge placements, and introductory app slides are available on the project website. However, our personal experience is that many citizen scientists do not look at this material before using the app and are often not aware of it. A potential benefit of the game, compared to the other material, is that citizen scientists are less likely to see it as “homework” but more as an entertaining activity and are, therefore, likely to spend more time with the game than they would do with other information materials. Encouragingly, participants of this study enjoyed playing the game, meaning that they would participate for the fun aspect instead of seeing it as a “learning task”. Consequently, the game can be recommended to any potential citizen scientist, without first having to assess their skills, i.e. their need for training. Additionally, we can recommend that new users play the game instead of discouraging them by explaining that their observations are incorrect.
Citizen science project tasks and therefore also training tasks should always be designed “with the skill of the citizens in mind” (Aceves-Bueno et al., 2017, p. 287). In this study, a similar number of participants rated the game as easy, neutral or difficult. This gives the impression that the difficulty of the game is at a reasonably good level, as it is meant to be engaging and exciting but at the same time not too challenging as to hinder participation. It should be noted that the participants in this study looked at 50 picture pairs in a row in order to simulate several rounds of the regular CrowdWater game, which only shows 12 picture pairs per day. The CrowdWater game itself is, therefore, likely even more accessible because it is less time consuming (and tiring) for citizen scientists.
In the future, it might be feasible to require participants to play the game before starting a new water level class measurement location, thus placing a virtual staff gauge in the CrowdWater app. This would be easily verifiable, as the app and game accounts are the same. In contrast, it is difficult to assess if citizen scientists have read through the introductory slides on the app or the training material that are offered online. Having a compulsory task before all features of the CrowdWater app are available might heighten the barrier to entry, which most citizen science projects that require many participants try to avoid. However, it could also be argued that participants who chose to complete a training session might be more committed towards a project and might, therefore, become more reliable long-term citizen scientists.
5.3 Does participants' self-assessment of confidence predict performance?
In general, participants were more confident in their performance and thought that the task was easier after the training. Self-assessment, however, seems to be an unreliable proxy for actual performance and should, therefore, be interpreted carefully. Participants with a low score for placing or rating the virtual staff gauges might not have realized what the essential criteria were (hence the low score) and therefore also did not realize that their staff gauge placement or rating of the reference pictures was not ideal. Self-assessment might improve after a while, once participants are more aware of which criteria to look for. Such a realization was seen by a CrowdWater app user, who commented that new observations were relatively difficult because the virtual staff gauge in the reference picture that he had created several months earlier was not placed ideally. This indicates that the sequence of activities in the CrowdWater project is not ideal, as volunteers have to start with the most difficult part, without having been confronted with different staff gauge placement options. It also suggests that after a while, citizen scientists learn what criteria to look out for and that training may be useful.
The predictability of performance based on self-assessment seems to vary for other studies. McDonough et al. (2017) found that the self-assessed species identification skills did not correspond to the skills of the citizen scientists. Starr et al. (2014) identified a group of citizen scientists who seemed too confident in their abilities but overall believed that the self-assessment was accurate for the majority of their citizen scientists. Crall et al. (2011) found that citizen scientists' skills increased with their self-assessed comfort level. Further research would be required to determine when self-assessment is a reliable prediction of performance. In the meantime, self-assessments should not be fully relied on nor used as a proxy for data quality.
5.4 Limitations of the study
The study was standardized by providing a number of pictures of the same stream to the participants to make the rating of their staff gauge placement comparable and independent of their ability to find a suitable stream. We included a wide range of stream pictures, including some unsuitable angles. The staff gauge placement was assessed for only one river, but it is encouraging to see that there was no difference in the performance of placing the staff gauge after the training online and outdoors, indicating that the online interface and the app were equally intuitive and that participants could also find suitable stream sections on their own. The training, therefore, seems to be teaching the necessary skills to the participants.
Participants could choose from the same 18 stream pictures before and after the training, which could potentially lead to a confirmation bias; i.e. participants might be more likely to choose the same picture after the training as they did before the training. We believe that this effect was negligible, as only two participants with a poor choice of the stream picture before the training still had a poor score after the training as well. All other participants either changed the picture or had already chosen a suitable picture before the training.
By singling out participants with poor performance before the training, the natural variation in performance might lead to improved performance after the training due to a regression towards the mean. However, the improvements were statistically significant when analysed for all participants as well. Further research should investigate how many rounds of the game would be optimal for training the average citizen scientist and if more rounds would lead to better performance for the participants who still received low scores after the training, i.e. if the optimal number of rounds should be adapted depending on the citizen scientist.
A disproportionately large number of study participants in the study had a university degree (85 %) due to the bias in the social network of the authors, recruitment at the university, a tendency of people being more interested in university studies if they have been to university themselves and the study being conducted in English. Many other citizen science projects also report higher participation of university-educated citizen scientists (Brossard et al., 2005; Crall et al., 2011; Overdevest et al., 2004), indicating that the participants of this study might not be that different from the actual citizen scientists in the CrowdWater project.
We investigated the value of an online game as a training tool for the CrowdWater project. This game was initially designed for data quality control but turned out to be valuable for improving the participants' ability to set up new observation locations as well. Our results are encouraging beyond the CrowdWater project, and we argue that the overall conclusions that (1) games can provide a suitable approach for training and (2) training and data quality control can be combined also apply to other citizen science projects. Based on our study, the following conclusions about games for training in citizen science projects can be made:
-
Citizen science projects should, if possible, be kept intuitive and easy, as this lowers the barrier to entry and might prevent misunderstandings. For the placement of the virtual staff gauge in the CrowdWater project, 70 % of the participants of this study already did well before receiving any training. This compares well with the approximately 10 % error rate for data submitted through the app (Seibert et al., 2019a).
-
Games facilitate the training of new citizen scientists and people who have already participated for a while. A big advantage is that this approach is scalable. Large projects with a lot of beginners are also likely to have a lot of advanced citizen scientists, and therefore the number of people who can be trained is not limited by the available time of the people managing the project.
-
Training through a game might not necessarily be perceived as training by the citizen scientists (in our case, the primary goal is data quality control). Potentially this helps to make the training feel less like homework before starting to collect data. Nearly two thirds of the participants of this training study said that the game was fun; this compares well with a survey among early game players of whom 86 % said that they enjoyed playing the game (Strobl et al., 2019a).
-
While materials such as manuals and tutorials can be useful, gamified approaches provide an enjoyable alternative training mechanism for citizen scientists. Citizen scientists might respond differently to various training techniques. In our case, we noticed that few citizen scientists read the manual or watched the instruction videos but also that some individuals might have responded better to a more explicit and less playful training method. We, therefore, recommend offering different training options.
All data files are available from the Zenodo data repository (https://doi.org/10.5281/zenodo.3538008; Strobl et al., 2019b).
The supplement related to this article is available online at: https://doi.org/10.5194/gc-3-109-2020-supplement.
BS conceptualized the project, curated the data, performed the formal analysis, led the investigation, planned the methodology, administered the project, procured the resources, visualized the data and wrote the original draft of this paper. SE conceptualized the project, planned the methodology, and reviewed and edited the paper. HJIvM conceptualized the project, acquired funding, planned the methodology, supervised the project, and reviewed and edited the paper. JS conceptualized the project, acquired funding, planned the methodology, supervised the project, and reviewed and edited the paper.
The authors declare that they have no conflict of interest.
We thank all 52 study participants for their time and interest in this study. We also thank all CrowdWater app and CrowdWater game contributors for providing the database that was used in this study and for submitting valuable hydrological data. We hope that the participants will continue to participate in the CrowdWater project by using the app or playing the game and invite all readers to use the app and/or play the game as well.
This research has been supported by the Swiss National Science Foundation (grant no. 200021_163008).
This paper was edited by Chris King and reviewed by two anonymous referees.
Aceves-Bueno, E., Adeleye, A. S., Feraud, M., Huang, Y., Tao, M., Yang, Y., and Anderson, S. E.: The Accuracy of Citizen Science Data: A Quantitative Review, Bull. Ecol. Soc. Am., 98, 278–290, https://doi.org/10.1002/bes2.1336, 2017.
Barras, H., Hering, A., Martynov, A., Noti, P.-A., Germann, U., and Martius, O.: Experiences with > 50'000 crowd-sourced hail reports in Switzerland, Am. Meteorol. Soc., 100, 1429–1440, https://doi.org/10.1175/bams-d-18-0090.1, 2019.
Bonney, R., Ballard, H., Jordan, R., McCallie, E., Phillips, T., Shirk, J. and Wilderman, C. C.: Public Participation in Scientific Research: Defining the Field and Assessing Its Potential for Informal Science Education, Washington, DC, available at: https://files.eric.ed.gov/fulltext/ED519688.pdf (last access: 30 April 2020), 2009.
Bonney, R., Phillips, T. B., Ballard, H. L., and Enck, J. W.: Can citizen science enhance public understanding of science?, Public Underst. Sci., 25, 2–16, https://doi.org/10.1177/0963662515607406, 2016.
Bonter, D. N. and Cooper, C. B.: Data validation in citizen science: A case study from Project FeederWatch, Front. Ecol. Environ., 10, 305–307, https://doi.org/10.1890/110273, 2012.
Breuer, L., Hiery, N., Kraft, P., Bach, M., Aubert, A. H., and Frede, H.-G.: HydroCrowd: a citizen science snapshot to assess the spatial control of nitrogen solutes in surface waters, Sci. Rep., 5, 16503, https://doi.org/10.1038/srep16503, 2015.
Brossard, D., Lewenstein, B., and Bonney, R.: Scientific knowledge and attitude change: The impact of a citizen science project, Int. J. Sci. Educ., 27, 1099–1121, https://doi.org/10.1080/09500690500069483, 2005.
Canfield, D. E., Bachmann, R. W., Stephens, D. B., Hoyer, M. V., Bacon, L., Williams, S., and Scott, M.: Monitoring by citizen scientists demonstrates water clarity of Maine (USA) lakes is stable, not declining, due to cultural eutrophication, Inl. Waters, 6, 11–27, https://doi.org/10.5268/IW-6.1.864, 2016.
Crall, A. W., Newman, G. J., Stohlgren, T. J., Holfelder, K. A., Graham, J., and Waller, D. M.: Assessing citizen science data quality: An invasive species case study, Conserv. Lett., 4, 433–442, https://doi.org/10.1111/j.1755-263X.2011.00196.x, 2011.
Crall, A. W., Jordan, R., Holfelder, K., Newman, G. J., Graham, J., and Waller, D. M.: The impacts of an invasive species citizen science training program on participant attitudes, behavior, and science literacy, Public Underst. Sci., 22, 745–764, https://doi.org/10.1177/0963662511434894, 2013.
Cronje, R., Rohlinger, S., Crall, A., and Newman, G.: Does Participation in Citizen Science Improve Scientific Literacy? A Study to Compare Assessment Methods, Appl. Environ. Educ. Commun., 10, 135–145, https://doi.org/10.1080/1533015X.2011.603611, 2011.
Dem, E. S., Rodríguez-Labajos, B., Wiemers, M., Ott, J., Hirneisen, N., Bustamante, J. V., Bustamante, M., and Settele, J.: Understanding the relationship between volunteers' motivations and learning outcomes of Citizen Science in rice ecosystems in the Northern Philippines, Paddy Water Environ., 16, 725–735, https://doi.org/10.1007/s10333-018-0664-9, 2018.
Etter, S., Strobl, B., Seibert, J., and van Meerveld, I.: Value of uncertain streamflow observations for hydrological modelling, Hydrol. Earth Syst. Sci., 22, 5243–5257, https://doi.org/10.5194/hess-22-5243-2018, 2018.
Evans, C., Abrams, E., Reitsma, R., Roux, K., Salmonsen, L., and Marra, P. P.: The Neighborhood Nestwatch Program: Participant Outcomes of a Citizen-Science Ecological Research Project, Conserv. Biol., 19, 589–594, https://doi.org/10.1111/j.1523-1739.2005.00s01.x, 2005.
Freitag, A., Meyer, R., and Whiteman, L.: Strategies Employed by Citizen Science Programs to Increase the Credibility of Their Data, Citiz. Sci. Theory Pract., 1, 1–11, https://doi.org/10.5334/cstp.6, 2016.
Gaddis, M.: Training Citizen Scientists for Data Reliability: a Multiple Case Study to Identify Themes in Current Training Initiatives, University of the Rockies, 2018.
Goodchild, M. F.: Citizens as sensors: The world of volunteered geography, GeoJ., 69, 211–221, https://doi.org/10.1007/s10708-007-9111-y, 2007.
Jennett, C., Kloetzer, L., Schneider, D., Iacovides, I., Cox, A. L., Gold, M., Fuchs, B., Eveleigh, A., Mathieu, K., Ajani, Z., and Talsi, Y.: Motivations, learning and creativity in online citizen science, J. Sci. Commun., 15, 1–23, 2016.
Jordan, R. C., Gray, S. A., Howe, D. V., Brooks, W. R., and Ehrenfeld, J. G.: Knowledge Gain and Behavioral Change in Citizen-Science Programs, Conserv. Biol., 25, 1148–1154, https://doi.org/10.1111/j.1523-1739.2011.01745.x, 2011.
Kampf, S., Strobl, B., Hammond, J., Annenberg, A., Etter, S., Martin, C., Puntenney-Desmond, K., Seibert, J., and van Meerveld, I.: Testing the waters: Mobile apps for crowdsourced streamflow data, Eos (Washington, DC), 30–34, https://doi.org/10.1029/2018EO096355, 2018.
Kremen, C., Ullman, K. S., and Thorp, R. W.: Evaluating the Quality of Citizen-Scientist Data on Pollinator Communities, Conserv. Biol., 25, 607–617, https://doi.org/10.1111/j.1523-1739.2011.01657.x, 2011.
Krennert, T., Kaltenberger, R., Pistotnik, G., Holzer, A. M., Zeiler, F., and Stampfl, M.: Trusted Spotter Network Austria – a new standard to utilize crowdsourced weather and impact observations, Adv. Sci. Res., 15, 77–80, https://doi.org/10.5194/asr-15-77-2018, 2018.
Lintott, C. J., Schawinski, K., Slosar, A., Land, K., Bamford, S., Thomas, D., Raddick, M. J., Nichol, R. C., Szalay, A., Andreescu, D., Murray, P., and Vandenberg, J.: Galaxy Zoo: Morphologies derived from visual inspection of galaxies from the Sloan Digital Sky Survey, Mon. Not. R. Astron. Soc., 389, 1179–1189, https://doi.org/10.1111/j.1365-2966.2008.13689.x, 2008.
Little, K. E., Hayashi, M., and Liang, S.: Community-Based Groundwater Monitoring Network Using a Citizen-Science Approach, Groundwater, 54, 317–324, https://doi.org/10.1111/gwat.12336, 2016.
Lowry, C. S., Fienen, M. N., Hall, D. M., and Stepenuck, K. F.: Growing Pains of Crowdsourced Stream Stage Monitoring Using Mobile Phones: The Development of CrowdHydrology, Front. Earth Sci., 7, 1–10, https://doi.org/10.3389/feart.2019.00128, 2019.
Mavandadi, S., Dimitrov, S., Feng, S., Yu, F., Sikora, U., Yaglidere, O., Padmanabhan, S., Nielsen, K., and Ozcan, A.: Distributed medical image analysis and diagnosis through crowd-sourced games: A malaria case study, PLoS One, 7, 1–8, https://doi.org/10.1371/journal.pone.0037245, 2012.
McDonough MacKenzie, C., Murray, G., Primack, R., and Weihrauch, D.: Lessons from citizen science: Assessing volunteer-collected plant phenology data with Mountain Watch, Biol. Conserv., 208, 121–126, https://doi.org/10.1016/j.biocon.2016.07.027, 2017.
Newman, G., Crall, A., Laituri, M., Graham, J., Stohlgren, T., Moore, J. C., Kodrich, K., and Holfelder, K. A.: Teaching citizen science skills online: Implications for invasive species training programs, Appl. Environ. Educ. Commun., 9, 276–286, https://doi.org/10.1080/1533015X.2010.530896, 2010.
Overdevest, C., Orr, C. H., and Stepenuck, K.: Volunteer Stream Monitoring and Local Participation in Natural Resource Issues, Hum. Ecol. Rev., 11, 177–185, 2004.
Phillips, T. B., Ballard, H. L., Lewenstein, B. V., and Bonney, R.: Engagement in science through citizen science: Moving beyond data collection, Sci. Educ., 103, 665–690, https://doi.org/10.1002/sce.21501, 2019.
Pimm, S. L., Jenkins, C. N., Abell, R., Brooks, T. M., Gittleman, J. L., Joppa, L. N., Raven, P. H., Roberts, C. M., and Sexton, J. O.: The biodiversity of species and their rates of extinction, distribution, and protection, Science, 344, 6187, https://doi.org/10.1126/science.1246752, 2014.
Reges, H. W., Doesken, N., Turner, J., Newman, N., Bergantino, A., and Schwalbe, Z.: CoCoRaHS: The Evolution and Accomplishments of a Volunteer Rain Gauge Network, Am. Meteorol. Soc., 97, 1831–1846, https://doi.org/10.1175/BAMS-D-14-00213.1, 2016.
Rinderer, M., Komakech, H. C., Müller, D., Wiesenberg, G. L. B., and Seibert, J.: Qualitative soil moisture assessment in semi-arid Africa – the role of experience and training on inter-rater reliability, Hydrol. Earth Syst. Sci., 19, 3505–3516, https://doi.org/10.5194/hess-19-3505-2015, 2015.
Rufino, M. C., Weeser, B., Stenfert-Kroese, J., Njue, N., Gräf, J., Jacobs, S., Kemboi, Z., Ran, A. M., Cerutti, P. O., Martius, C., and Breuer, L.: Citizen scientists monitor water quantity and quality in Kenya, CIFOR infobriefs, 230, 1–4, https://doi.org/10.17528/cifor/007013, 2018.
Seibert, J., Strobl, B., Etter, S., Hummer, P., and van Meerveld, H. J.: Virtual Staff Gauges for Crowd-Based Stream Level Observations, Front. Earth Sci., 7, 70, https://doi.org/10.3389/feart.2019.00070, 2019a.
Seibert, J., van Meerveld, H. J., Etter, S., Strobl, B., Assendelft, R., and Hummer, P.: Wasserdaten sammeln mit dem Smartphone – Wie können Menschen messen, was hydrologische Modelle brauchen?, Hydrol. Wasserbewirts., 63, 74–84, https://doi.org/10.5675/HyWa_2019.2_1, 2019b.
Silvertown, J., Harvey, M., Greenwood, R., Dodd, M., Rosewell, J., Rebelo, T., Ansine, J., and McConway, K.: Crowdsourcing the identification of organisms: A case-study of iSpot, Zookeys, 480, 125–146, https://doi.org/10.3897/zookeys.480.8803, 2015.
Starr, J., Schweik, C. M., Bush, N., Fletcher, L., Finn, J., Fish, J., and Bargeron, C. T.: Lights, Camera-Citizen Science: Assessing the Effectiveness of Smartphone-Based Video Training in Invasive Plant Identification, PLoS One, 9, 1–7, https://doi.org/10.1371/journal.pone.0111433, 2014.
Strobl, B., Etter, S., van Meerveld, I., and Seibert, J.: The CrowdWater game: A playful way to improve the accuracy of crowdsourced water level class data, edited by: Mirjalili, S., PLoS One, 14, e0222579, https://doi.org/10.1371/journal.pone.0222579, 2019a.
Strobl, B., Etter, S., van Meerveld, I. H. J., and Seibert, J.: CrowdWater game training study, Zenodo, https://doi.org/10.5281/zenodo.3538008, 2019b.
van Meerveld, H. J., Vis, M. J. P., and Seibert, J.: Information content of stream level class data for hydrological model calibration, Hydrol. Earth Syst. Sci., 21, 4895–4905, https://doi.org/10.5194/hess-21-4895-2017, 2017.
Weeser, B., Stenfert Kroese, J., Jacobs, S. R., Njue, N., Kemboi, Z., Ran, A., Rufino, M. C., and Breuer, L.: Citizen science pioneers in Kenya – A crowdsourced approach for hydrological monitoring, Sci. Total Environ., 631/632, 1590–1599, https://doi.org/10.1016/j.scitotenv.2018.03.130, 2018.