the Creative Commons Attribution 4.0 License.
the Creative Commons Attribution 4.0 License.
 | 17 Jul 2025
GC Insights: Breaking the silos – leveraging natural language processing (NLP) to encourage interdisciplinary interaction at the European Geosciences Union (EGU)
Jan Sodoge
Taís Maria Nunes Carvalho
Mariana Madruga de Brito
Thousands of abstracts from various geoscience sub-fields are presented annually at the European Geosciences Union (EGU) General Assembly (GA), offering a rich resource for tracking scientific progress. However, rigid session groupings can limit cross-disciplinary exploration. Here, we show that participants focusing only on their broad disciplinary divisions miss an average of 44 % of the 10 most relevant contributions. To break this compartmentalization, we propose using natural language processing (NLP), enabling the geoscience community to explore the full breadth of knowledge beyond traditional disciplinary boundaries.
- Article
(1135 KB) - Full-text XML
-
Supplement
(1552 KB) - BibTeX
- EndNote


Each year, the European Geosciences Union (EGU) General Assembly (GA) gathers over 20 000 geoscientists worldwide, with participation steadily increasing since its inception in 2004 (EGU, 2024). To organize this vast array of research, abstracts are categorized into 22 disciplinary programme groups (PGs), alongside interdisciplinary and transdisciplinary sessions (ITSs), education and outreach sessions (EOSs), and other union-wide sessions. We hypothesize that this structure may inadvertently create knowledge silos, as EGU GA attendees might tend to focus on their own scientific programme groups – also referred to as divisions1 – potentially missing relevant developments from other disciplines. As a result, they may only be exposed to ideas within their peer group, thereby reinforcing existing perspectives. This phenomenon mirrors the well-documented effects of filter bubbles and selective exposure to information observed on social media platforms (Robertson et al., 2023; Spohr, 2017). In scientific settings, such bubbles can hinder interaction between fields that could catalyse creativity and innovation (Kittur et al., 2019; Burt, 2004). While the idea of bursting such potential bubbles is thought to foster research progress (Portenoy et al., 2022), this phenomenon remains underexplored in the context of large scientific conferences such as the EGU GA.
Recent advancements in natural language processing (NLP) offer a promising solution to address this compartmentalization. Language models can extract structured insights from vast amounts of scientific documents, thereby revealing knowledge that would otherwise remain hidden within the sheer volume of scientific output (Yau et al., 2014; De Battisti et al., 2015; Chen et al., 2019; Sodoge and de Brito, 2024). For example, language models have been used successfully to map climate-change-related publications (Callaghan et al., 2020), moving towards understanding the meaning and context of language.
In this work, we investigate how the compartmentalization at the EGU GA programme may generate filter bubbles. We then demonstrate how NLP can be used to organize knowledge from EGU GA abstracts beyond traditional disciplines, benefitting conference participants, organizers, and the broader geoscience community. Using the abstracts from the EGU GAs (2020–2024), we create a textual cartography of the geoscience landscape, aiming to (1) provide an overview of geoscience research presented at the EGU GAs, (2) guide participants to relevant research across disciplinary boundaries, and (3) assist in organizing conference sessions.
Our approach consists of five steps, i.e. (1) collecting abstracts from the EGU, (2) computing similarities between abstracts, (3) visualizing the abstracts in a two-dimensional space, (4) running a simulation to estimate the hypothesized filter effect, and (5) comparing the coherence of divisions created through clustering to the existing division structures (see Fig. S1 in the Supplement).
To demonstrate our approach, we collected abstracts from the past five EGU GAs. For each GA, we scraped the abstracts and the corresponding divisions. After removing withdrawn abstracts, the dataset comprised 77 911 contributions across 22 disciplinary divisions (2020: 17 728, 2021: 13 368, 2022: 12 129, 2023: 15 772, and 2024: 18 914) and 3663 abstracts from the ITSs. We have not considered the ITS abstracts to be a single division, as (1) their content and number of sessions may vary significantly across the years (making it difficult to analyse trends consistently) and (2) they represent a small fraction of the total number of submissions (around 0.5 % of all abstracts). Instead, we reassigned the ITS abstracts to their co-organizing divisions (e.g. ITS and Natural Hazards – NH) to account for their disciplinary inter-linkages.
We then used a pre-trained language model to generate a text embedding for each abstract. An embedding is a high-dimensional vector of numerical values representing the text's semantic meaning. This reveals relationships between abstracts as texts with similar content have similar embeddings. The pre-trained model requires no additional pre-processing (e.g. stop-word removal) as it is designed to ignore irrelevant parts and focus on meaningful patterns in the text. Specifically, we employed the distilroberta-base language model (Liu, 2019), which was trained on large text corpora, enabling it to capture text structure, meanings, and context. This model was selected for its ability to capture the entire abstract and robust performance across diverse language tasks (Naseer et al., 2021; Briskilal and Subalalitha, 2022).
In order to visualize the text embeddings and create a textual cartography of geoscience research, we applied the U-MAP (uniform manifold approximation and projection) dimensionality reduction method (McInnes et al., 2018). This technique projects the high-dimensional text embeddings onto a two-dimensional space while preserving the local and global structure of the data. The result is a map where similar abstracts are positioned closer and distinct content farther apart.
To investigate the hypothesized filter bubble effect, we conducted a simulation by randomly selecting 5000 abstracts from each EGU GA. For each abstract, we identified the 10 most similar abstracts presented in the same year using cosine similarity (Kenter and De Rijke, 2015). We then analysed the disciplinary divisions associated with these similar abstracts to calculate the proportion that belonged in the same versus different divisions. A higher proportion of similar abstracts from different divisions suggests that EGU GA participants may miss out on potentially relevant contributions by focusing exclusively on their own division.
Finally, to evaluate how well the EGU GA abstracts were grouped, we compared the clustering quality when using the disciplinary divisions and when using the k-means clustering algorithm (Rodriguez et al., 2019), considering the same number of clusters as the number of disciplinary sessions (n=22). The average silhouette coefficient (Dinh et al., 2019) was used to assess cluster coherence, where values close to 1 indicate well-separated clusters and negative values indicate no coherent cluster structures. This comparison allowed us to assess which method clusters more effectively those abstracts that address similar topics.
Figure 1a shows the research landscape of the EGU GA from 2020 to 2024, featuring a total of 77 911 abstracts. Each abstract is coloured by its respective disciplinary division, highlighting the relationships between them. For example, abstracts from the NH and Climate (CL) divisions are spread across different clusters. A qualitative inspection of this map reveals not only such macro-level structures but also the similarities and differences on a more fine-grained level. For instance, the contributions most similar to a research abstract on modelling farmers' irrigation preferences (Heilemann et al., 2024) include an abstract evaluating irrigation demand in the same case-study area (Fallah-Mehdipour and Dietrich, 2024) and an abstract on the modelling of global irrigation water demand (Beier et al., 2024). These were presented in different divisions and thus would potentially be missed if an attendee only consulted one division and the sessions were not co-organized.
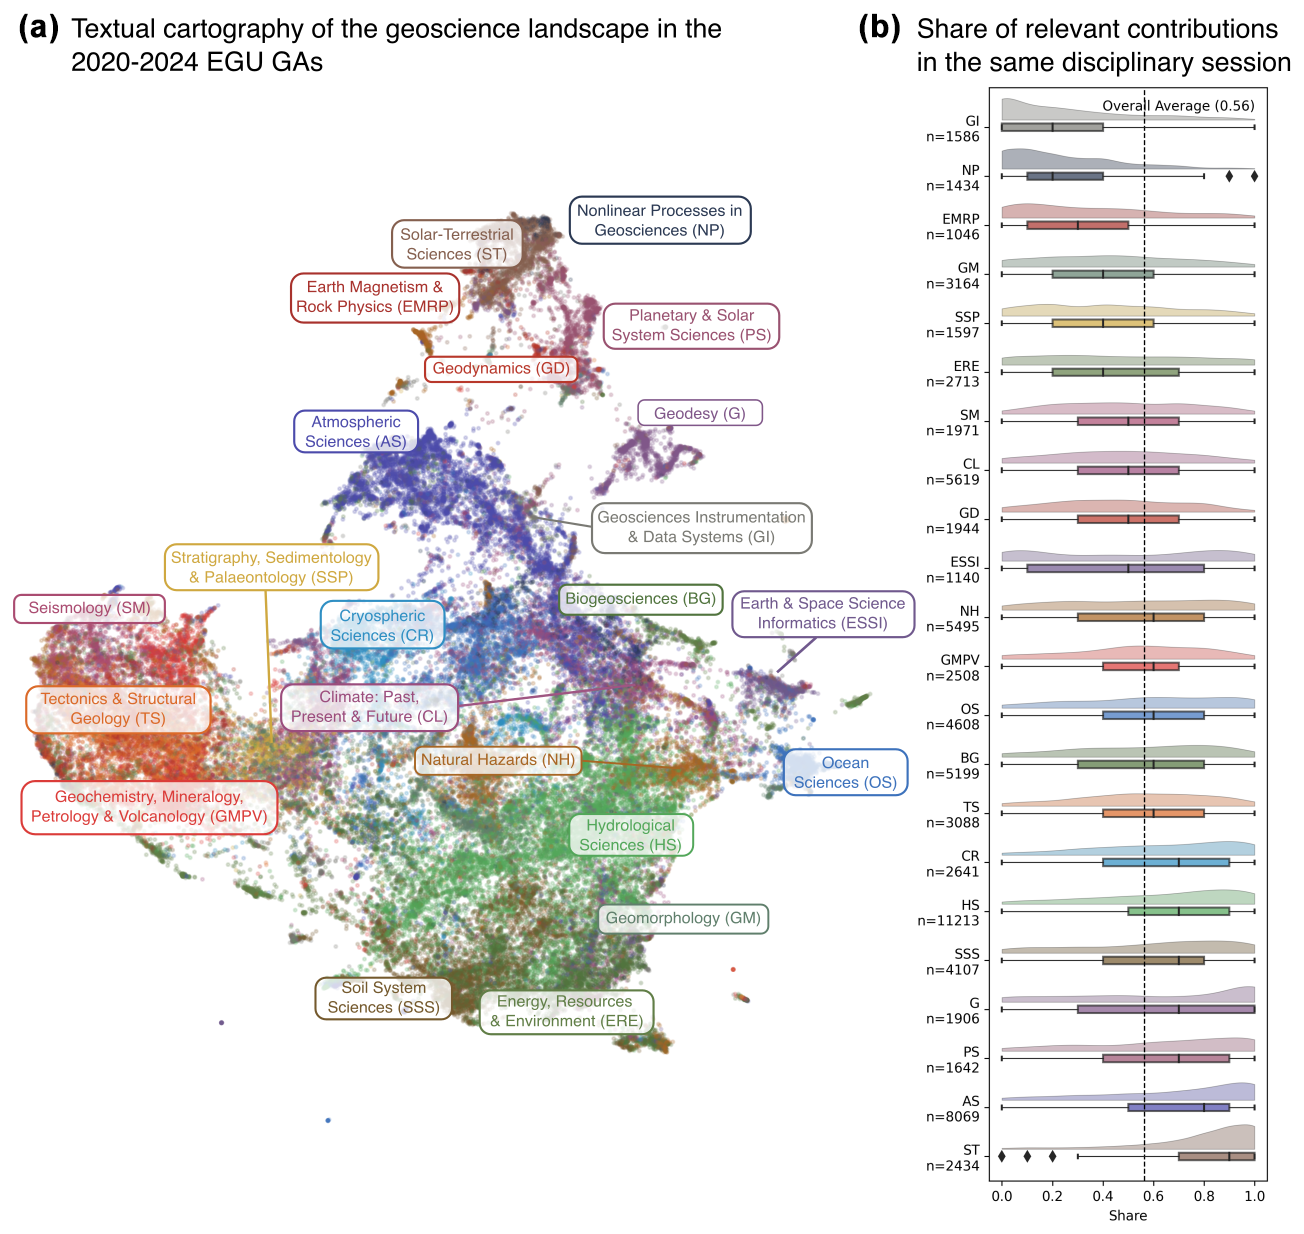
Figure 1(a) Textual cartography of 77 911 abstracts from the EGU GAs from 2020 to 2024. Each dot represents an abstract, where a shorter distance between dots indicates a greater similarity in content. (b) Assessment of the potential filter bubble effect due to the divisions' compartmentalization. Each observation represents a randomly selected abstract. Its value indicates the proportion of the 10 most similar abstracts in the same division as the selected abstract. Higher values suggest a greater tendency for relevant abstracts to be concentrated within the same division. n denotes the total number of abstracts in each session between 2020 and 2024.
Our findings confirmed the presence of a filter bubble effect, with varying degrees across the EGU GA divisions. On average, participants who restrict their attention to abstracts within their own division potentially miss 44 % of the 10 abstracts most similar to their own abstract. This percentage varies depending on the division considered. Divisions that are rather separated, such as Atmospheric Sciences (AS) and Solar-Terrestrial Sciences (ST), have a lower likelihood of attendees missing relevant contributions (Fig. 1b). Conversely, divisions with contributions spread widely across different topics, such as Geosciences Instrumentation & Data Systems (GI) and Nonlinear Processes in Geosciences (NP), reduce the share of relevant contributions covered by their own division. We only found a weak correlation (Spearman's ρ = 0.38) between the number of abstracts of each division and the previously discussed share of relevant presentations. This suggests that the impact of the size of a division on a potential filter bubble effect is limited and unlikely to greatly influence our findings.
Adding the abstracts from the ITSs to their co-organizing divisions significantly increased the number of missed relevant contributions in the divisions of AS, CR, BG, HS, and SSS. This may be due to the lower thematic coherence of the ITS abstracts, which makes their text less likely to align with that of the disciplinary divisions that co-organize the ITS. However, these findings underscore the value of the ITSs themselves: the described lower thematic coherence is important for bringing together contributions from diverse fields, facilitating cross-disciplinary exchange.
When comparing different ways of organizing the abstracts, we found that grouping them by disciplinary divisions yields an average silhouette coefficient of −0.17. In contrast, applying the k-means clustering algorithm results in an average silhouette coefficient of 0.39. This suggests that using a statistical clustering approach to group abstracts produces more coherent clusters than the divisions.
Abstracts presented at the EGU GA every year provide a snapshot of current geoscientific research. However, the increasing number of conference abstracts, over 18 000 in 2024, makes it challenging for participants and organizers to keep track of relevant contributions. By creating a textual cartography of more than 77 000 abstracts presented at the last five GAs, here we show how NLP can help capture the broad range of subjects discussed at the EGU GA and identify relevant contributions outside of the field or discipline that the participant identifies with.
Our results indicate the presence of a bubble effect, where EGU GA attendees may miss contributions addressing similar problems from a different perspective presented outside their own division. This effect is evident, particularly for abstracts submitted to NP and GI sessions. As a result, participants who restrict their participation to their own divisions may only be exposed to content they are familiar with, due to the restrictive nature of session compartmentalization.
To tackle this, we propose an online application designed to recommend EGU GA participants' other contributions, independent of the divisions to which they were submitted. Using interactive visualizations such as the map in Fig. 1a, EGU GA participants can identify relevant research contributions beyond their immediate field (e.g. addressing the same problem but using different methods or the same method for different problems). This tool aims to facilitate interdisciplinary exploration by bringing to the surface relevant contributions that attendees might not discover if they restrict their participation to a particular session or division. This can foster interdisciplinary connections, leading to innovative work and higher productivity (Portenoy et al., 2022; Specht and Crowston, 2022). During the EGU GA 2024, we tested a prototype of such an application (Fig. S2) and received positive feedback on the relevance of the suggested talks.
In our analysis of filter bubbles, we recognize that the assumption that GA attendees only attend sessions in their own division is an oversimplification. In reality, participants engage with ITSs and neighbouring divisions. However, due to the large volume of abstracts and sessions per division (for example, in 2024, the median number of abstracts per disciplinary division was 638, with a maximum of 2681), manually identifying all relevant contributions across divisions is unfeasible. Another key limitation is that our scraped dataset includes only co-organizing groups, not the primary organizers, which may affect the results, particularly for ITSs, where the roles of each division vary.
Looking ahead, we plan to conduct a more in-depth comparison of models and consider fine-tuning of existing approaches to improve accuracy. Also, to address these limitations, we are currently conducting a survey to more explicitly measure attendee behaviour and evaluate the assumptions underlying our analysis by incorporating user feedback. This will allow us to assess whether the suggested contributions are perceived as meaningful by EGU GA attendees.
We showed that clustering the abstracts from the EGU GA using k-means, compared to relying on disciplinary divisions, achieved a better clustering, i.e. semantically more coherent sessions. While these results are provocative, our intent is not to suggest replacing divisions or other formal groupings. Large conferences, such as the EGU GA, require these organizational structures to coordinate and design a coherent programme. We also recognize the role of authors in selecting the most appropriate session, which is often influenced by community ties. Hence, the computational approach suggested here is seen more as a tool in a co-design process, helping organizers and participants make more informed decisions when faced with a vast amount of information. In fact, the authors of this study are collaborating with the EGU Programme Committee and the Copernicus Conference Manager to experiment with additional tools that can be integrated into the conference system and enhance the attendee experience.
Beyond the application provided here, the developed textual cartography opens multiple new avenues for studying geoscientific research. Our results suggest new possibilities for assessing trends across different geoscience sub-fields over time, identifying emerging research areas, and tracking shifts in scientific focus that might otherwise go unnoticed. By “bursting bubbles” that isolate information, our method and online application reveal the interconnectedness of geoscience research, supporting collaboration beyond traditional boundaries.
The code and data for computing the embedding, comparing the similarity, and creating the figures for this publication are documented in https://git.ufz.de/sodoge/egu-abstract-embeddings (Sodoge, 2025).
An interactive visualization of the data is available at https://taiscarvalho.github.io/egu-umap-viz/ (Carvalho, 2025).
The supplement related to this article is available online at https://doi.org/10.5194/gc-8-191-2025-supplement.
JS: conceptualization, methodology, investigation, data curation, formal analysis, writing (original draft preparation, review, and editing), project administration, visualization. TNC: conceptualization, methodology, visualization, data curation. MMdB: conceptualization, writing (original draft preparation, review, and editing).
The contact author has declared that none of the authors has any competing interests.
Publisher’s note: Copernicus Publications remains neutral with regard to jurisdictional claims made in the text, published maps, institutional affiliations, or any other geographical representation in this paper. While Copernicus Publications makes every effort to include appropriate place names, the final responsibility lies with the authors.
The authors would like to thank Maria-Helena Ramos, Ira Didenkulova, Martin Rasmussen, and the European Geosciences Union for their support.
This paper was edited by Steven Rogers and reviewed by Lina Stein and Kirsten v. Elverfeldt.
Beier, F., Heinke, J., Bodirsky, B. L., Müller, C., Ostberg, S., Karstens, K., Abrahao, G., Popp, A., and Lotze-Campen, H.: Multiple cropping in global-scale Land-Use Models and the role of Irrigation, EGU General Assembly 2024, Vienna, Austria, 14–19 Apr 2024, EGU24-18994, https://doi.org/10.5194/egusphere-egu24-18994, 2024. a
Briskilal, J. and Subalalitha, C.: An ensemble model for classifying idioms and literal texts using BERT and RoBERTa, Information Processing & Management, 59, 102756, https://doi.org/10.1016/j.ipm.2021.102756, 2022. a
Burt, R. S.: Structural holes and good ideas, Am. J. Soc., 110, 349–399, https://doi.org/10.1086/421787, 2004. a
Callaghan, M. W., Minx, J. C., and Forster, P. M.: A topography of climate change research, Nat. Clim. Change, 10, 118–123, https://doi.org/10.1038/s41558-019-0684-5, 2020. a
Carvalho, T. M. N.: UMAP Projections of EGU Embeddings, GitHub [data set], https://taiscarvalho.github.io/egu-umap-viz/, last access: 15 July 2025.
Chen, H., Wang, X., Pan, S., and Xiong, F.: Identify topic relations in scientific literature using topic modeling, IEEE T. Eng. Manage., 68, 1232–1244, https://doi.org/10.1109/TEM.2019.2903115, 2019. a
De Battisti, F., Ferrara, A., and Salini, S.: A decade of research in statistics: A topic model approach, Scientometrics, 103, 413–433, https://doi.org/10.1007/s11192-015-1554-1, 2015. a
Dinh, D.-T., Fujinami, T., and Huynh, V.-N.: Estimating the optimal number of clusters in categorical data clustering by silhouette coefficient, in: Knowledge and Systems Sciences: 20th International Symposium, KSS 2019, Da Nang, Vietnam, 29 November–1 December 2019, Proceedings 20, 1–17, Springer, https://doi.org/10.1007/978-981-15-1209-4_1, 2019. a
EGU: List of General Assemblies, EGU, https://www.egu.eu/meetings/general-assembly/meetings/ (last access: 1 February 2025), 2024. a
Fallah-Mehdipour, E. and Dietrich, J.: Evaluating irrigation demand forecasts from S2S/agro-hydrological modelling with field experiments in Northern Germany in the context of farmer decision support, EGU General Assembly 2024, Vienna, Austria, 14–19 Apr 2024, EGU24-12705, https://doi.org/10.5194/egusphere-egu24-12705, 2024. a
Heilemann, J., Nagpal, M., Werner, S., Klassert, C., Klauer, B., and Gawel, E.: More Droughts, More Irrigation? Modeling the Adaptive Behavior of German Farmers to Hydrometeorological and Socioeconomic Change, EGU General Assembly 2024, Vienna, Austria, 14–19 Apr 2024, EGU24-11342, https://doi.org/10.5194/egusphere-egu24-11342, 2024. a
Kenter, T. and De Rijke, M.: Short text similarity with word embeddings, in: Proceedings of the 24th ACM international on conference on information and knowledge management, Institute of Eletrical and Electronics Engineers, 1411–1420, https://doi.org/10.1145/2806416.2806475, 2015. a
Kittur, A., Yu, L., Hope, T., Chan, J., Lifshitz-Assaf, H., Gilon, K., Ng, F., Kraut, R. E., and Shahaf, D.: Scaling up analogical innovation with crowds and AI, P. Natl. Acad. Sci., 116, 1870–1877, https://doi.org/10.1073/pnas.1807185116, 2019. a
Liu, Y.: Roberta: A robustly optimized bert pretraining approach, arXiv [preprint], https://doi.org/10.48550/arXiv.1907.11692, 2019. a
McInnes, L., Healy, J., and Melville, J.: Umap: Uniform manifold approximation and projection for dimension reduction, arXiv [preprint], https://doi.org/10.48550/arXiv.1802.03426, 2018. a
Naseer, M., Asvial, M., and Sari, R. F.: An empirical comparison of bert, roberta, and electra for fact verification, in: 2021 International Conference on Artificial Intelligence in Information and Communication (ICAIIC), 241–246, IEEE, https://doi.org/10.1109/ICAIIC51459.2021.9415192, 2021. a
Portenoy, J., Radensky, M., West, J. D., Horvitz, E., Weld, D. S., and Hope, T.: Bursting scientific filter bubbles: Boosting innovation via novel author discovery, in: Proceedings of the 2022 CHI Conference on Human Factors in Computing Systems, edited by: Barbosa, S., Lampe, C., Appert, C., Shamma, D. A., Drucker, S., Williamson, J., and Yatani, K., 1–13, https://doi.org/10.1145/3491102.3501905, 2022. a, b
Robertson, R. E., Green, J., Ruck, D. J., Ognyanova, K., Wilson, C., and Lazer, D.: Users choose to engage with more partisan news than they are exposed to on Google Search, Nature, 618, 342–348, https://doi.org/10.1038/s41586-023-06078-5, 2023. a
Rodriguez, M. Z., Comin, C. H., Casanova, D., Bruno, O. M., Amancio, D. R., Costa, L. d. F., and Rodrigues, F. A.: Clustering algorithms: A comparative approach, PLOS ONE, 14, e0210236, https://doi.org/10.1371/journal.pone.0210236, 2019. a
Sodoge, J.: EGU Abstract Embeddings, UFZ [code and data set], https://git.ufz.de/sodoge/egu-abstract-embeddings, last access: 15 July 2025.
Sodoge, J. and de Brito, M. M.: Computational Social Sciences in Human–Water Research, in: Elgar Encyclopedia of Water Policy, Economics and Management, edited by: Koundouri, P. and Alamanos, A., 50–52, Edward Elgar Publishing, https://doi.org/10.4337/9781802202946.00018, 2024. a
Specht, A. and Crowston, K.: Interdisciplinary collaboration from diverse science teams can produce significant outcomes, PLoS One, 17, e0278043, https://doi.org/10.1371/journal.pone.0278043, 2022. a
Spohr, D.: Fake news and ideological polarization: Filter bubbles and selective exposure on social media, Business Information Review, 34, 150–160, https://doi.org/10.1177/0266382117722446, 2017. a
Yau, C.-K., Porter, A., Newman, N., and Suominen, A.: Clustering scientific documents with topic modeling, Scientometrics, 100, 767–786, https://doi.org/10.1007/s11192-014-1321-8, 2014. a
We use the term “divisions” throughout the text for clarity.