the Creative Commons Attribution 4.0 License.
the Creative Commons Attribution 4.0 License.
 | 05 Jun 2023
Strategies for improving the communication of satellite-derived InSAR data for geohazards through the analysis of Twitter and online data portals
John R. Elliott
Susanna K. Ebmeier
Juliet Biggs
Fabien Albino
Sarah K. Brown
Helen Burns
Andrew Hooper
Milan Lazecky
Yasser Maghsoudi
Richard Rigby
Tim J. Wright
Satellite-based earth observation sensors are increasingly able to monitor geophysical signals related to natural hazards, and many groups are working on rapid data acquisition, processing, and dissemination to data users with a wide range of expertise and goals. A particular challenge in the meaningful dissemination of Interferometric Synthetic Aperture Radar (InSAR) data to non-expert users is its unique differential data structure and sometimes low signal-to-noise ratio. In this study, we evaluate the online dissemination of ground deformation measurements from InSAR through Twitter, alongside the provision of open-access InSAR data from the Centre for Observation and Modelling of Earthquakes, Volcanoes and Tectonics (COMET) Looking Into Continents from Space with Synthetic Aperture Radar (LiCSAR) processing system. Our aim is to evaluate (1) who interacts with disseminated InSAR data, (2) how the data are used, and (3) to discuss strategies for meaningful communication and dissemination of open InSAR data. We found that the InSAR Twitter community was primarily composed of non-scientists (62 %), although this grouping included earth observation experts in applications such as commercial industries. Twitter activity was primarily associated with natural hazard response, specifically following earthquakes and volcanic activity, where users disseminated InSAR measurements of ground deformation, often using wrapped and unwrapped interferograms. For earthquake events, Sentinel-1 data were acquired, processed, and tweeted within 4.7±2.8 d (the shortest was 1 d). Open-access Sentinel-1 data dominated the InSAR tweets and were applied to volcanic and earthquake events in the most engaged-with (retweeted) content. Open-access InSAR data provided by LiCSAR were widely accessed, including automatically processed and tweeted interferograms and interactive event pages revealing ground deformation following earthquake events. The further work required to integrate dissemination of InSAR data into longer-term disaster risk-reduction strategies is highly specific, to both hazard type and international community of practice, as well as to local political setting and civil protection mandates. Notably, communication of uncertainties and processing methodologies are still lacking. We conclude by outlining the future direction of COMET LiCSAR products to maximize their useability.
- Article
(13758 KB) - Full-text XML
-
Supplement
(1019 KB) - BibTeX
- EndNote


1.1 Capabilities and communication of SAR and InSAR data
The availability of open-access Sentinel-1 data over the last ∼8 years, in addition to other emerging SAR satellites, creates an opportunity for making SAR and InSAR data accessible and useable to non-experts. However, there is a contrast between the intuitive accessibility and processing requirements of “visual” optical satellite imagery compared to the active microwave sensing of synthetic aperture radar (SAR) (Fig. 2). Similarly, limited availability of open access to SAR satellites has slowed the operational and scientific uptake until the Copernicus Sentinel-1 programme started in 2014.
Optical imagery is intuitive to interpret by the human eye and is therefore interpretable by non-specialists (Voigt et al., 2007), even considering non-visible spectral information such as near-wave or short-wave infrared, which can reveal non-visible characteristics such as the presence of chlorophyll and therefore the health of vegetation (Fig. 1a) (Pettorelli et al., 2005). By comparison, SAR data, representing transmitted radio-wave returns from a side-looking antenna, produce an all-weather view of the earth characterizing the scattering properties of the reflecting surface or object (Rosen et al., 2000) but are less readily interpretable. The image brightness or intensity is influenced by the reflecting surface characteristics including texture, shape, water content, and satellite viewing angle (Gens and Van Genderen, 1996) (Fig. 1b). The viewing angle can also cause shadowing and layover issues for steep terrain or for tall objects (Hagberg and Ulander, 1993). The SAR acquisition mode, wavelength, and polarization also add to the complexity of data that are acquired due to variable radar penetration depths and interaction with surface features. The recent expansion in commercial SAR constellations (e.g. ICEYE and Capella), which often focus on providing derived products and results rather than raw data, also influences the future interpretability requirements of SAR data.
Interferometric Synthetic Aperture Radar (InSAR) uses pairs of radar images to measure radar-wave phase differences, which corresponds to ground displacement after applying geometric, topographic, and atmospheric corrections (Simons and Rosen, 2007). InSAR measurements of ground displacements are used to study natural hazards and processes, such as earthquakes (Wright et al., 2004; Massonnet et al., 1993), landslides (Lauknes et al., 2010; Calò et al., 2012), volcanoes (Hooper et al., 2004; Ebmeier et al., 2018), and ice flow (Goldstein et al., 1993), in addition to anthropogenic signals such as ground water extraction and subsidence (Colesanti et al., 2003). For large and complex deformation, displacements derived from optical satellite imagery are a valuable alternative, particularly using daily revisit constellations such as Planet cubesats (Kääb et al., 2017). Over the last decade, new commercial radar satellites and open-access Sentinel-1 data have transformed InSAR into a routine analytical and monitoring technique (Biggs and Wright, 2020).
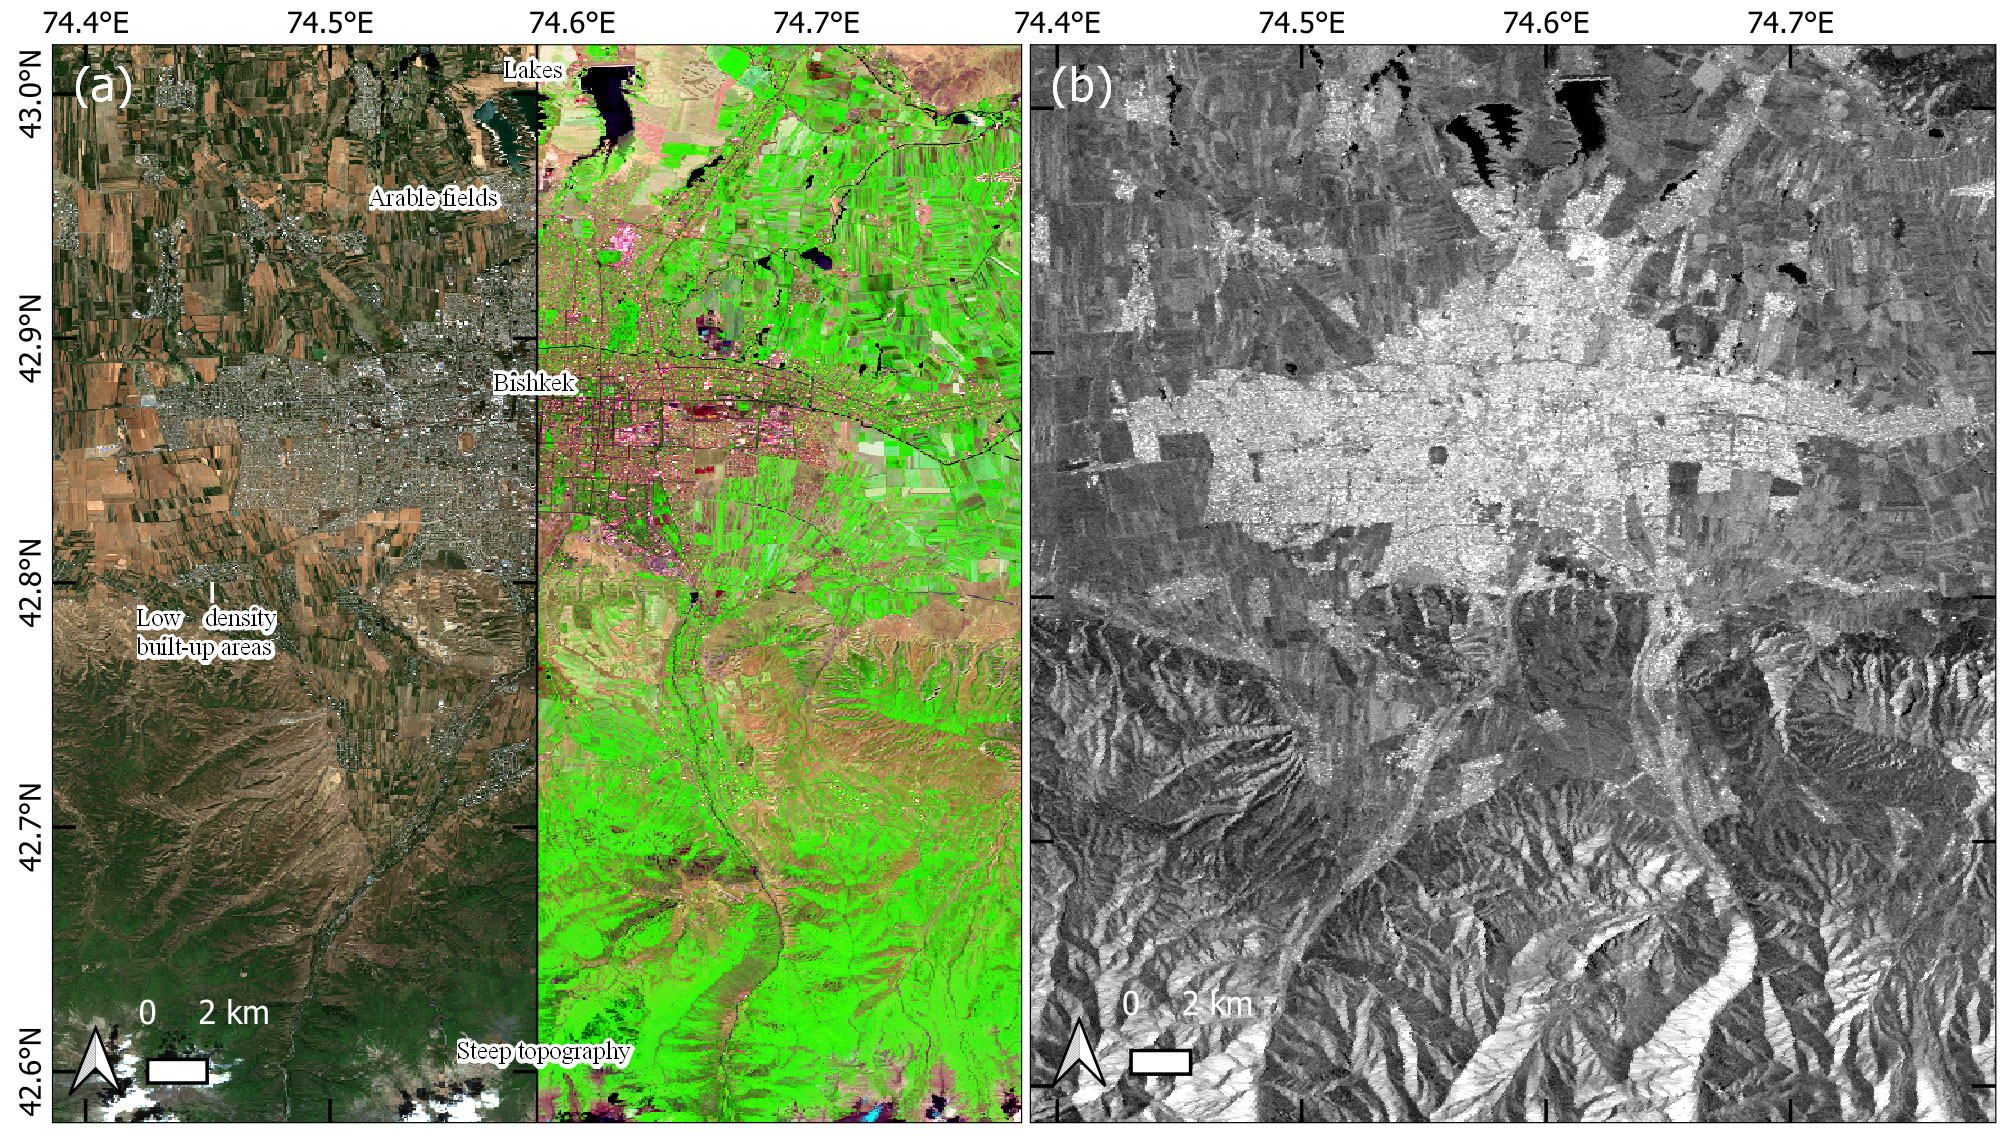
Figure 1Comparing optical and SAR data. (a) Example of a 10 m resolution Sentinel-2 optical image (27 June 2021) over the city of Bishkek and mountains to the south. Left panel shows a true-colour (red, green, and blue bands) image, and the right panel shows a false colour composite of short-wave infrared, near infrared, and blue bands. (b) Sentinel-1 radar multi-looked intensity image (26 June 2021) from the Looking Into Continents from Space with Synthetic Aperture Radar (LiCSAR) processing system (Lazecký et al., 2020) covering the same area of Bishkek in (a) at 50 m resolution.
Common products generated using InSAR include wrapped and unwrapped interferograms, coherence maps, and displacement time series (Fig. 2). Wrapped interferograms show colour cycle fringes representing half of λ (wavelength), equivalent to 2.8 cm of motion per cycle for Sentinel-1 towards or away from the satellite, which are unwrapped to show a line-of-sight displacement in an unwrapped interferogram (Fig. 2). Coherence is low if the scattering properties of the reflecting surface change between SAR acquisitions, which can inhibit displacement measurements (e.g. close to a fault rupture following an earthquake but more commonly associated with changes in vegetation or snow cover). However, changes in coherence also reveal insights into other earth surface processes, such as glacier movement (Atwood et al., 2010), volcanic eruption (Dualeh et al., 2021), and landsliding (Burrows et al., 2019), or urban damage following disaster events (Pilger et al., 2021).
Routine or on-demand production of InSAR products is available through several platforms including LiCSAR (Lazecký et al., 2020), the Alaska Satellite Facility (Kennedy et al., 2021; Meyer et al., 2017), and the GeoHazards Exploitation Platform (Galve et al., 2017). The LiCSAR processing system is detailed by Lazecký et al. (2020). Briefly, Sentinel-1 SAR data are automatically processed over active tectonic and volcanic regions to primarily produce coherence maps, wrapped and unwrapped interferograms at 0.001∘ resolution in WGS-84 coordinate system (111 m at the Equator), which can be used to derive displacement time series using LiCSBAS software (Morishita et al., 2020). Open-access datasets and online analytical tools and geographic information services can broaden the user base of satellite data by reducing the requirement for complex processing expertise. This is important when developing products and systems that integrate earth observation data, for example in-country monitoring capabilities for natural hazards to reduce disaster risk, in addition to using the data for disaster response (Joyce et al., 2009; Wang et al., 2012; Poblet et al., 2014).
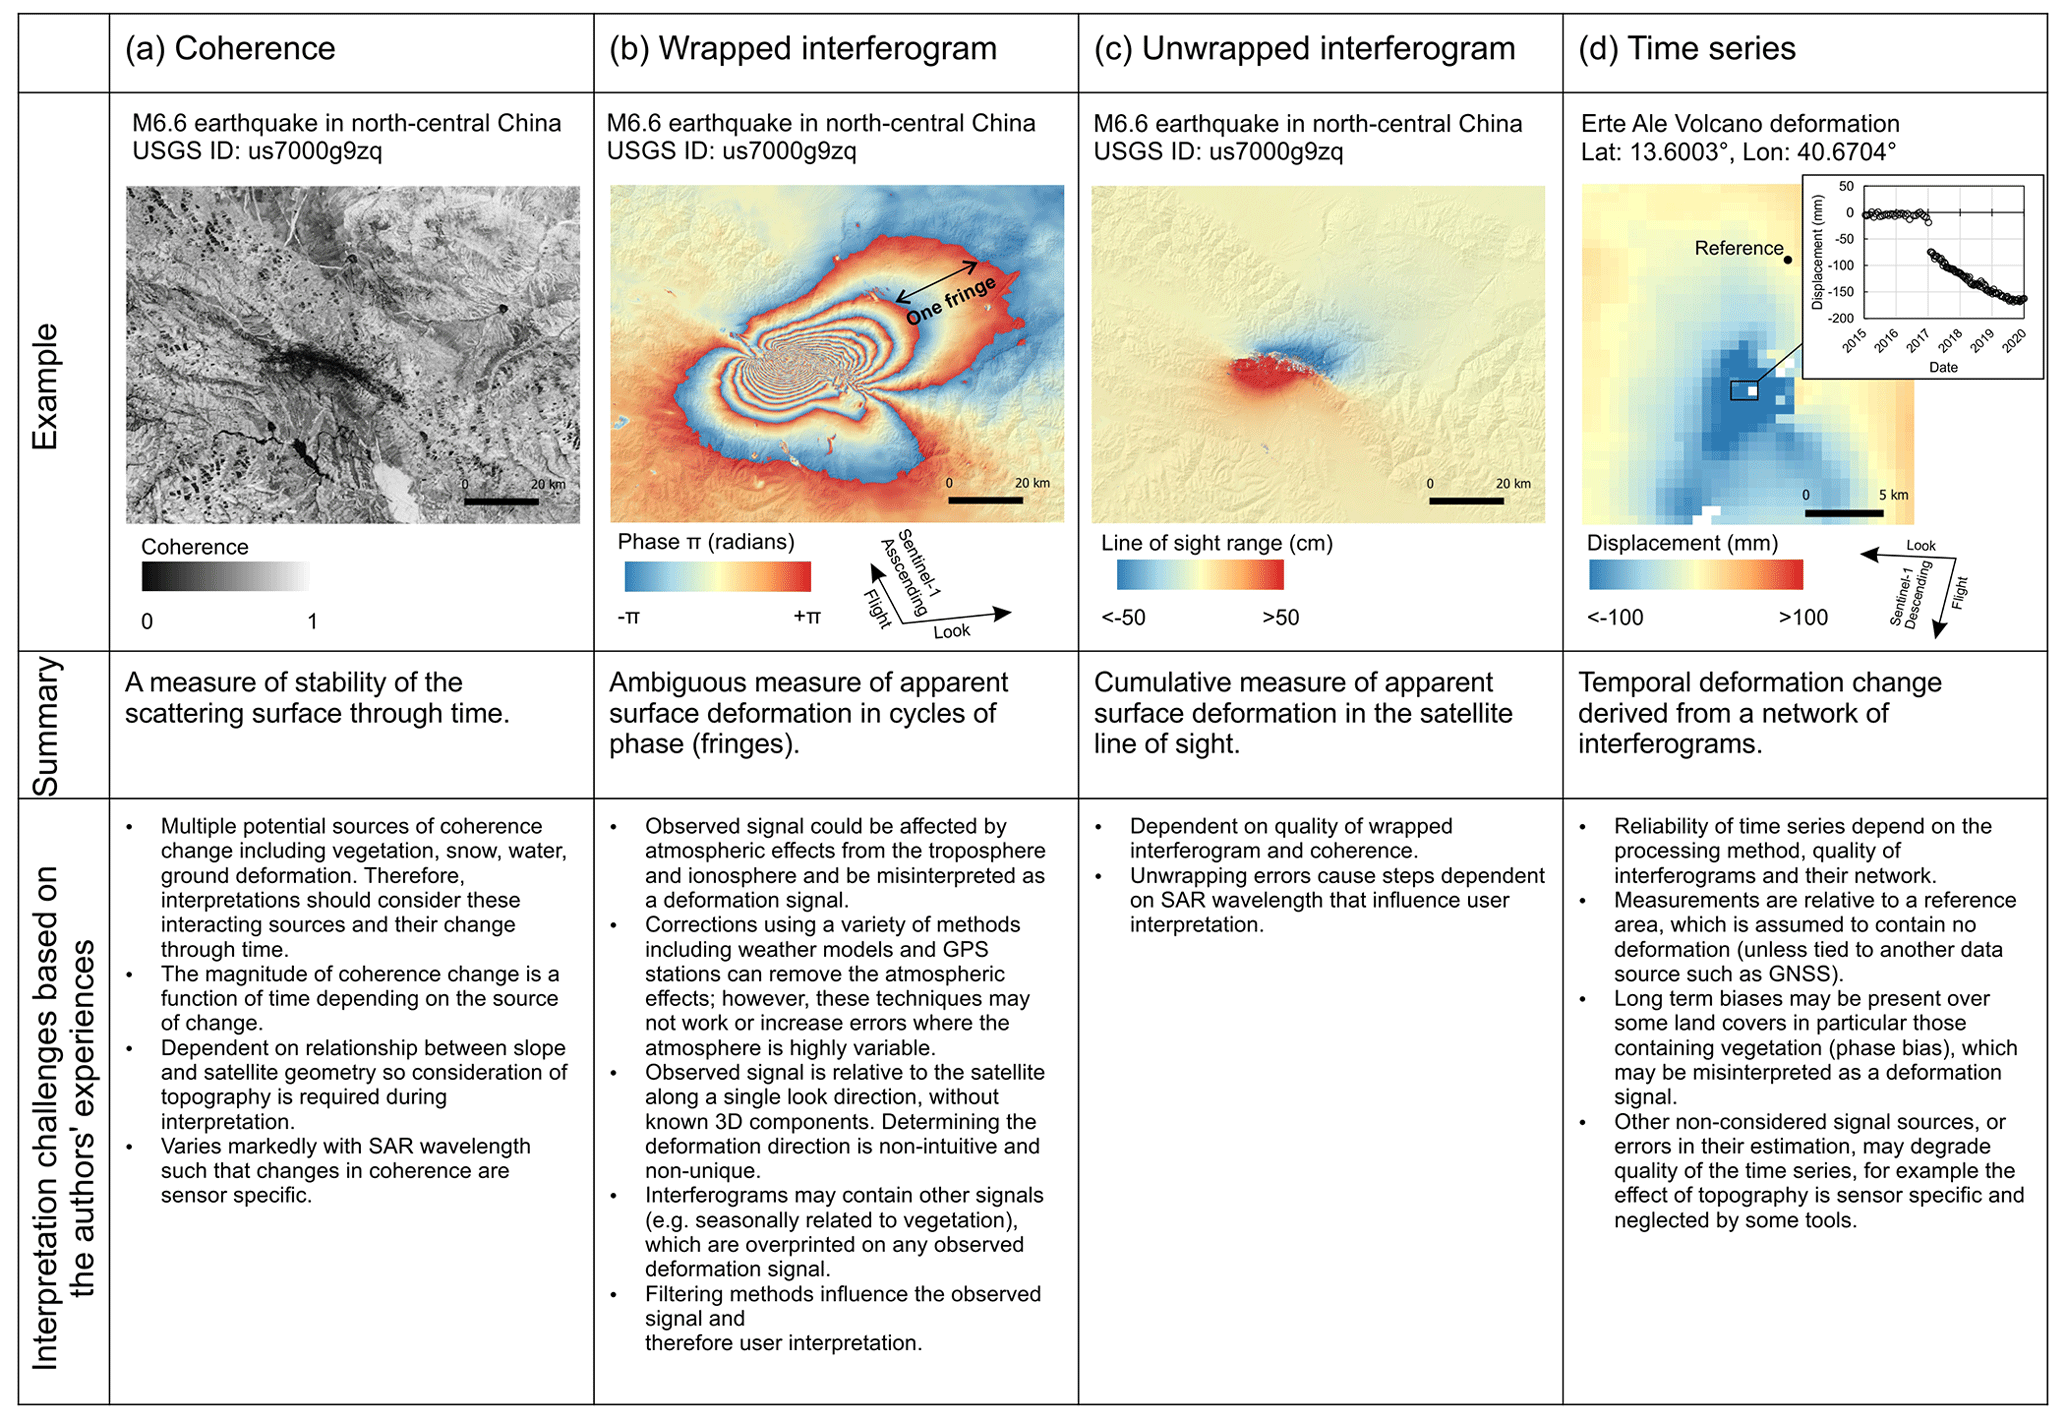
Figure 2Example applications of InSAR products from the LiCSAR processing system (Lazecký et al., 2020). Coherence data (a), wrapped interferogram (b), and unwrapped interferogram (c) for the M6.6 earthquake in north-central China (7 January 2022). (d) Displacement time series for Erte Ale Volcano capturing the 2017 eruption (https://comet.nerc.ac.uk/comet-volcano-portal/ last access: 30 May 2023). Higher-resolution displacement time series for Erte Ale were presented by Moore et al. (2019).
1.2 Natural hazard communications
Both optical and radar satellite sensors, often in combination, are used to monitor and respond to natural hazards owing to their large spatial coverage, increasingly short revisit periods, and the diverse scope of analytical capabilities (Elliott et al., 2016; Kirschbaum et al., 2019; Joyce et al., 2009; Tronin, 2010; Voigt et al., 2007). For emergency response, data are analysed to produce mapping products (e.g. of building damage, floods, and fires), which are communicated to relevant in-country organizations to support response coordination, such as through the Copernicus Emergency Management Service (EC JRC, 2020). Satellite data that are usually restricted or expensive are also provided for research and hazard response through international initiatives such as the CEOS Working Group on Disasters Pilots and Demonstrators (Pritchard et al., 2018; Kirschbaum et al., 2017). Recently, social media sites have been used by scientists and citizen scientists to investigate disasters in real time using satellite data and eyewitness multimedia and accounts to collaboratively build knowledge in an open forum (Lacassin et al., 2020; Shugar et al., 2021; Ruan et al., 2022; Hicks, 2019; Earle et al., 2011). Twitter in particular has emerged as a platform used by scientists to create, discuss, and share research outputs (Van Noorden, 2014; Bruneau et al., 2021). National agencies such as the United States Geological Survey or volcano monitoring observatories also use dedicated social media accounts to provide updates on a range of natural hazards. These Twitter communications are open, therefore allowing direct public interaction, and are also increasingly directly embedded in news media reporting (Oschatz et al., 2021; Broersma and Graham, 2013). This highlights the important ethical considerations regarding the release of data, with or without interpretation or communication of uncertainties, by users with differing expertise.
Effective communication and knowledge co-production between scientists and citizens is essential to creating effective risk communication and disaster risk-reduction strategies (Hicks and Barclay, 2018); however, it requires negotiating complex professional conduct considerations including leadership, communications, cultural differences, community requirements and expectations, access to information, and misinformation (Newhall, 1999; Pallister et al., 2019; West et al., 2021). The provision of open-source satellite data and analysis tools offers one mechanism to break down geographical and social barriers to knowledge co-production (Turner et al., 2015). However, the ethics of scientific conduct and data dissemination are complex, particularly during extended disaster events such as volcanic crises, for example, as described by Newhall et al. (1999). We do not evaluate data use for specific disaster events in this study; however, these considerations provide an important context to the dissemination and discussion of data products for individuals or teams that are remote to the event. For example, (1) considering when and what data to release and with what level of interpretation, considering interpretation differences and underlying uncertainties; (2) considering whether releasing data will distract from official advice or undermine local teams; and (3) considering whether releasing the data can contribute to public safety, even if results are only preliminary.
1.3 Study aim: LiCSAR and InSAR communication
In this study, we aimed to evaluate how InSAR data are communicated and engaged with through Twitter and the automatic InSAR processing system LiCSAR. Specifically, we address what we can learn from Twitter communication to improve the utility of this processing system. Through COMET, open-access LiCSAR data support research into tectonic, volcanic, and other earth processes, in addition to responding to natural hazard events and aiming to support the integration of earth observation data into disaster risk-reduction strategies.
Noting the less intuitive visual outputs and applications of InSAR to non-specialists (Fig. 2), we explore whether communications are predominantly in-reach (to other academic scientists) or outreach (e.g. to industry experts, the media, and decision makers) and the types of data that are communicated in each case. We incorporate user feedback from LiCSAR to identify how the current provision of data products aligns with those communicated using Twitter. We also consider engagement with the LiCSAR Earthquake InSAR Data Provider (EIDP) that automatically processes and disseminates InSAR data for major earthquakes. We then identify future directions to improve the communication and application of InSAR products to natural hazard disaster risk reduction.
To investigate the prevalence and types of InSAR data communication over Twitter, we first collected and analysed a database of InSAR-themed tweets, which were also used to derive the community of InSAR Twitter users by analysing user connections and key words in profile descriptions. Engagement with open-access LiCSAR InSAR data was then evaluated using website analytics from the LiCSAR Portal, combined with a user feedback survey. We then used the Earthquake InSAR Data Provider (EIDP) and the COMET Volcano Deformation Portal as example use cases of LiCSAR data to determine how these data align with those communicated using Twitter and to identify directions to improve these InSAR data dissemination.
2.1 InSAR tweets
Twitter was used to derive InSAR communications (tweets), including how widely the tweets were circulated (retweeted) through a network of users, each with profile descriptions that often indicate professions and interests. We used the Twitter application programming interface (API) and Rtweet package v0.7.0 (Kearney, 2019; R Core Team, 2021) to retrieve public tweets (excluding retweets) from 18 August 2020 to 9 February 2022 mentioning “InSAR”. We excluded retweets to avoid considering the same tweet text multiple times, though we do consider the retweet count for each tweet. Retweets reveal how and what information is spread through Twitter and therefore could provide useful context on the spread of misinformation in relation to natural hazards. We processed tweet text to remove stop words, mentions, uniform resource locators, emojis, numbers, and punctuation (e.g. Ruan et al., 2022). Finally, we removed a list of other words, tweets, and user IDs that were not relevant to our study, including “InSAR” tweets relating to the International Society for Autism Research (Supplement). We used word counts from the remaining tweet text to identify the most commonly occurring words or hashtags in the InSAR tweets to identify the context of the InSAR tweets.
To identify the most common and most popular InSAR Twitter communications, we examined the user networks for the top 10 InSAR tweeters, ranked by (1) number of tweets and (2) the tweeters of the top 10 most retweeted tweets. For each of the top 10 user IDs (a static ID number, which, unlike the Twitter user handle, cannot be changed) in (1) and (2), we used Rtweet to find the network of users that were followed by each account, therefore unravelling active components of the Twitter InSAR network. User connections were summed to find commonly connected users within the InSAR network. For example, a user ID followed by five of the top 10 tweeters would feature a count of five. We also extracted all user IDs that followed the top 10 accounts in (1) and (2). These followers represent the users that would receive tweets on their timeline from the top 10 InSAR tweeters in (1) and (2). The profile descriptions of these users were classified using keyword search strings from Côté et al. (2018) into “scientist” and “non-scientific” groups using the R package “stringr” (Wickham, 2017) to determine different applications of InSAR and whether InSAR communications were predominantly amongst scientists or outreach. The keyword strings we used are shown in the Supplementary information. Examples of the “scientist” class included “professor”, “phd”, “post doc”, “doctoral”, and “research scientist” and could be within academia (universities) or applied and research-focussed industry or government agencies. Profiles that did not match the scientist classification were assigned “non-scientist”. “Non-scientists” are expected to include decision makers such as government agencies, media and journalists, outreach organizations such as museums and science educators, and other members of the public (Côté et al., 2018). These classifications were used to disaggregate different users of InSAR data; however, we acknowledge the distinction between “scientist” and “non-scientist” is ambiguous in some cases. We validated the classification by manually inspecting a random sample of 500 users from each of the scientist and non-scientific groups. We did not disaggregate the non-scientific group into additional categories such as “media” or “decision makers” due to the high misclassification rates observed by Côté et al. (2018).
2.2 Website analytics
To evaluate how open-access InSAR data are used and by whom, we used statistics from the COMET LiCSAR project, combined with our analysis of InSAR communications using Twitter.
Website analytics for the LiCSAR Portal were obtained from Google Analytics from January 2017 to December 2019 and WordPress.com starting in January 2020. Both platforms use a page “views” metric, which represents instances of a user viewing the portal webpage; however, the two analytics are potentially not directly comparable. User feedback on the LiCSAR Portal was collected using a Google Forms survey containing 15 questions (Fig. S1 in the Supplement), which were designed to collect information on who was using the portal, their usage and experience with LiCSAR data, and suggestions for future developments. Responses were provided by visitors to the LiCSAR Portal that clicked the “Give User Feedback” link on the portal homepage. Responses were also informally solicited by COMET members through peer networks and existing partnerships by sending a link to the feedback form. COMET membership was asked as a survey question to distinguish these responses. In this study, we used anonymized responses obtained from the initiation of the survey in February 2020 to February 2022 (n=80); however, a link to the survey remains on the LiCSAR Portal for ongoing feedback.
2.3 LiCSAR Earthquake InSAR Data Provider (EIDP)
LiCSAR data are produced following specific earthquake events and consolidated through an “Earthquakes” tab on the LiCSAR Portal. First, earthquake events that meet a threshold magnitude and depth trigger the activation of LiCSAR frames for data processing (Lazecký et al., 2020). These events are plotted on an interactive Leaflet map along with key metadata from the United States Geological Survey (USGS). The map interfaces with a data table that allows users to search and download data for each event from an online event page. These event pages are automatically generated for each earthquake event and are regularly updated in the following weeks to include new co-seismic and post-seismic data. Details of the earthquake events with a link to the event page are automatically tweeted by @COMET_database, in addition to the first processed interferogram overlapping the earthquake epicentre. We used page views logged using Google Analytics to evaluate user engagement with the EIDP system, and we report statistics for the same reporting period as the Twitter data (18 August 2020 to 9 February 2022).
2.4 COMET Volcano Deformation Portal
The COMET Volcanic and Magmatic Deformation Portal (https://comet.nerc.ac.uk/comet-volcano-portal/, last access: 30 May 2023) allows observatory scientists to critically interrogate automatically generated Sentinel-1 interferograms and identify deformation around active volcanoes (Rigby et al., 2021). The volcano portal provides access to interferograms and time series (Lazecký et al., 2020; Morishita et al., 2020) for an initial subset of volcanoes where processing is most complete, with the aim of eventually including all subaerial Holocene volcanoes. The portal allows users to browse through images of interferograms using a “slider” tool and to plot time series (including choice of reference area) and profiles for comparison with topography interactively. Wrapped and unwrapped interferograms can be compared, as well as time series with and without GACOS atmospheric correction (Yu et al., 2018) and spatiotemporal filtering (Morishita et al., 2020). The aim is to provide users with tools that support interrogation of the data, with a particular focus on distinguishing between atmospheric features and volcanic deformation (e.g. Pinel et al., 2011; Ebmeier et al., 2018; Biggs et al., 2021). We present new Sentinel-1 InSAR results in the context of historical observations of volcano deformation (as described in Ebmeier et al., 2018) organized according to volcano numbers from the Smithsonian list of Holocene volcanoes (Global Volcanism Program, 2022). Machine-learning-based tools (Biggs et al., 2022) that flag high-magnitude displacements also provide users with a tool for quickly finding major deformation events in a time series. We deliberately do not provide authoritative interpretations of the interferograms but provide tools for an engaged user to assess the automatically processed data for themselves, facilitating comparisons to both ground-based measurements and independent processing of the InSAR data. The spatial resolution of images used for the on-the-fly time series analyses is low, being based on boxes centred on volcanoes (or sites of active magmatic deformation) with a modal length and width of 50 km (this would be sufficient to capture ∼90 % of historical magmatic and volcanic displacements, although in a few cases signals do exceed hundreds of kilometres in diameter (Ebmeier et al., 2018; Henderson and Pritchard, 2013). These tools are designed to allow on-the-fly analysis and also allow the user to download either the time series results shown on-screen (currently in csv format) or the original interferograms.
Our communication strategy for volcanic signals is in contrast to the more responsive role of the EIDP and reflects the challenges of forecasting risk associated with volcanic hazards that evolve dynamically on temporal scales that can range from hours to years. While InSAR measurements have the potential to capture displacements significant for understanding and even forecasting volcanic hazards, there are specific obstacles to the exploitation of satellite radar for volcanology. Development of the volcano InSAR portal tools has also been informed by consultation with volcano observatory colleagues, including colleagues at Addis Ababa University, Ethiopia, and Instituto Geofisico Escuala Politecnica Nacional, Ecuador.
3.1 InSAR Twitter
We collected a total of 16 621 tweets from 18 August 2020 to 9 February 2022 mentioning “InSAR”, which was reduced to 5349 after removing retweets and down to 4312 after cleaning the dataset (Sect. 2.1). These cleaned tweets originated from 1935 unique Twitter users. We observed a mean of 8±7 tweets per day and spikes related to notable events including scientific conferences, news media reports, earthquakes, and popular Twitter threads (Fig. 3). A data gap was present in the time series (29 October–6 December 2020); however, the source was unknown and could be related to an issue with the collection of tweets. Specific earthquake events related to increased activity included those in Croatia (USGS ID: us6000d3zh, date: 29 December 2020), Greece (USGS ID: us7000df40, date: 3 March 2021), China (USGS ID: us7000e54r, date: 21 May 2021), and Haiti (USGS ID: us6000f65h, date: 14 August 2021). Typically, these events included multiple other earthquake events (foreshocks and aftershocks) at each location. Other peaks in tweets were related to InSAR sessions at the American Geophysical Union (AGU) and European Geosciences Union (EGU) conferences in December 2020 and April 2021, respectively. News media reports were associated with tweet peaks in June 2021 related to the upcoming Venus Emissivity, Radio Science, InSAR, Topography, and Spectroscopy (VERITAS) mission to map Venus and to reports of subsidence in Mexico City. Finally, two peaks in tweet activity were related to specific Twitter threads written in Spanish on subsidence in Mexico City and earthquake seasonality in Mexico (Fig. 3).
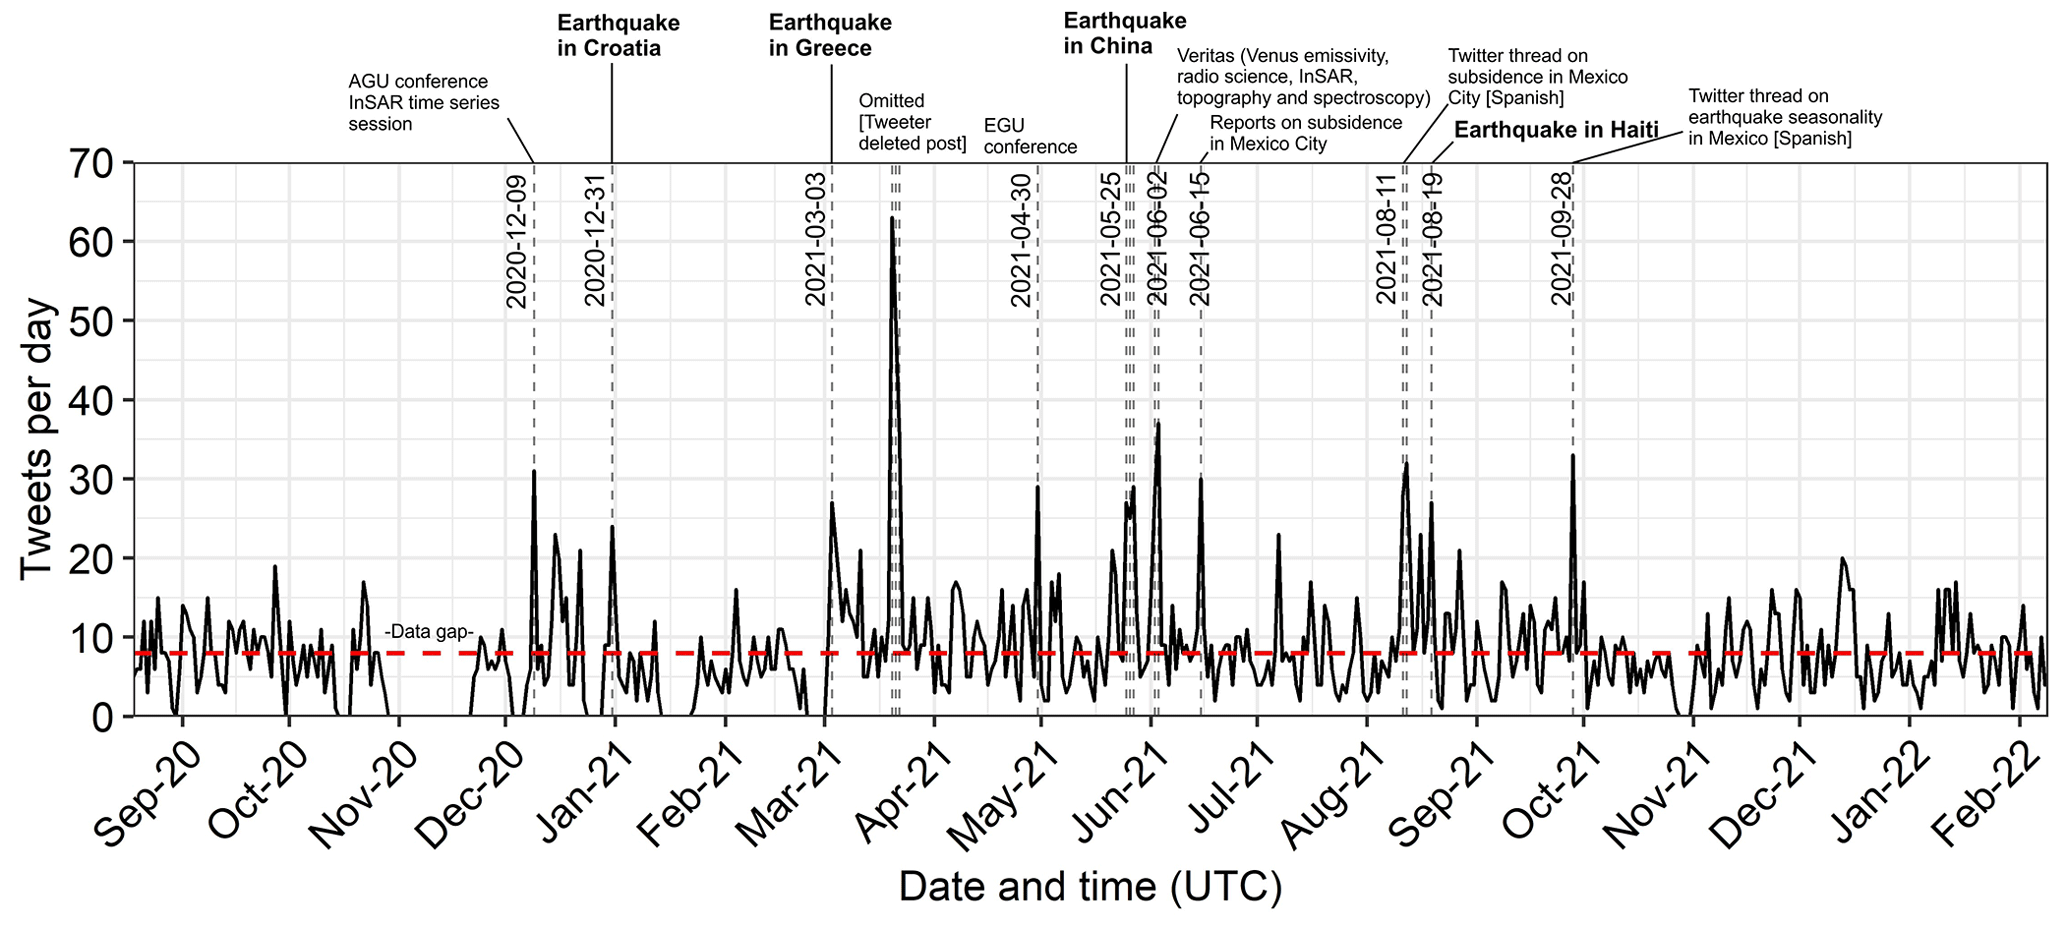
Figure 3Timeline of InSAR tweets from September 2020 to February 2022. Dashed red line shows the mean of eight tweets per day (excluding data gap). Vertical lines and annotation are shown for events exceeding 22 tweets per day (2 standard deviations from the mean). Dates shown for the earthquake events in bold represent the date of peak Twitter activity. The peak in March 2021 was omitted since the post and account were removed by the user.
Word count analysis of the text of InSAR tweets revealed that mentions of “data”, including Sentinel-1 SAR, and applications of InSAR, such as to natural hazards, occurred most frequently (Fig. 4). “Data” was the most frequently occurring word (n=676) followed by “Earthquake” (n=312) and “Deformation” (n=269) (Fig. 4a). The most popular hashtags used in InSAR tweets were “Sentinel1” (n=323), “Earthquake” (n=259), and “SAR” (n=143) (Fig. S2). The most popular words and hashtags in the top 50 most retweeted InSAR tweets were “Deformation” (n=11), “Earthquake” (n=10), and “Dike” (n=9) (Fig. 4b). Specific data sources identified in the tweet word analysis included “Sentinel-(1)”, “VERITAS”, “NISAR” (NASA-ISRO-SAR), and “ALOS” (Advanced Land Observing Satellite) (Fig. 4, Table S1 in the Supplement).
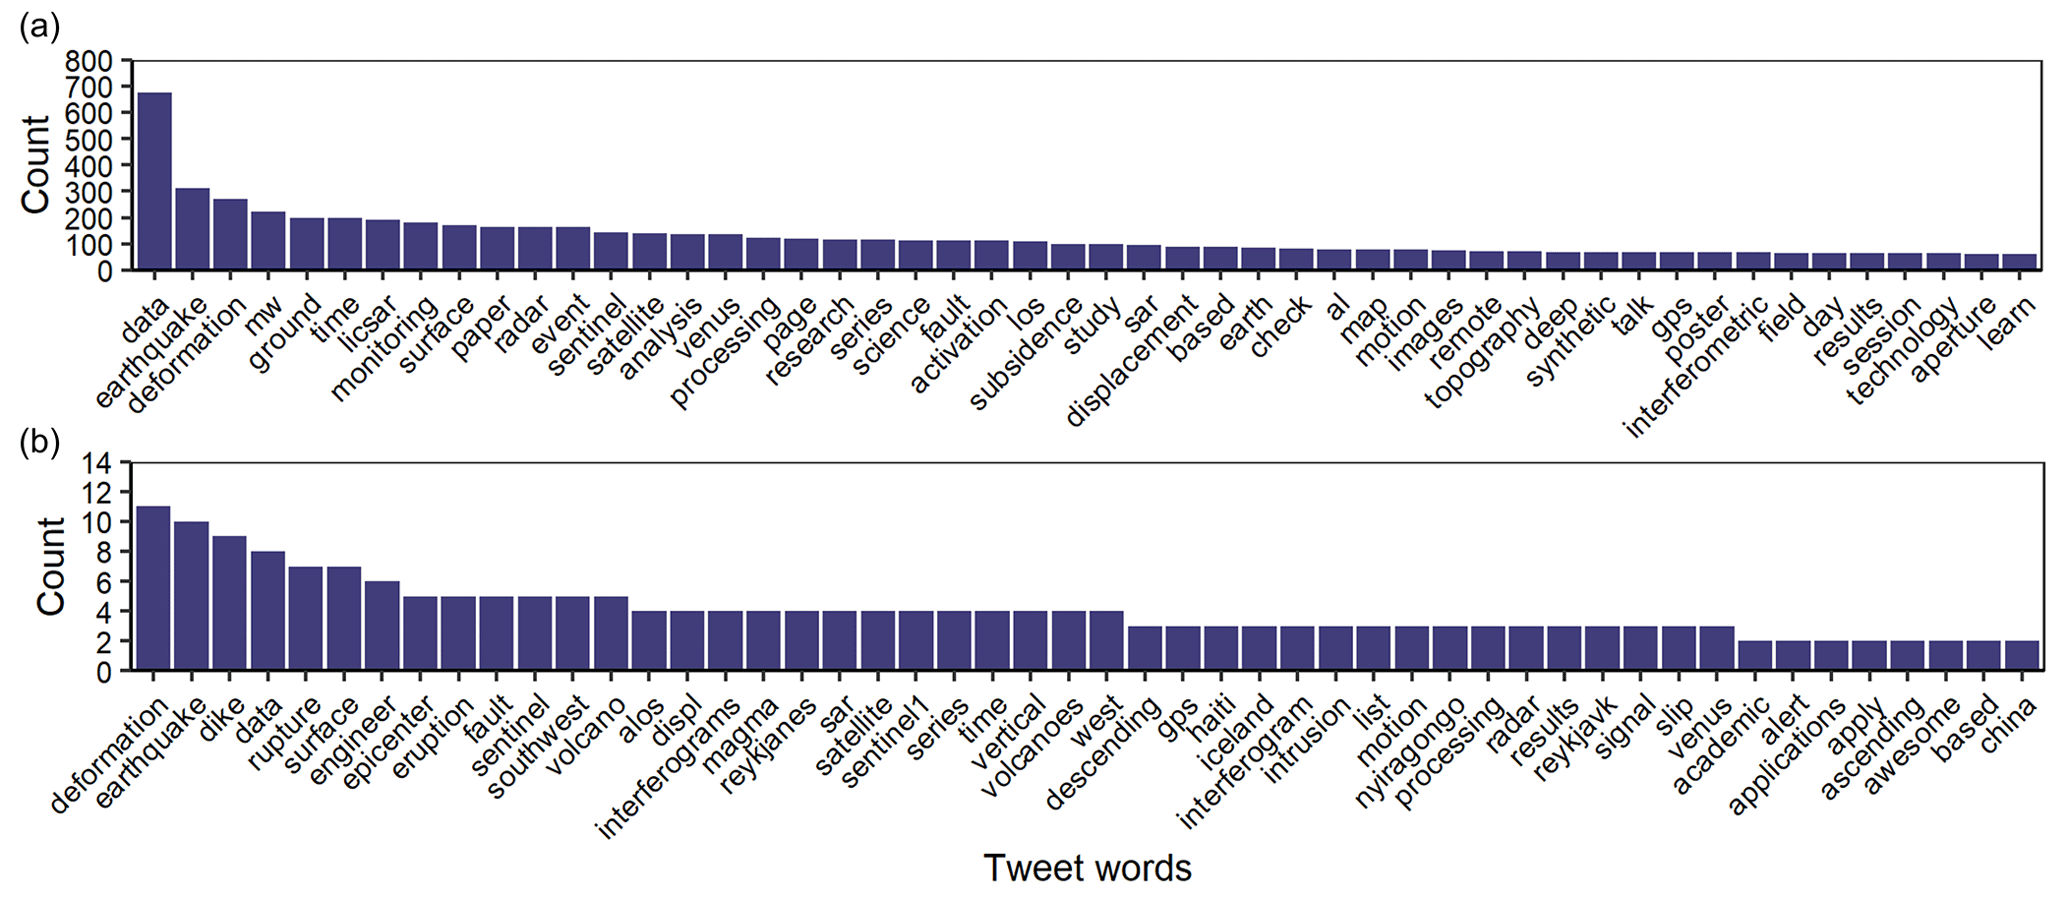
Figure 4(a) Top 50 words occurring in the text of InSAR tweets. (b) Combined top 50 words and hashtags occurring in the 50 most retweeted InSAR tweets. Wordcloud representations of the same data are shown in Fig. S2.
We analysed the InSAR Twitter social network for (1) the top 10 tweeters of InSAR content and (2) the top 10 most retweeted tweeters of InSAR content. Therefore, capturing (1) the greatest tweeters of InSAR-related tweets and (2) the tweeters of content with the highest level of engagement. The network plot (Fig. 5a, b) circle markers show common connections and are coloured by their count (node_connections) where a user is followed by two or more of the top 10 tweeters (Fig. 5a) or a tweeter of a top 10 most retweeted tweet (Fig. 5b). The black lines with transparency represent other Twitter users followed by a labelled (bold black text) user. Two users were present in both groups: “ericfielding” and “mr_insar” (Fig. 5a, b). The top 10 tweeters followed 7334 users of which 916 had two or more node connections (i.e. they were followed by two or more of the top 10 tweeters) (Fig. 5a). By comparison, the top 10 most retweeted tweeters followed 5056 users, of which 687 had two or more node connections (Fig. 5b). Users with high node connections (out of a potential maximum of 10) in some cases featured in both network plots (example users in blue text in Fig. 5a, b) despite not being a top 10 tweeter or retweeted tweeter themselves.
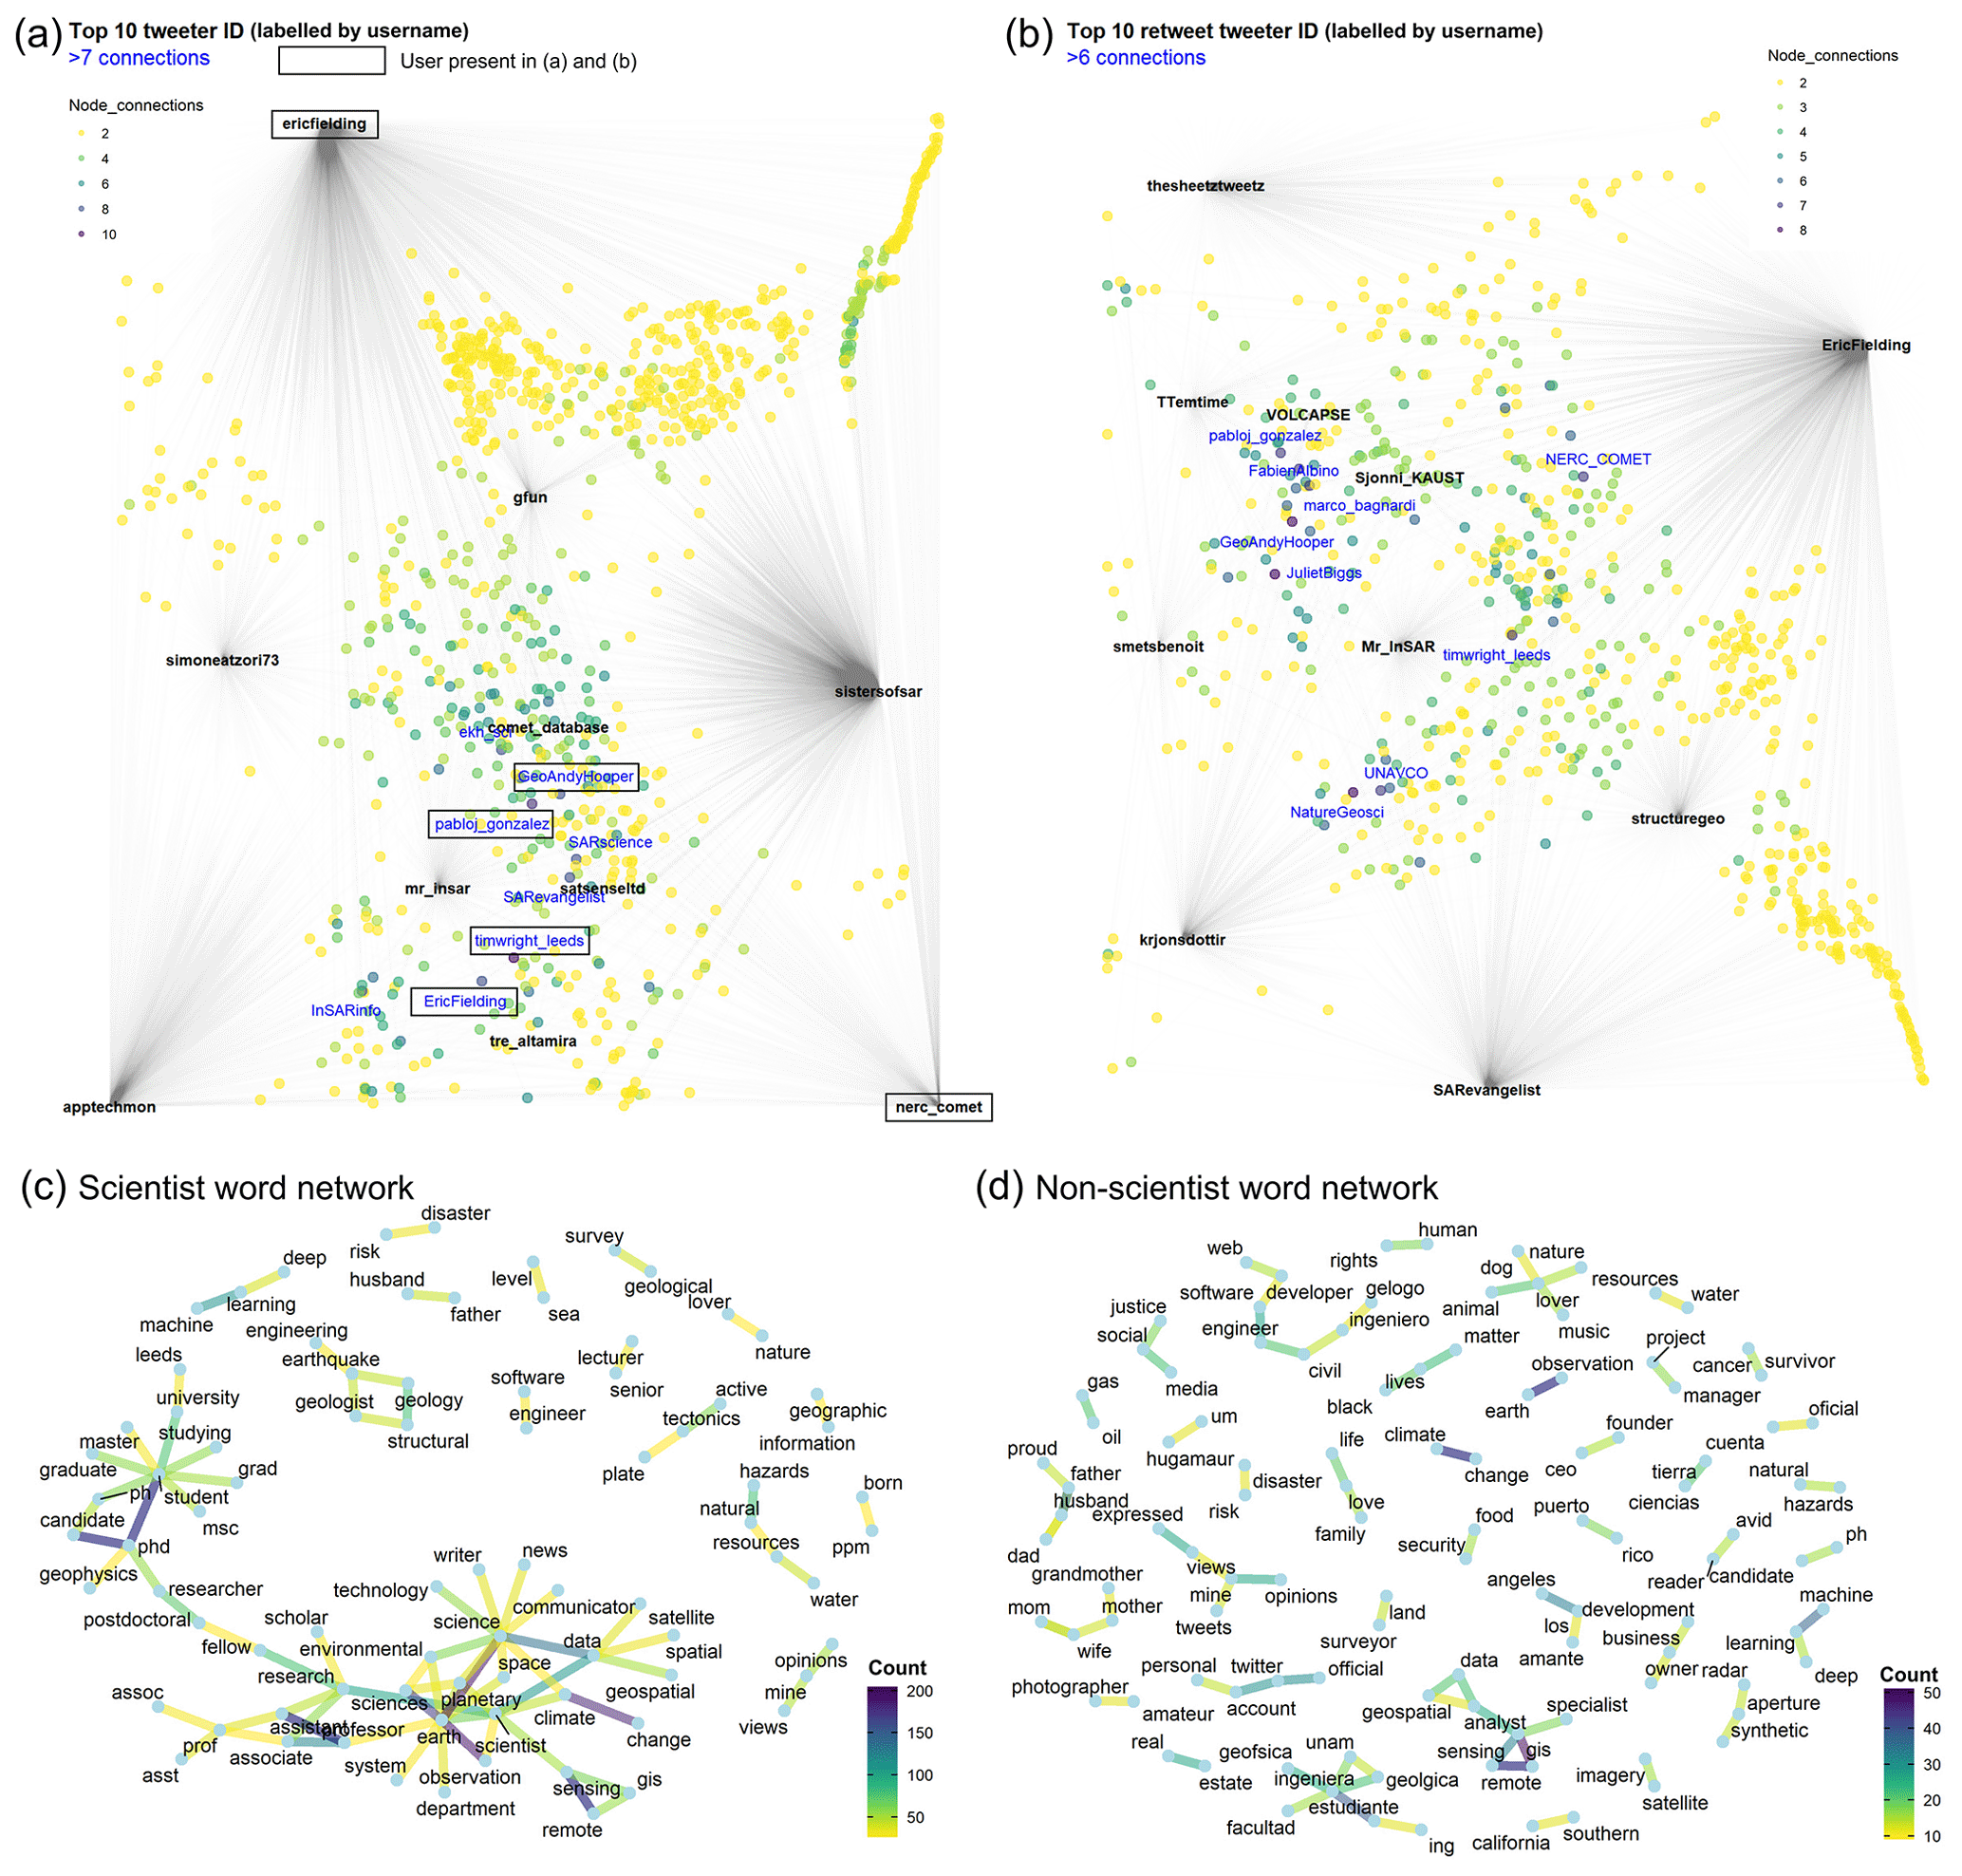
Figure 5(a) User network showing who the top 10 InSAR tweeters follow. Black lines with transparency represent individual users followed by each of the top 10 tweeters. Circle markers show common connections and their count where a user is followed by two or more of the top 10 tweeters. Users with greater than seven connections are labelled with their twitter handle. Note that “ericfielding” is plotted as both a top 10 tweeter and a user with >7 connections. (b) Network plot as per (a) for the Twitter users that tweeted the top 10 most retweeted tweets. (c) Paired word network from the user profile descriptions of scientists and (d) non-scientists (also shown in Table S3). The count shows the number of times each pair of words occurred.
The followers (n=31 680) of users in the top 10 tweeter groups (black text in Fig. 5a, b), were classified into scientist and non-scientific audiences to determine the in-reach and outreach status of the InSAR tweets. We excluded the space reporter “thesheetztweetz”, since their retweet was about the NASA VERITAS, which is a Venus mission we exclude in our study of earth science InSAR. We found that the networks were predominantly outreach, since 62 % of the followers (n=19 778) were non-scientists and 38 % (n=11 902) were scientists. The profile description word network for the scientist group was more connected than non-scientists (Fig. 5c, d). Commonly occurring paired words for scientist profiles that were indicative of user interests included “machine learning” (n=113), “natural hazards” (n=80), “structural geology” (n=80), and “active tectonics” (n=60) (Table S2). Non-scientist paired words were more diverse with lower occurrence counts, including “civil engineer” and “animal lover” (n=21) and “gis specialist” (n=18) (Table S3). Commonalities between both communities included “remote sensing”, which was most frequent in both lists and suggests the non-scientist group included a large community of satellite data users, likely including industry earth observation experts applying InSAR analyses.
Of the 10 most retweeted InSAR tweets (Fig. 6), 2 were plain text (a, e); 1 contained a video of volcanic deformation (b); 1 contained a photograph and description of subsidence (c); 3 contained wrapped interferograms of volcanic deformation of Nyiragongo, Democratic Republic of the Congo (d), Iceland (g), and Galapagos (h); 1 contained new open-source SAR code (f); and 2 contained line-of-sight displacement measurements, one of volcanic deformation in Iceland (i) and one of an earthquake in Haiti (j). Four of the tweets presented Sentinel-1 data (d, g, h, i) and one presented ALOS-2 data (j). Notably, these tweets mostly featured data annotations and text explanations of the associated images and were retweeted a total of 1487 times.
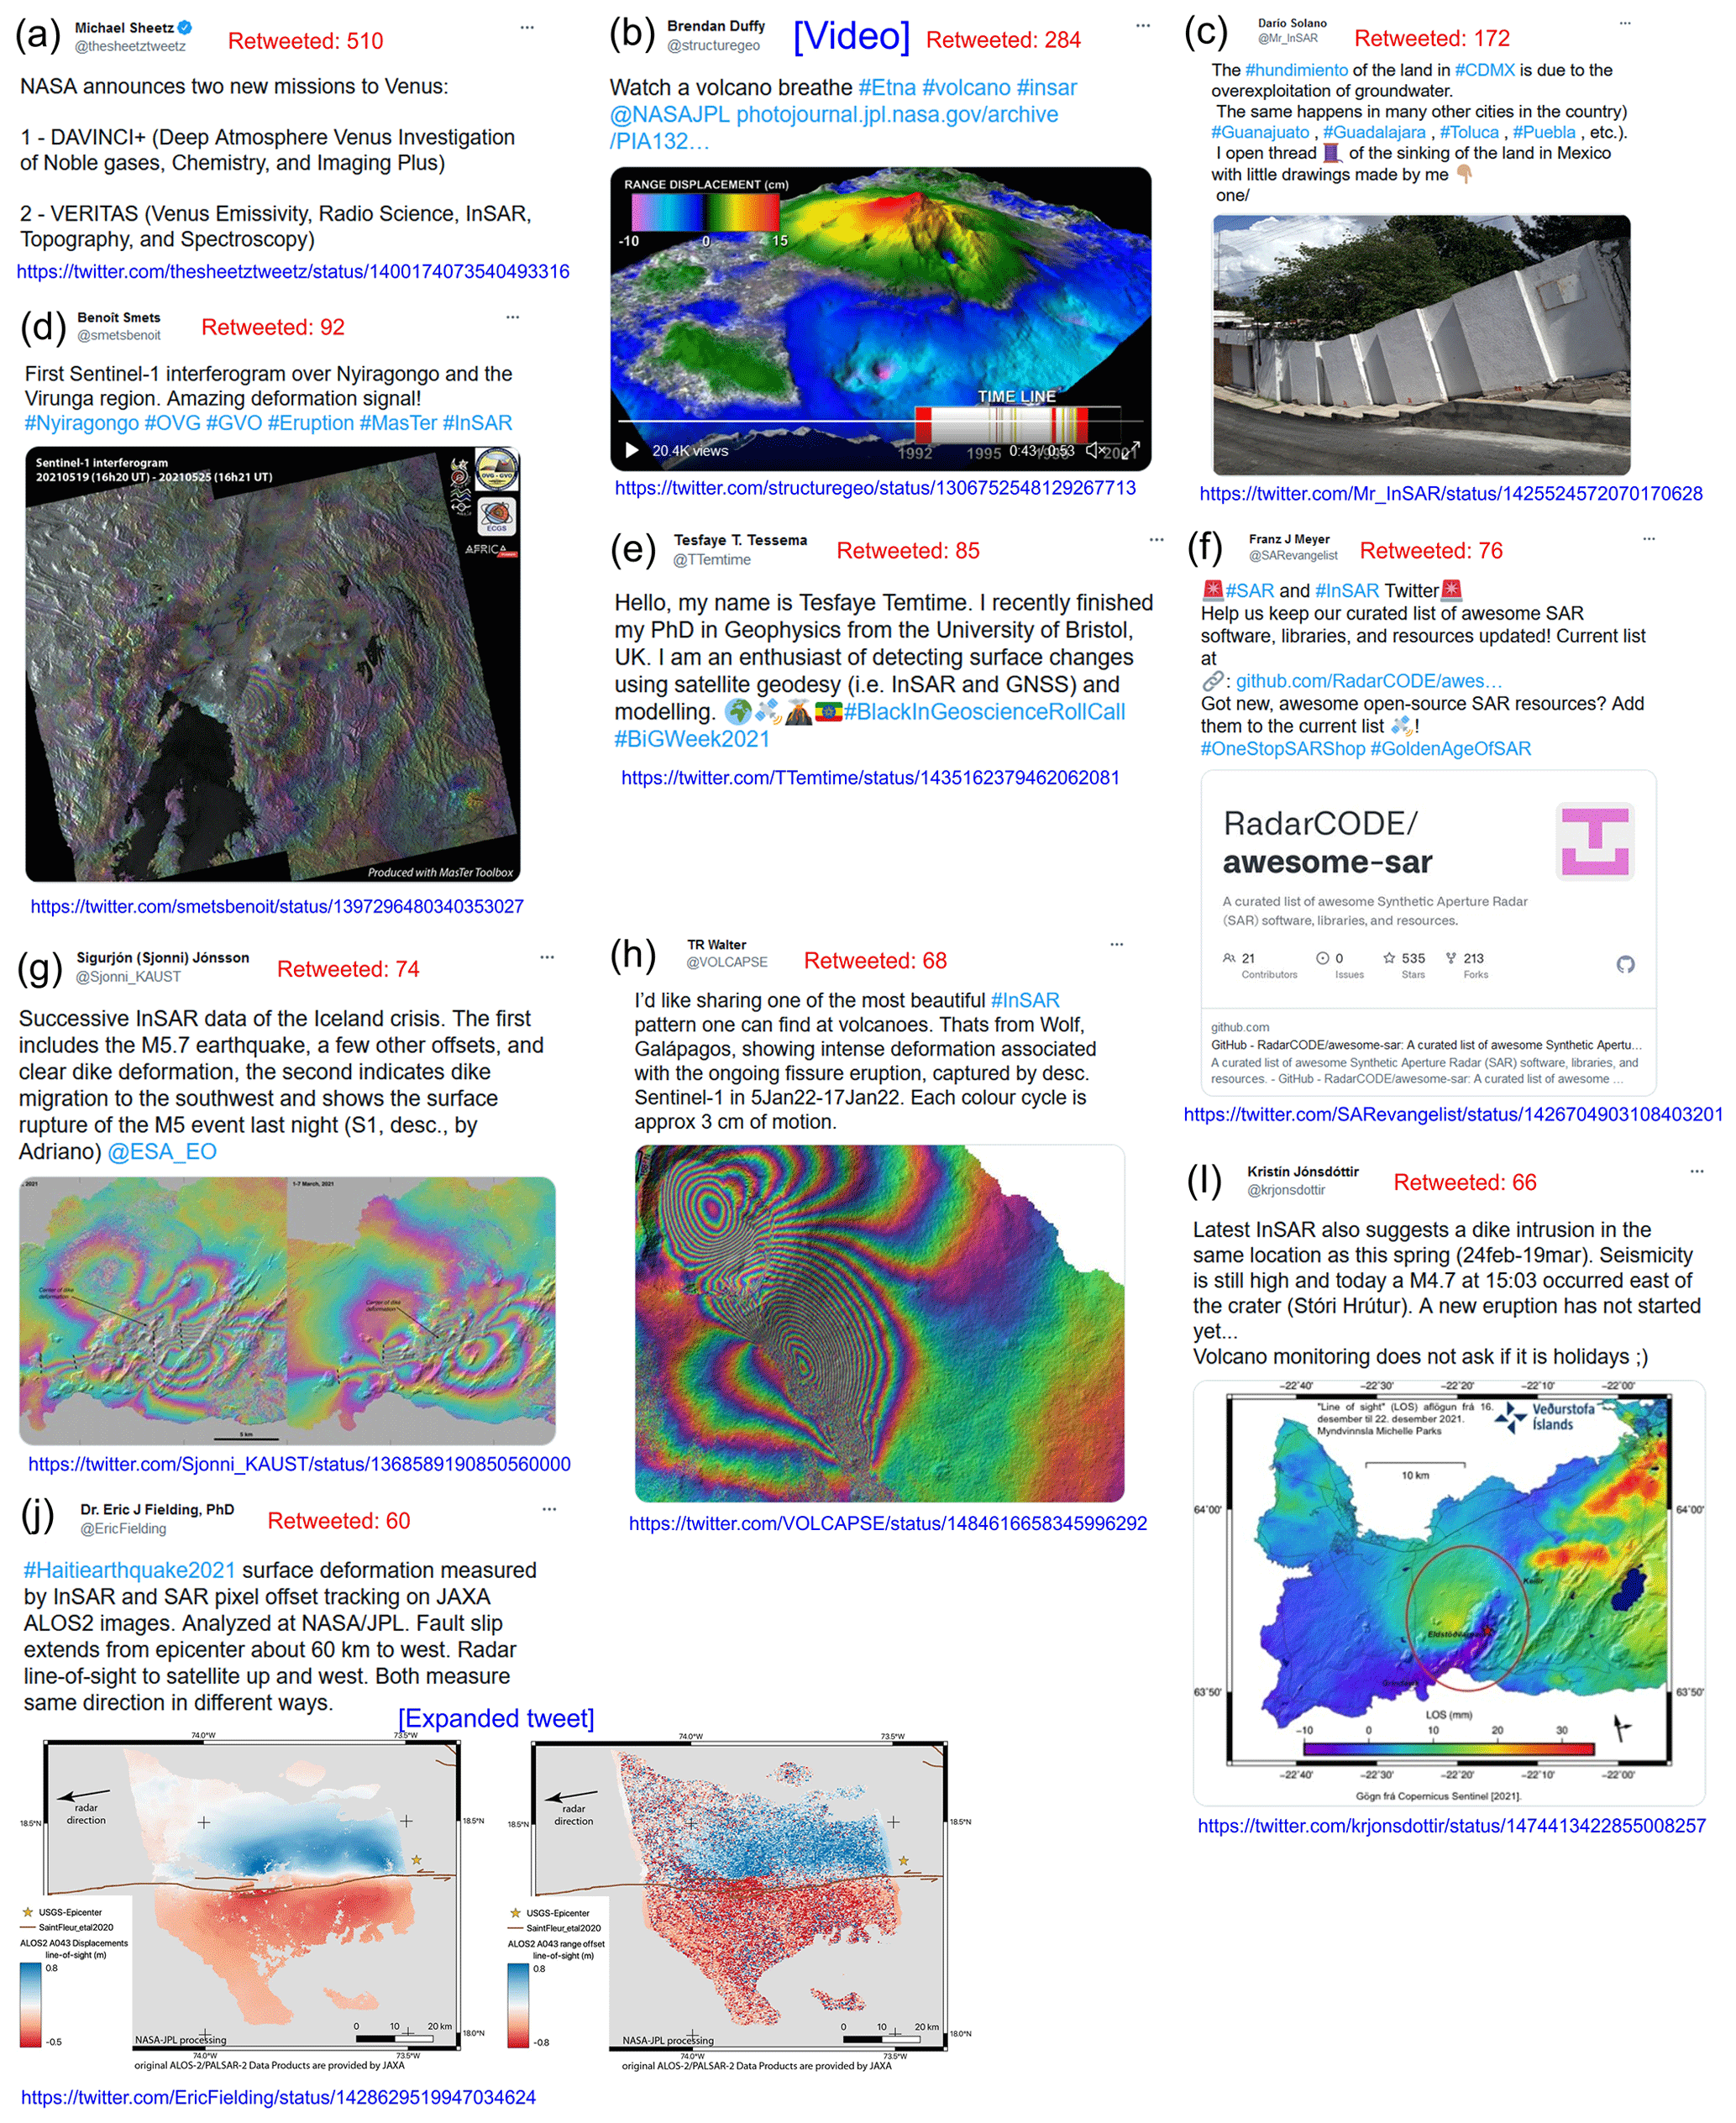
Figure 6The 10 most retweeted InSAR tweets ordered (a)–(j) (1–10). The number of times each tweet was retweeted is shown adjacent to the Twitter username in red text. (Tweet citations: (a) Michael Sheetz (@thesheetztweetz) (2021), (b) Brendan Duffy (@structuregeo) (2020), (c) Darío Solano (@Mr_InSAR) (2021), (d) Benoît Smets (@smetsbenoit (2021), (e) Tesfaye T. Tessema (@TTemtime) (2021), (f) Franz J. Meyer (@SARevangelist) (2021), (g) Sigurjón (Sjonni) Jónsson (@Sjonni_KAUST) (2021), (h) T. R. Walter (@VOLCAPSE) (2022), (i) Kristín Jónsdóttir (@krjonsdottir) (2021), and (j) Eric J. Fielding (@EricFielding) (2021)).
3.2 LiCSAR Portal
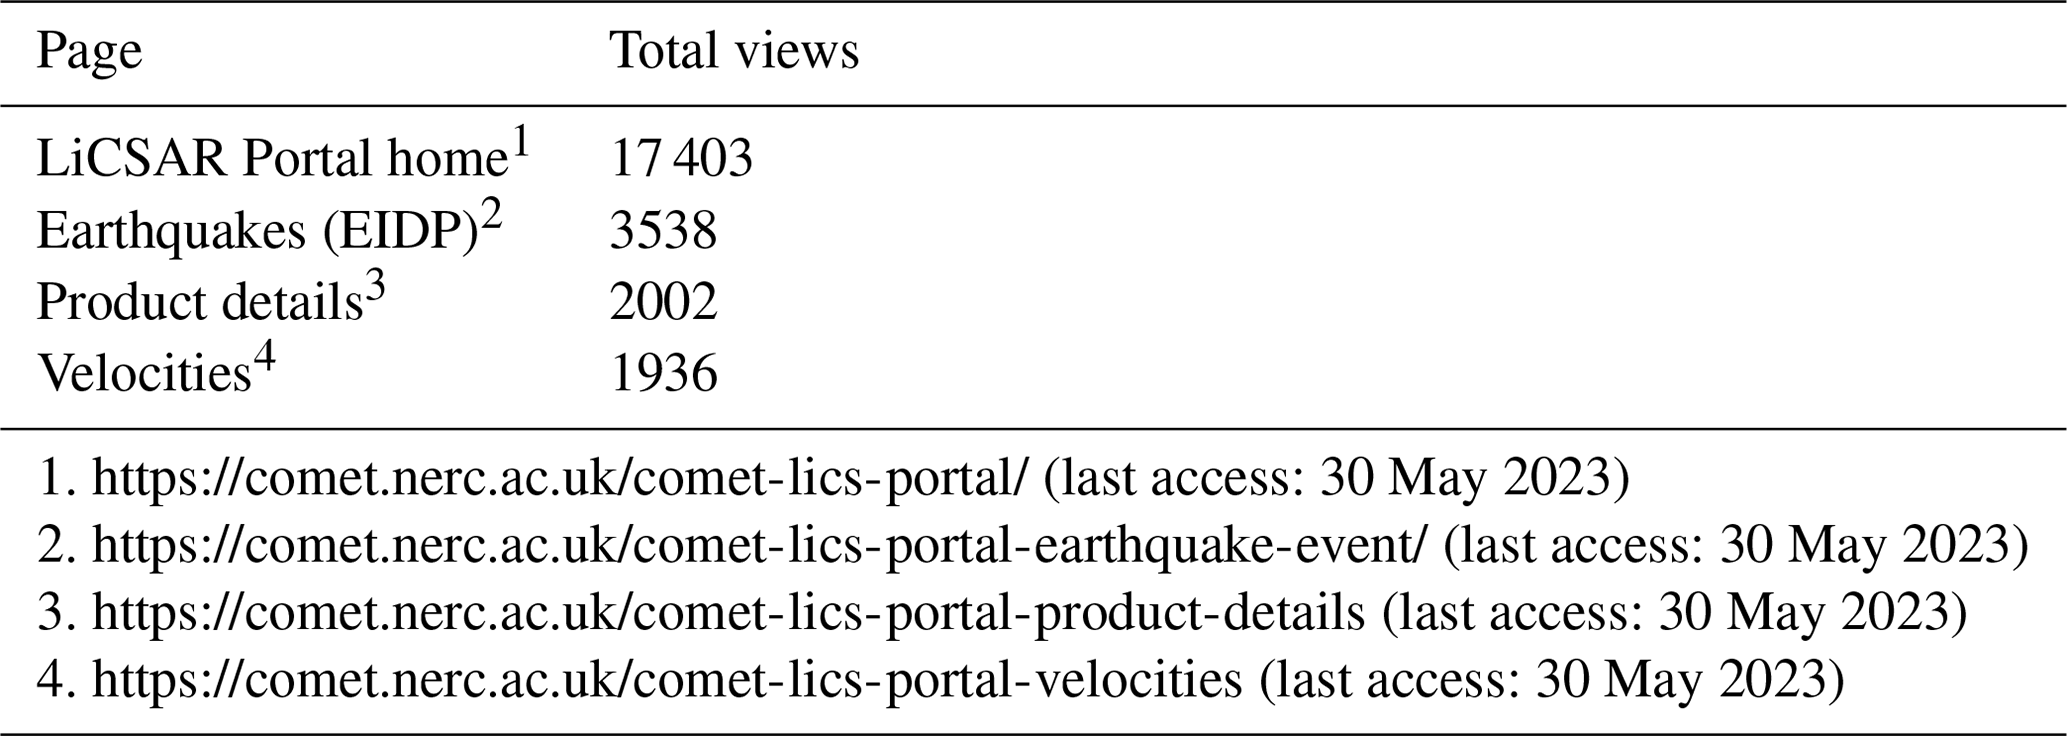
The LiCSAR Portal disseminates automatically processed Sentinel-1 InSAR data for active tectonic and volcanic regions, thereby focussing on natural hazards, including a dedicated earthquake processing system known as EIDP. User feedback provided on LiCSAR and usage statistics for LiCSAR and EIDP were used to evaluate engagement with the system and how this related to InSAR communications over Twitter. Views to the LiCSAR Portal homepage, February 2021 to February 2022 (period of the user feedback survey), totalled 17 403, with an additional 3538 views to the EIDP homepage (Table 1). Annual views increased by 4833 (2020–2021) and averaged 1148 views monthly (Fig. 7). Evaluation of the LiCSAR system was therefore expected to capture a range of users across the InSAR community.
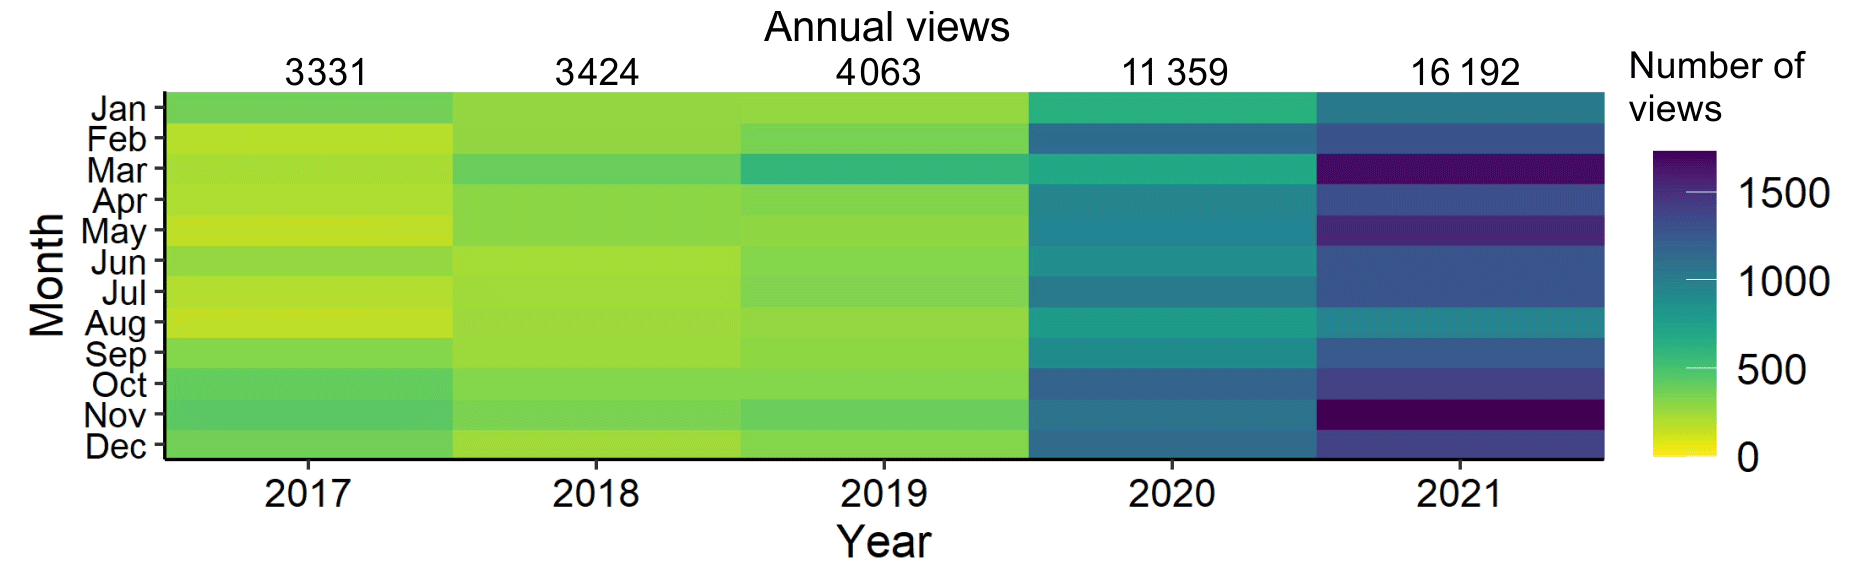
Figure 7Views of the LiCSAR Portal homepage from 2017–2021. Note that the “views” analytics switched to WordPress from 2020 (Sect. 2.2).
Table 1Select LiCSAR Portal page views, February 2021 to February 2022.
3.2.1 User feedback
User feedback on the LiCSAR Portal, February 2020 to February 2022, revealed the profession of LiCSAR users and their views on current and future InSAR products (Fig. 8). We report statistics using all responses (n=80); however, in some cases not all questions were answered by respondents. Most users (83 %, n=64) that provided feedback were not associated with COMET so were independent of the LiCSAR system. Respondents were from 29 countries and used LiCSAR data to study a total of 39 countries. Most respondents (77 %, n=72) were academic (scientific) users. Geological/geophysics survey (7 %) and public sector (6 %) were the next highest groups (Fig. 8a); however, the InSAR applications in these groups (scientific vs. non-scientific) were not known. Users predominately used unwrapped and wrapped interferograms and coherence products (Fig. 8b). We observed a broad spread in the number of interferograms used, with the majority using less than 100 interferograms and some using over 400 (Fig. 8d). Similarly, most used fewer than five data frames (individual frame IDs on the LICSAR Portal), though one used over 250 (Fig. 8e). Displacement time series, mean velocities, and subsidence or uplift rates were the most desired future products (Fig. 8c). Overall ease of access to data through the portal averaged 3.8±1.1 on a scale of (1) difficult to (5) easy, and most respondents identified a benefit to future integration of the data in a cloud-based platform such as Google Earth Engine, scoring 3.6±1.2 on a scale of (1) no benefit to (5) strong benefit.
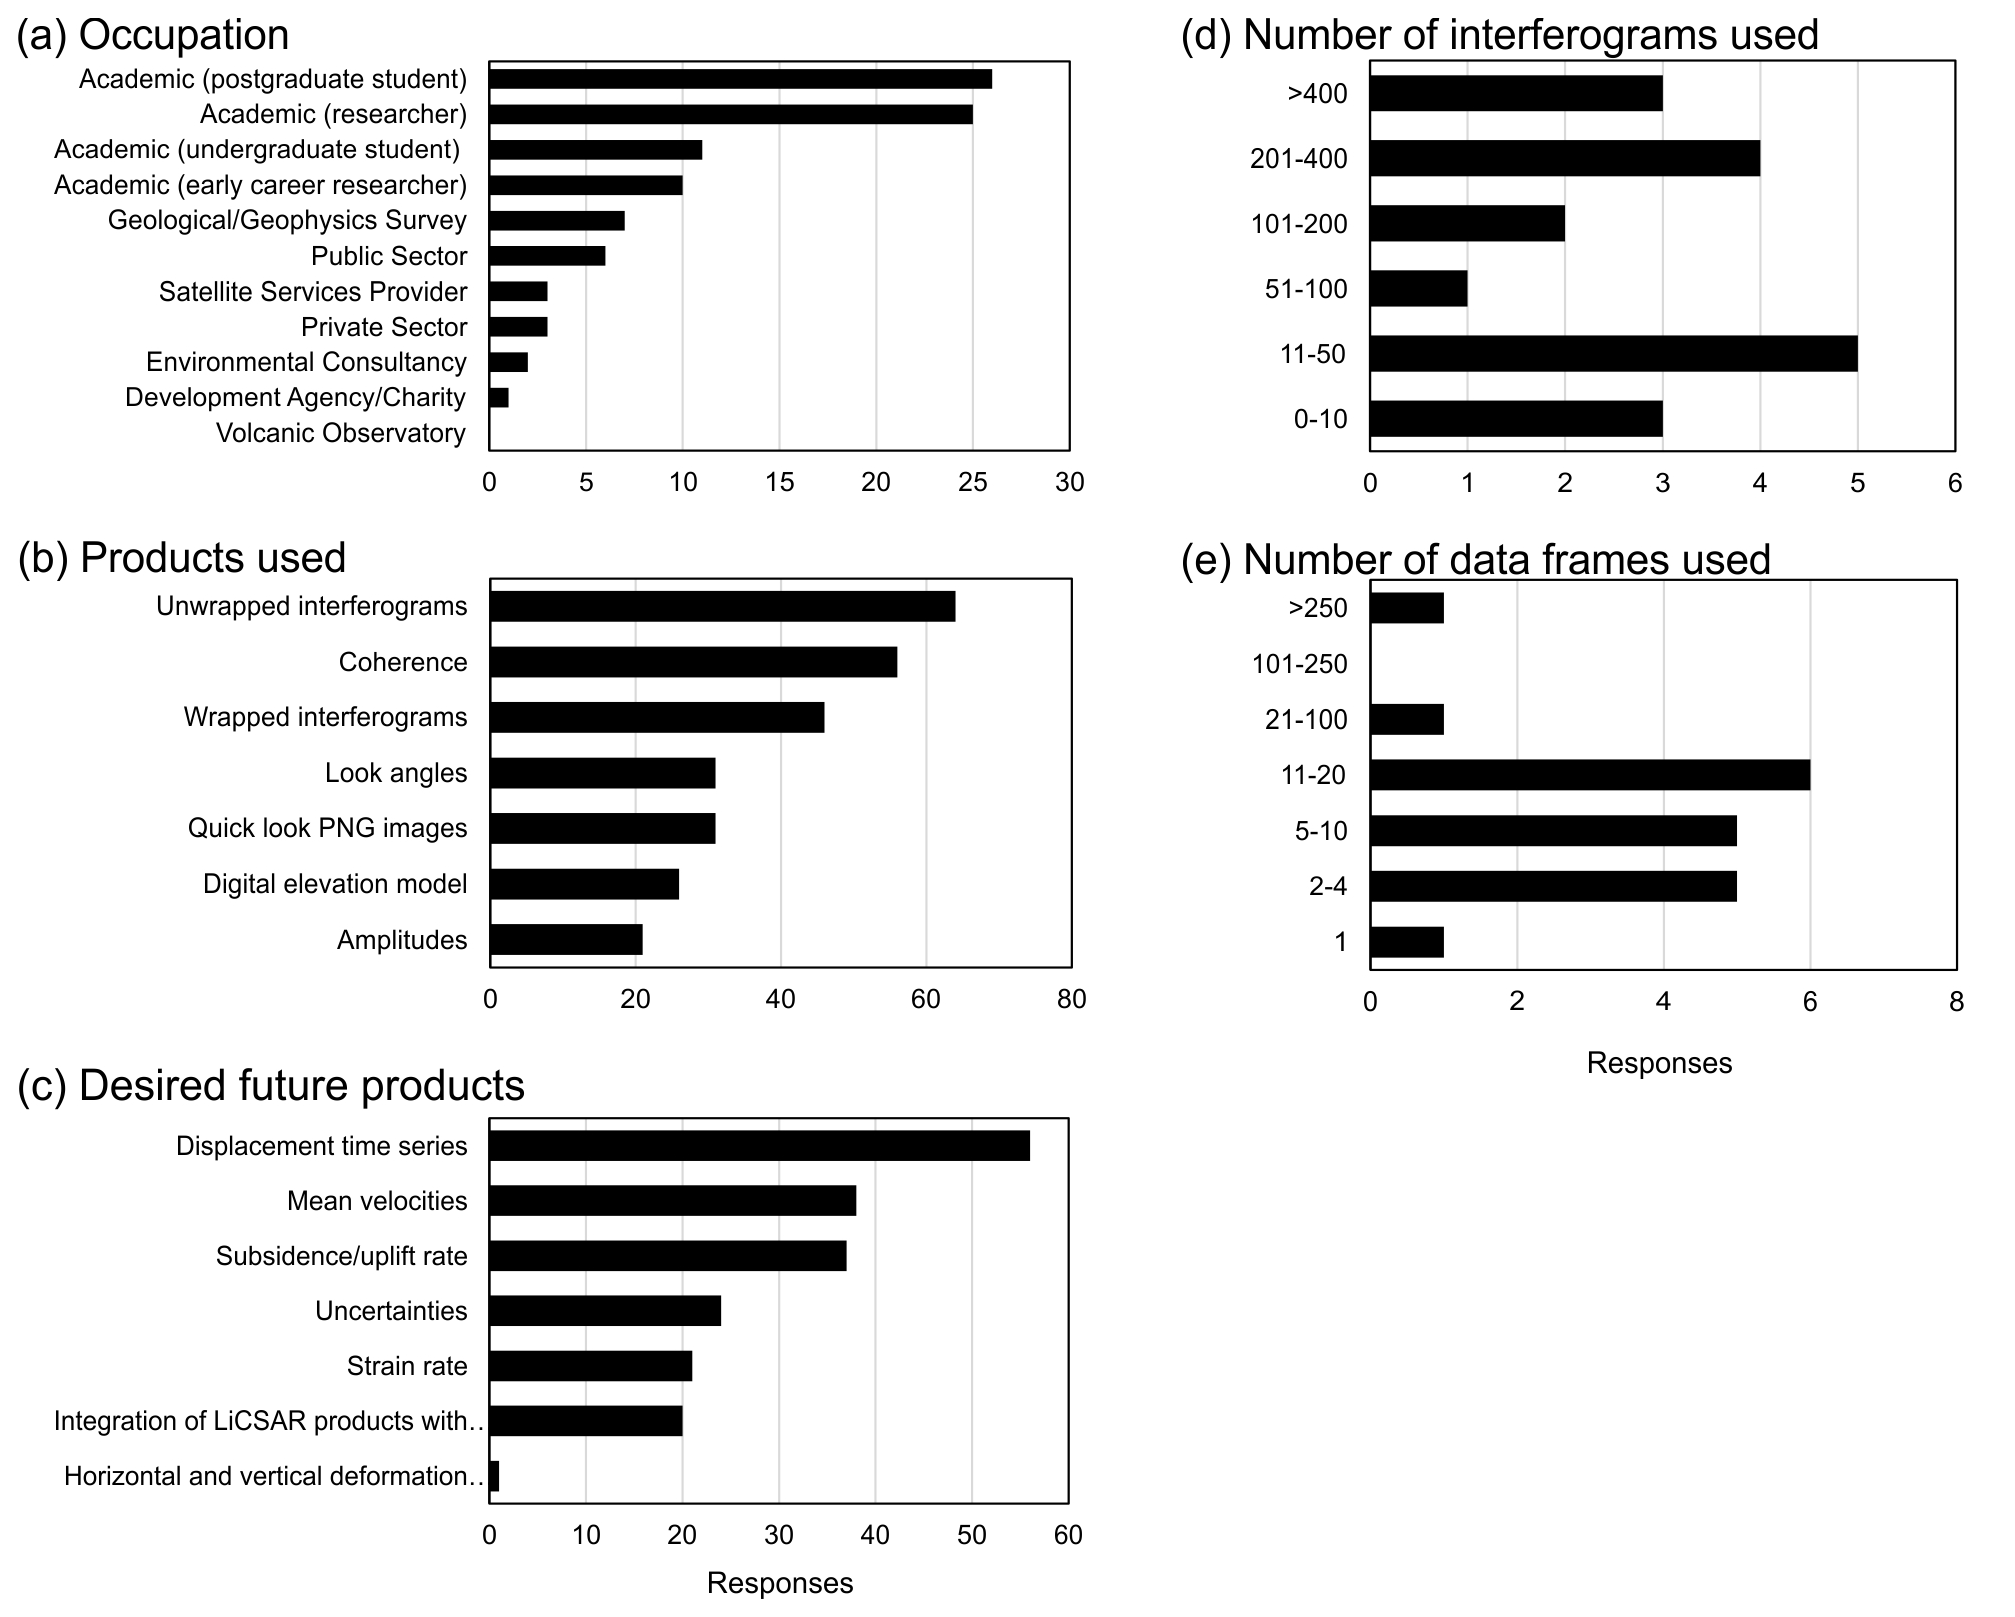
Figure 8Results from select questions in the LiCSAR data user feedback survey (February 2020 to February 2022; n=80). Additional survey results are discussed in the text.
3.2.2 Earthquake InSAR Data Provider (EIDP)
The EIDP component of the LiCSAR Portal included 430 earthquake event activations between April 2019 and February 2022. The earthquake event pages and first wrapped interferogram generated over the epicentre (Fig. 9) were automatically tweeted by @COMET_database, which featured in the top 10 InSAR tweeting accounts (Fig. 5a) and accounts for the high instance of “LiCSAR” word occurrence (n=190) in the InSAR tweets (Fig. 4a). The five most retweeted EIDP interferograms all displayed a clear earthquake signal, shown by the colour fringe cycles and black arrow (Fig. 10a). Three of these interferograms corresponded to earthquakes that were associated with peaks in tweet activity identified in Fig. 3 (China, 21 May 2021; Croatia, 29 December 2020; and Greece, 3 March 2021). EIDP tweets co-seismic interferograms regardless of the presence of a deformation signal, and five examples with no earthquake signal are shown in Fig. 10b, all of which were only retweeted once.
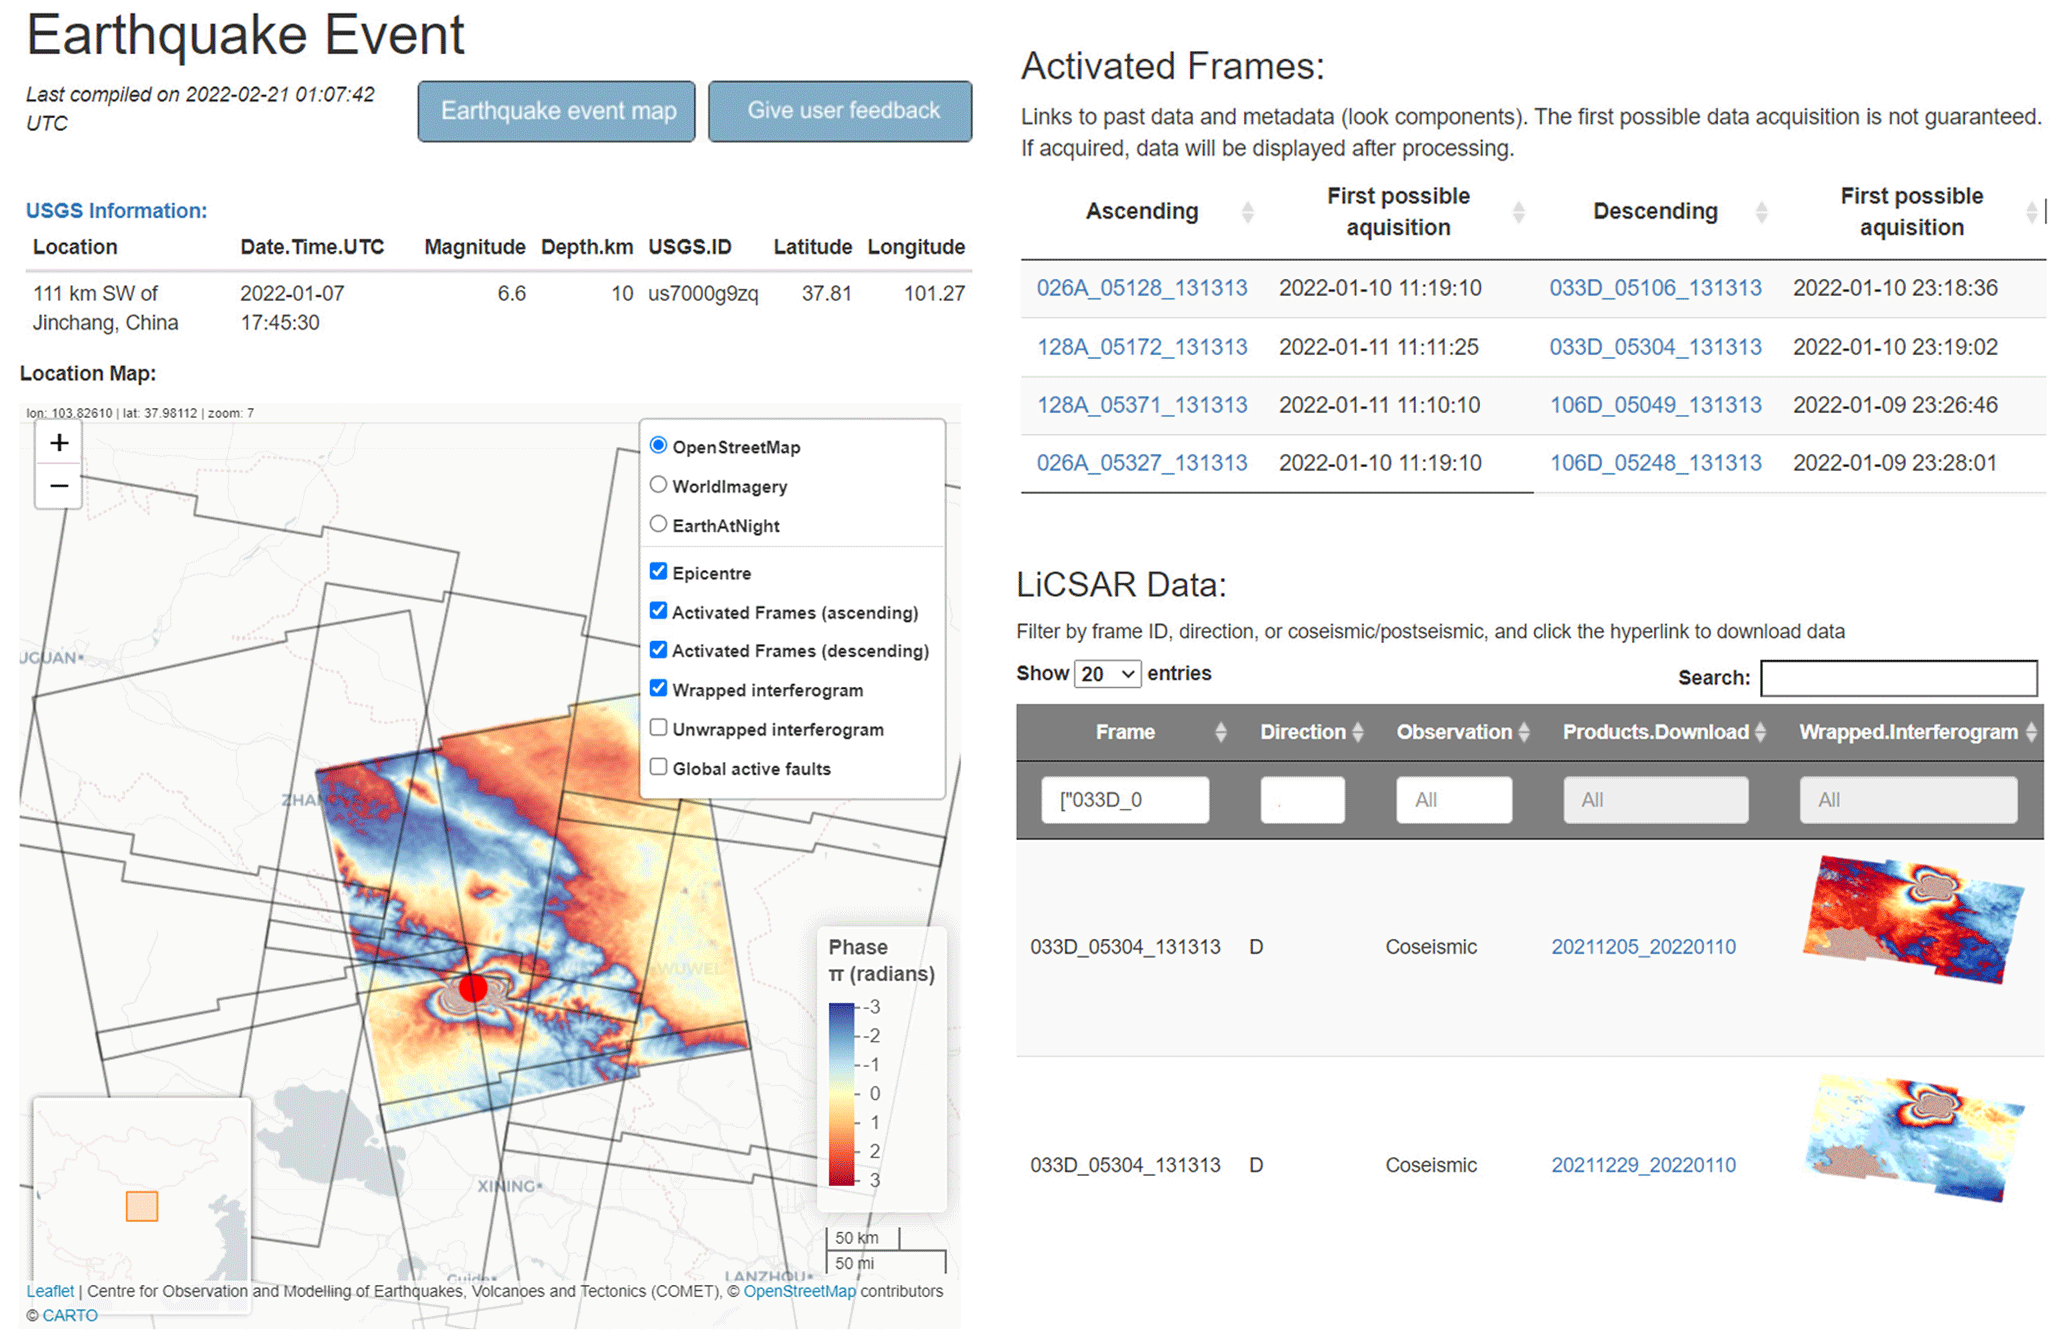
Figure 9Earthquake event data showing USGS earthquake parameters, and an interactive map showing activated frames, the first available interferogram data, and the option to overlay a fault map and change the basemap layers. All processed data are collated for each event in a searchable data table below the map. Earthquake event pages are available at https://comet.nerc.ac.uk/comet-lics-portal-earthquake-event/ (last access: 30 May 2023).
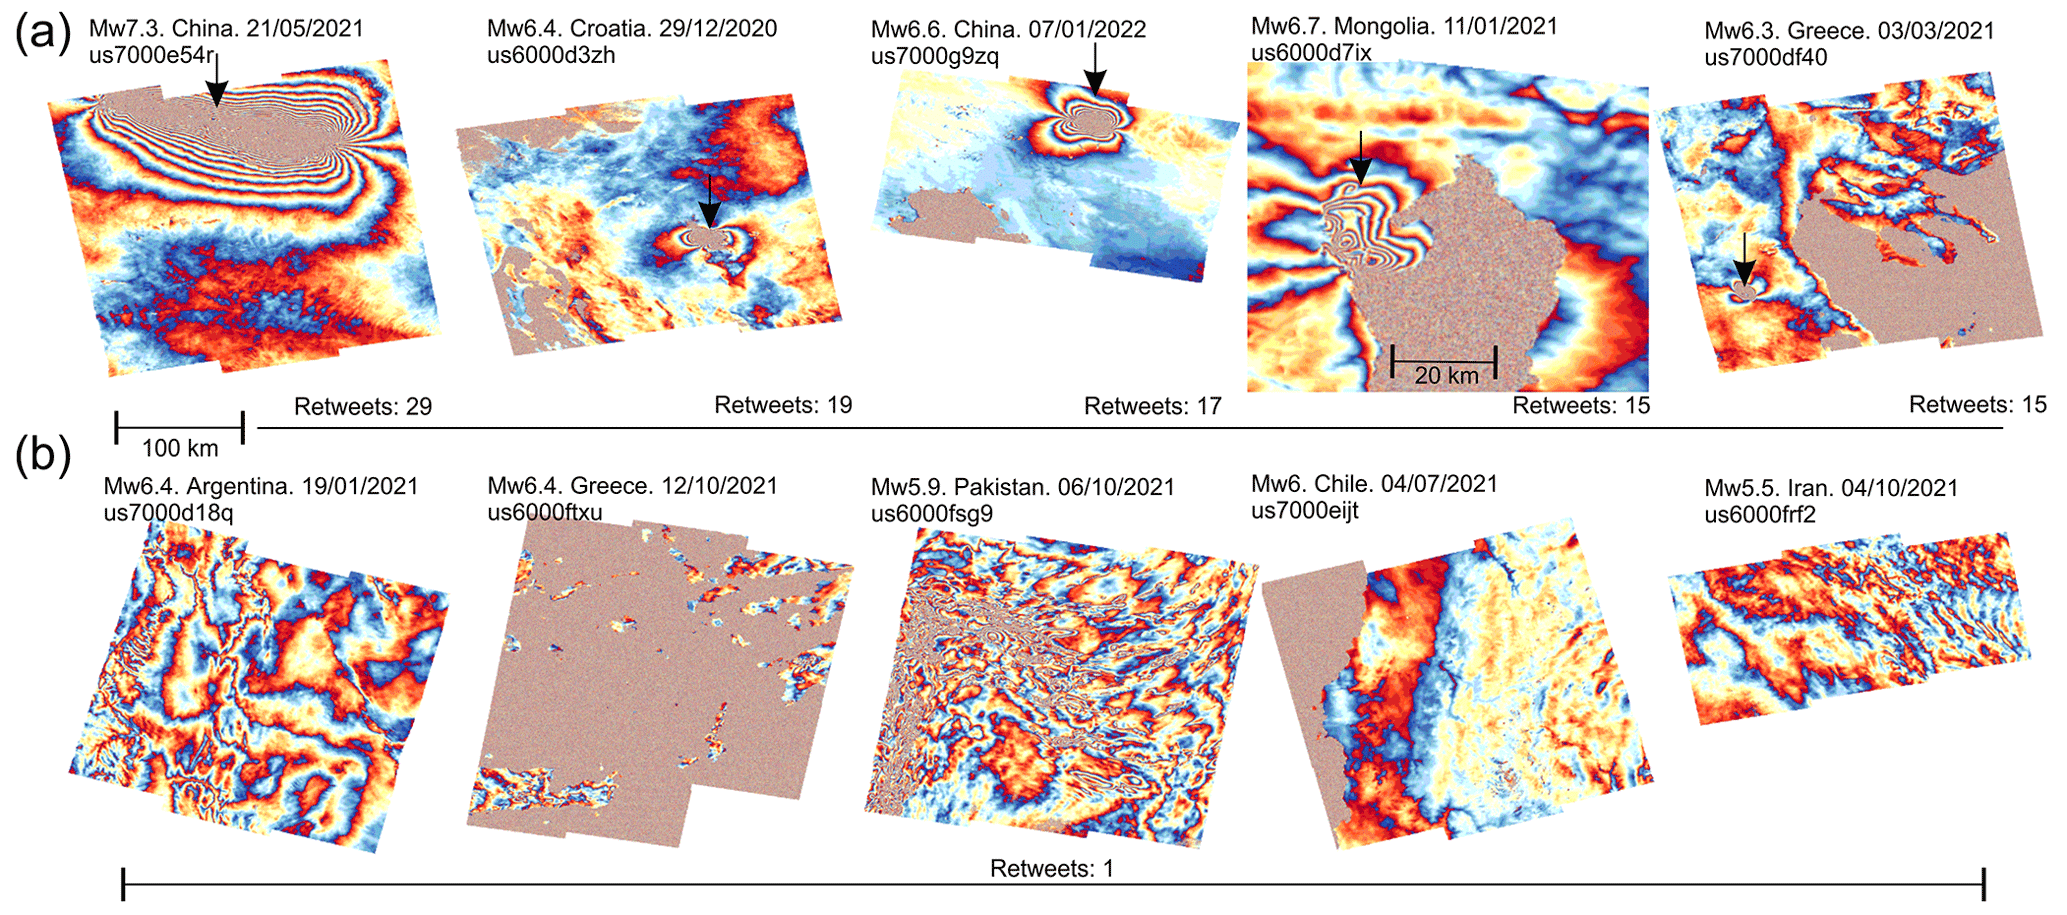
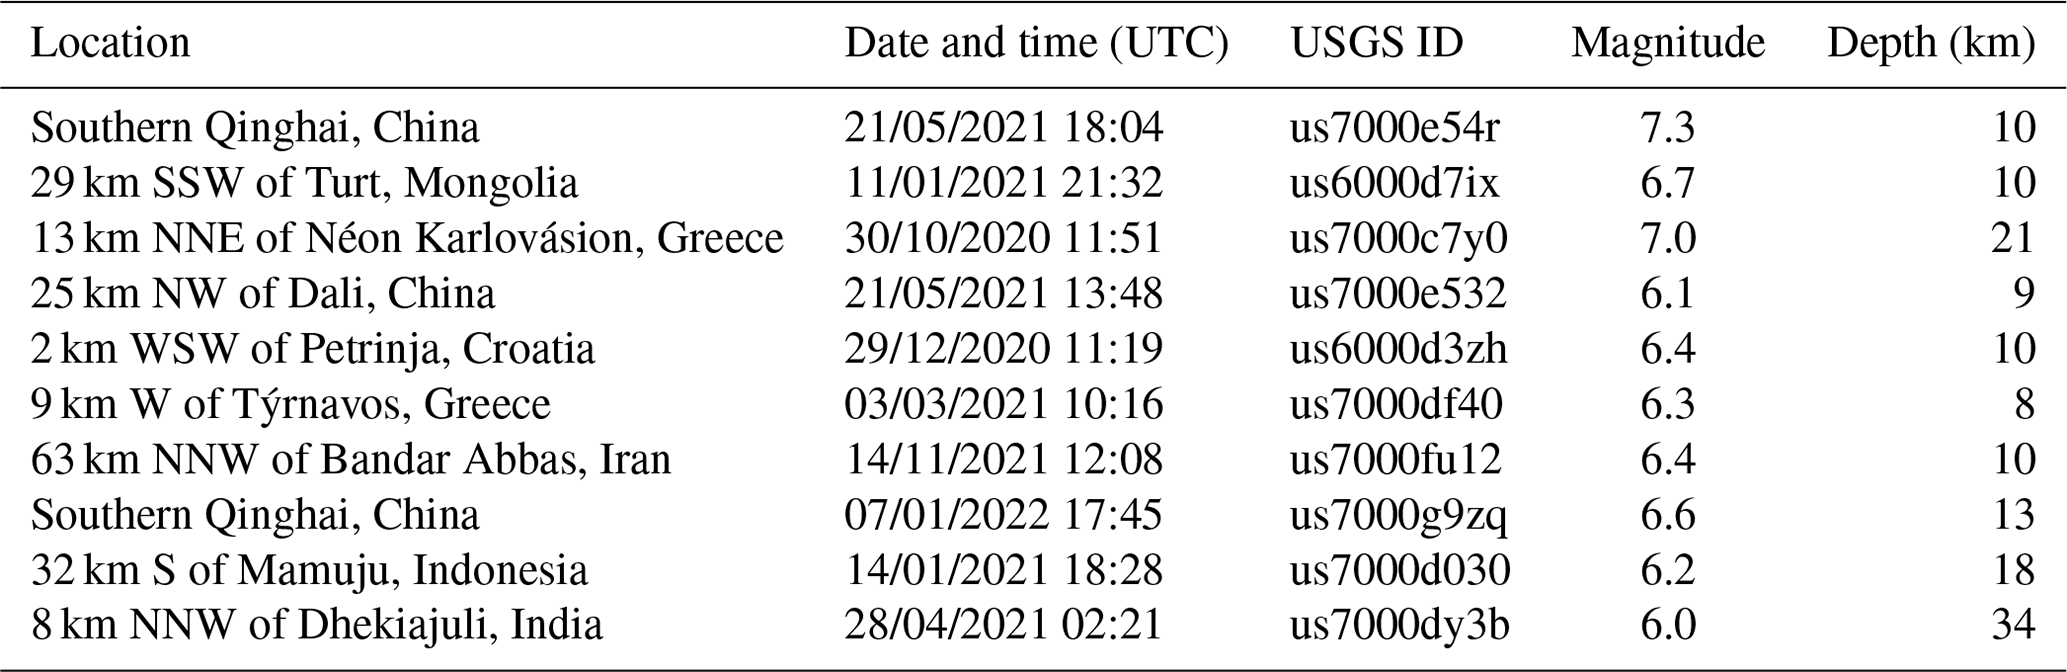
Figure 10Examples of wrapped interferograms tweeted for earthquake events (magnitude, date, and USGS ID are annotated) by @COMET_database, including the five most retweeted interferograms (a) with the earthquake signal annotated with the arrow, and five interferograms without an easily identifiable earthquake signal (b). Note that the 100 km scale bar is applicable to all panels except the Mongolia earthquake (us6000d7ix). Colour cycle fringes represent 2.8 cm of motion per cycle towards or away from the satellite.
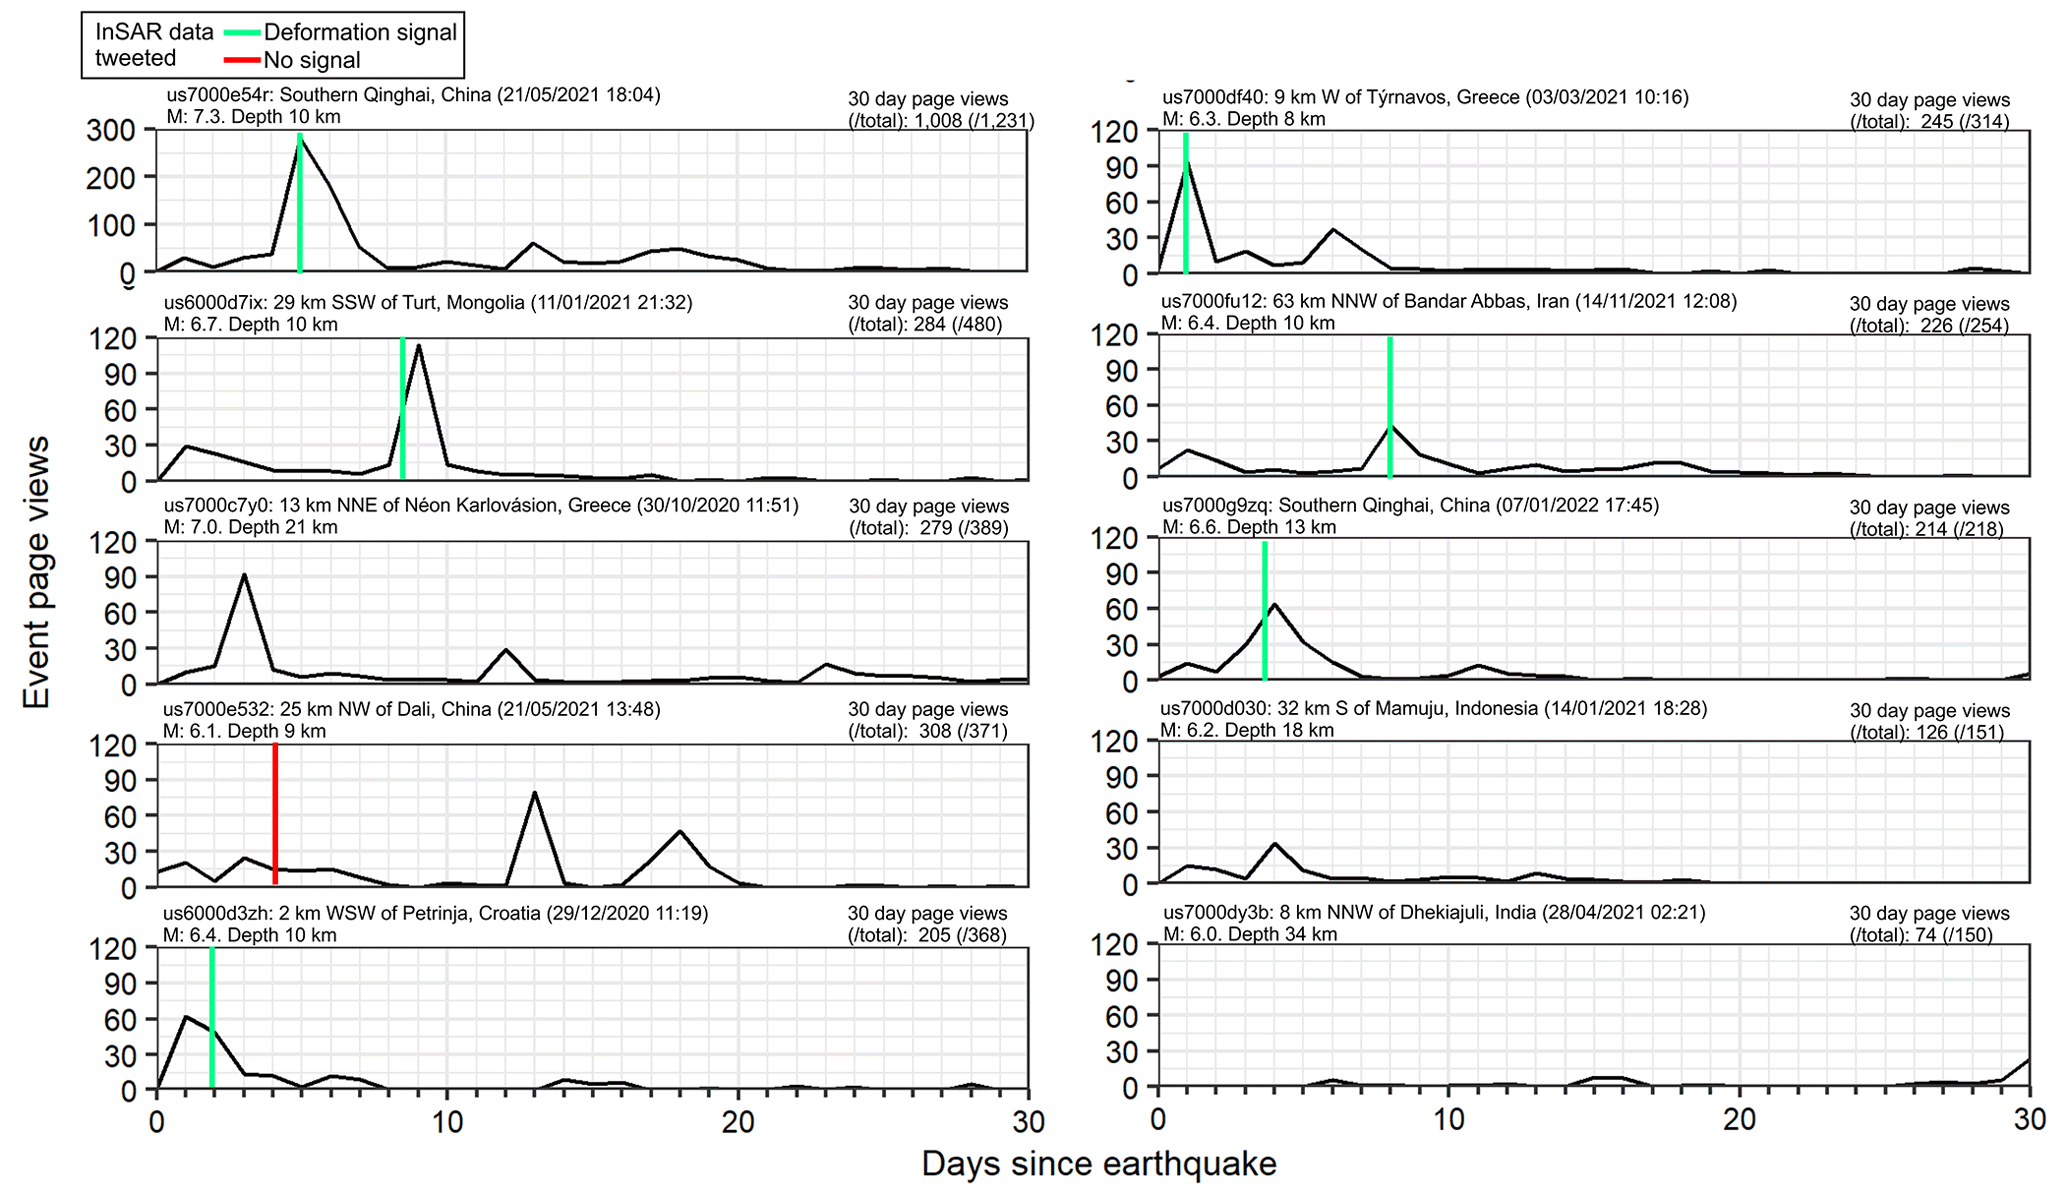
Figure 11Event page views for the 10 most viewed earthquakes (Table 4). Vertical line shows the date that LiCSAR InSAR data were tweeted where applicable. Note y axis change for the 2021 southern Qinghai, China event (us7000e54r).
We evaluated the engagement with EIDP using page views logged through Google Analytics for events that occurred during our Twitter data collection (18 August 2020 to 9 February 2022). Users accessed EIDP webpages directly (n=1232), through social media (n=736), through referrals (linked from another website) (n=263), and through organic searches (n=76). Twitter accounted for 98 % of social media access to EIDP with the remainder from Facebook. The page view time series for the 10 most viewed events revealed a peak in page views associated with Sentinel-1 InSAR data tweets from @COMET_database for events with a deformation signal (n=6) (Fig. 11). Three events did not have an associated data tweet, and one had no deformation signal. The mean time between an earthquake and subsequent tweeting of InSAR data was 4.7±2.8 d, with the shortest gap being 1 d for the 2021 Mw 6.3 earthquake “us7000df40” in Týrnavos, Greece (Table 2). The five most retweeted interferograms (Fig. 10a) were amongst the most viewed EIDP event pages, of which the Mw 7.3 earthquake in southern Qinghai, China (21 May 2021, us7000e54r) had the most page views (n=1231) (Fig. 11, Table 2).
Table 2Characteristics of the 10 most viewed EIDP earthquake event pages, ordered by number of views (Fig. 11). Earthquake details were obtained from the USGS (https://earthquake.usgs.gov/, last access: 30 May 2023) on 4 April 2022.
3.2.3 Engagement with the COMET Volcano Deformation Portal
Although we did not have usage statistics for the COMET Volcano Deformation Portal in this study, we considered barriers to the use of InSAR data by volcano observatories from 10 respondents to a short questionnaire summarized in Table S4. All agreed that ready-processed and analysed data were beneficial to their operations, improving their monitoring capacity. They would use such data to inform their deployment of ground-based monitoring instrumentation and to alert the necessary authorities of unrest. The responses identified that automated tools must be accessible without the need for high-speed internet or advanced computing facilities and that data need to be delivered in a timely manner, and support would be required to ensure proper understanding. Though ready-analysed data are desirable, the responders also stated that they would like training to accompany these resources, so they have a good understanding of the outputs and the processes leading to these outputs.
Following the open-access availability of SAR data acquired by the Sentinel-1 satellites (adopted for the Copernicus programme by the EU), and a transition towards open-source processing techniques, we aimed to evaluate the applications and engagement with InSAR products that are communicated online outside of traditional scientific publication outputs. First, we analysed InSAR geoscience communication through Twitter to determine the types of outputs communicated (e.g. text, images, and videos), their data sources (e.g. Sentinel-1), geoscience applications (e.g. earthquakes and volcanoes), and level of user engagement. We then used our experience with the LiCSAR Sentinel-1 InSAR processing system to determine the extent to which this open-access data provision aligned with Twitter InSAR communications.
4.1 InSAR Twitter
InSAR Twitter content was primarily aligned with natural hazards and disaster event response. However, peaks in Twitter activity were also associated with academic conferences (American Geophysical Union (AGU) and European Geosciences Union (EGU)), four earthquake events, news articles, and Twitter threads (one on subsidence and one on earthquake seasonality) (Fig. 3). Analysis of the most commonly occurring words in the InSAR tweets revealed that InSAR was most associated with earthquake deformation (Fig. 4a, b), likely reflecting the newsworthy status of these events drawing user engagement (e.g. Zawacki et al., 2022). In addition to earthquakes, applications of InSAR to volcanic deformation was also prevalent in our analysis, particularly in the most retweeted InSAR tweets. Words such as “dike”, “eruption”, “volcano”, and “magma” were present alongside specific events such as the volcano–tectonic events that occurred around the Icelandic Fagradalsfjall volcano on the “Reykjanes” Peninsula and the “Nyiragongo” eruption in the Democratic Republic of the Congo (Fig. 4b). Wrapped interferograms of these events were in the top 10 most retweeted tweets (Fig. 6).
Our analysis of InSAR tweets reflects a prevalence of Sentinel-1 data usage as both the most commonly occurring hashtag (Fig. S2) and use as the data source in four of the top 10 most retweeted InSAR tweets (Fig. 6). The Sentinel-1 series comprised a pair of SAR satellites (Sentinel-1A launched in 2014 and Sentinel-1B in 2016, the latter of which malfunctioned in December 2021), which provided a step change in provision and development of processing tools for open-access radar data (Geudtner et al., 2014; Elliott, 2020). For LiCSAR data, we observed greater retweeting of interferograms displaying an earthquake deformation signal compared to those without (Fig. 10), suggesting a degree of collaborative information filtering to amplify the presence of a positive detection. This aligns with other studies that found that Twitter can facilitate rapid knowledge co-production that receives transparent, though unconventional, peer review through public Twitter discussions (Lacassin et al., 2020; Mendoza et al., 2010). Similarly, we found that scientists accounted for 38 % of users within our defined Twitter InSAR network, though many of the non-scientist grouping likely represented earth observation experts in other applications, including commercial industries. Whilst there is no guarantee that this network of users acts to positively filter InSAR data, for example, to mitigate common challenges such as misinterpretations of atmospheric effects as a deformation signal (for which we show a tweeted example relating to Agung Volcano in Fig. S3), other studies have shown that Twitter has been a useful platform for geoscience discussions and collating information on natural hazard events (Lacassin et al., 2020; Shugar et al., 2021; Ruan et al., 2022).
4.2 LiCSAR data dissemination
The availability of open-access Sentinel-1 data has led to the development of semi or fully automated processing systems to produce InSAR information from the vast amount of data acquired each day. Scientific systems are largely focused on geohazards (e.g. Lazecký et al., 2020; Kennedy et al., 2021; Galve et al., 2017; Piter et al., 2021), whereas commercial systems cover a diverse range of applications including monitoring subsidence, mining activities, engineering projects, and geohazards. Two commercial systems using Sentinel-1 and other data sources (@TRE_ALTAMIRA and @SatSenseLtd) were identified in the top tweeters InSAR network (Fig. 5a). Open-access LiCSAR data were disseminated through an online portal, and @COMET_database was also a top 10 tweeter of InSAR data, specifically through automatic tweets of co-seismic earthquake interferograms (Fig. 10). LiCSAR InSAR data have been used in studies of earthquakes (Ganas et al., 2018), ground deformation (Morishita et al., 2020; Weiss et al., 2020; Chaabani et al., 2020), volcano deformation including machine learning of deformation patterns (Moore et al., 2019; Anantrasirichai et al., 2018; Lloyd et al., 2018; Gaddes et al., 2018; Albino et al., 2019), and landslides (Burrows et al., 2019; Tsironi et al., 2022). The primary link to data dissemination through Twitter was from the EIDP system that generates interactive web pages, processes interferograms, and automatically tweets the outputs (Figs. 9, 10, 11), thereby providing a resource for preliminary interpretation and data download. Although LiCSAR data did not feature in the most retweeted InSAR content (Fig. 6), the underlying data products in these tweets (wrapped and unwrapped interferograms) were the same as those generated by LiCSAR, and these automatic tweets were associated with directing views to earthquake event pages (Fig. 11). The most retweeted tweets generally featured supplementary data annotations and text explanations of the observed deformation signals, which are not a feature of the automated LiCSAR data dissemination. Similarly, 30 % (n=24) of the LiCSAR survey respondents identified uncertainties as a useful future product (Fig. 8c), which would ideally be disseminated in parallel to other outputs to reduce misinterpretation of interferogram fringes, for example, that are often related to atmospheric or topographic effects (Zhou et al., 2009).
4.2.1 Application of tailored online tools – the COMET Volcano Portal
Despite the prevalence of volcanic InSAR tweets (e.g. Fig. 6), no responses were recorded from volcano observatories in the LiCSAR user survey (Fig. 8a). This may be in part because presentation of the COMET Volcano Portal thus far has been focused on targeted workshops (e.g. “Online International Workshop on Volcano Monitoring Infrastructure on the Ground and In Space”, 18, 19, and 22 February 2021, and the annual COMET InSAR Training Workshop) rather than social media. It may also reflect a preference of volcano-focussed users to engage with the volcano portal tools rather than downloading LiCSAR imagery.
We considered potential barriers to uptake of InSAR data for volcanic applications to inform the portal development. These barriers can be grouped into two broad classes, the first relating to the awareness of data availability and confidence in interpreting the data, the second relating to logistical challenges such as the human and computing resources required to process satellite data and challenges associated with internet bandwidth (Table S4). Similar natural hazard information accessibility and usability issues were summarized by Gill et al. (2021). The COMET Volcano Portal minimizes logistical issues by providing access to ready-processed InSAR. Data are downsampled and clipped to the area of interest for individual volcanoes such that the time series data are served over a standard web browser in small file sizes (typically several megabytes). Dealing with the second barrier of data awareness and confidence requires an approach incorporating a communication strategy. This could include tweeting examples of portal content and promoting the portal at conferences and through local observatory networks, also considering other forms of social-media communication. We consider regular communication of volcano portal updates to be a better strategy than automatic direct social media responses to eruptions or unrest, due to the potential for eclipsing or distracting from the official communications from local volcano observatories and civil protection. We also consider further direct engagement with volcano observatory scientists to be critical, both for making the portal as applicable and transparent in its operation as possible, and to provide comparisons between the InSAR processing and ground truthing measures. These are also aided by engagement with international initiatives such as the CEOS Volcano Pilot/Demonstrator (Pritchard et al., 2018) or the Global Volcano Monitoring Infrastructure Database (GVMID). Portal developments will focus on mitigation of “fading signal” in long-term time series and establishing near real-time processing that functions globally. The provision of machine learning tools will also be developed to incorporate a variety of complementary methods.
4.3 InSAR communications and disaster risk reduction
Overall, InSAR Twitter was orientated towards natural hazards and specifically disaster or event response, rather than preparedness or disaster risk reduction, which reflects the current affairs nature of the Twitter platform (Petrovic et al., 2013; Murthy, 2011; Acar and Muraki, 2011). Here, InSAR contributes top-down situational awareness to these natural hazard events, usually through providing satellite observations of ground deformation (e.g. Figs. 6, 10a), in some cases on interactive maps that could be used alongside “on the ground” mapping (Fig. 9). By comparison, bottom-up aggregation and analysis of “on the ground” crisis-communication tweets are shown to be effective at identifying the immediate aftermath of events such as earthquakes and providing the first accounts of impacts (Vieweg et al., 2010; Acar and Muraki, 2011; Earle et al., 2011). We found that peaks in InSAR tweets corresponded to earthquakes (Fig. 3) and ongoing volcanic events (Fig. 4b), where InSAR products were used to reveal the spatial patterns of deformation. For the automated @COMET_database tweets, data were acquired, processed, and tweeted within 4.7±2.8 d of the earthquake event, which may limit applicability of the data in the immediate response effort. It would therefore be useful to investigate the links between data dissemination, knowledge building over Twitter, and local event response to determine the specific applications and benefits to disaster management (Fig. 12). This is particularly relevant when considering the coupling between open-access data, derived products, related uncertainties, and quality interpretation, which are all necessary for effective communication and relates to a broader discussion on the engagement of natural hazard scientists in disaster risk reduction (e.g. Gill et al., 2021).
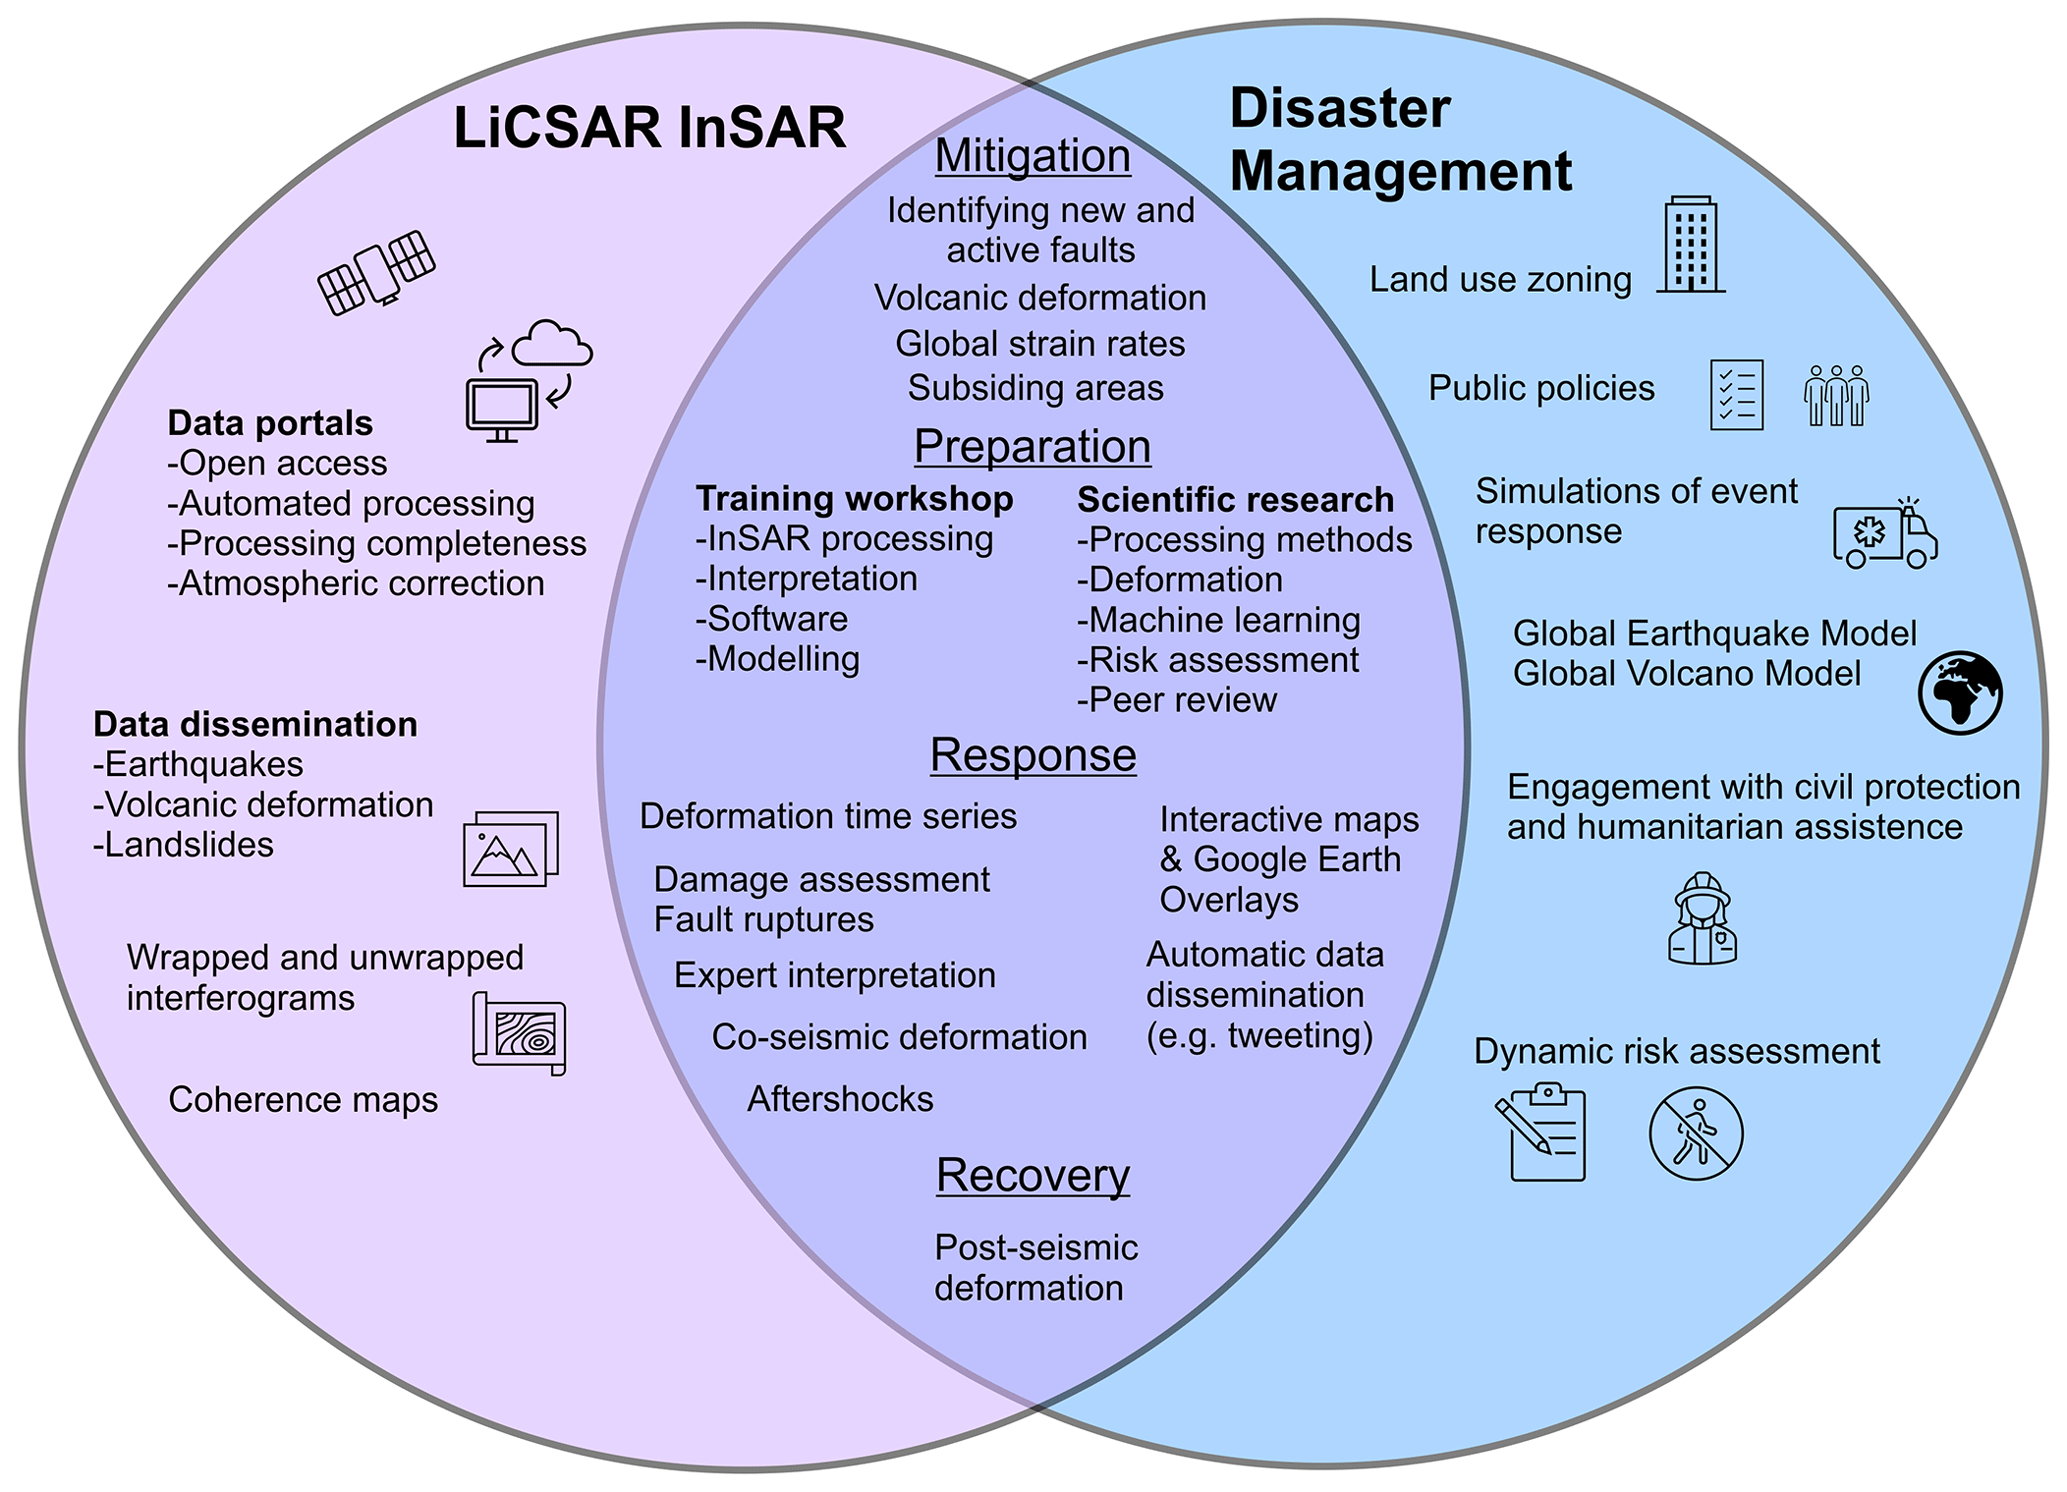
In addition to event response, we observed tweets related to longer timescale events such as ground subsidence (e.g. Fig. 6c). Explanatory Twitter threads are effective means of knowledge building and dissemination (Lacassin et al., 2020) and could therefore be used to incorporate InSAR analysis into the broader and longer-term disaster management cycle including reduction, readiness, response, and recovery (Elliott, 2020; Joyce et al., 2009) (Fig. 12). Twitter threads unrelated to disaster events, for example on long-term measurements of active faults, offer a mechanism to balance the current focus on post-disaster response applications and media reporting, which increasingly embed Twitter threads within their news articles and therefore increase public exposure (Broersma and Graham, 2013).
Pre-processed and open-access InSAR data such as produced by LiCSAR could support disaster risk-reduction strategies, for example through long-term strain rate mapping over active faults to improve seismic hazard assessments (Lazecký et al., 2020; Stevens and Avouac, 2021) or monitoring regions prone to landslides (Novellino et al., 2021; Rott and Nagler, 2006) or volcanoes (Ebmeier et al., 2018). Similarly, InSAR can reveal urban ground deformation (Morishita, 2021) due to groundwater extraction or the weight of a city itself (Parsons, 2021). Therefore, several opportunities exist to integrate InSAR into disaster management strategies and broader UN Sustainable Development Goals to develop sustainable cities with reduced risk from natural hazards (UNISDR, 2015; UN, 2020). Increased uptake and dissemination of InSAR data has followed the breakdown of barriers to data accessibility, including open-access data and processing chains; however, improved metadata detailing processing methods and uncertainties are still required to maximize applications of InSAR data and minimize misinterpretations due to radar data complexities. For example, evaluating apparent deformation signals alongside weather models is often essential at volcanoes to avoid incorrectly inferring a deformation signal (e.g. Fig. S3). Integration of InSAR datasets into cloud-based analysis platforms and portals such as Google Earth Engine or the European Space Agency's Geohazard Exploitation Platform could further facilitate analysis with other data sources and offers cloud computing capabilities for users lacking local resources (Gorelick et al., 2017), which is potentially advantageous for embedding InSAR data into disaster management agencies and volcano observatories (Table S4).
4.4 Limitations and other considerations
Although widely used for geoscience communications, InSAR communications over Twitter represent one social-media platform, and other platforms and dissemination routes that are more relevant to specific stakeholders could be considered. Additionally, identifying types of InSAR users was limited to profile description classification in our study, producing scientist vs. non-scientists groups that were used to infer whether communications were in-reach or outreach. However, these groupings are not exclusive and preclude a more comprehensive evaluation of how InSAR data are communicated and used by scientists, industry experts, the media, and decision makers for example. Self-reporting in feedback surveys could help address this.
Finally, ethical considerations exist despite the public nature of Twitter data and prior usage consent being given through acceptance of Twitter's terms of service (Sinnenberg et al., 2016; Gold, 2020). In our study, we collected tweets using the Twitter API and report anonymized and aggregated statistics, other than reporting on the top tweeters of InSAR data, where we believe reporting a subset of Twitter usernames does not create a risk of harm, provides recognition to active members of the Twitter InSAR community, and adds context (e.g. Lacassin et al., 2020).
4.5 Future design and dissemination of LiCSAR and InSAR products
Our analysis of InSAR communications has shown that Twitter is a valuable tool for disseminating InSAR data to scientific and other Twitter users (Fig. 5) and that current communications are predominantly focussed on natural hazard response (Figs. 3, 4). However, LiCSAR products are not produced with a real-time disaster response mandate. Therefore, improving the dissemination of LiCSAR products for use in disaster response requires links with local or national advisory agencies; for example the British Geological Survey in the UK. The type of disaster (e.g. earthquake or volcanic eruption) and event-specific sensitivities require consideration to avoid hindering response efforts and to ensure effective and ethical communication (Newhall, 1999). Since ongoing hazard events have specific contexts and require local considerations beyond the scope of COMET LiCSAR, data dissemination is best channelled to organizations that can effectively use the InSAR data and link with civil protection agencies. This could involve additional signposting of data portals (e.g. EIDP; Fig. 9) and provision of guidance text and flowchart diagrams for data interpretation. Longer-term integration of InSAR data into disaster mitigation (Fig. 12) could also benefit from expert-led Twitter threads discussing and demonstrating the capabilities and limitations of InSAR for specific applications.
Communication of uncertainties in LiCSAR InSAR data is currently lacking and was noted as a desired future product in a user survey (Fig. 8c). Data processed with higher levels of corrections (e.g. atmospheric) particularly using a single methodology do not always improve the end result and could cause misinterpretations. Additionally, other spatially variable (e.g. depending on land cover) biases can accumulate in time series analysis of interferograms (Maghsoudi et al., 2022; De Zan et al., 2015). Therefore, effective communication of processing steps is required to avoid instilling a false sense of confidence in derived outputs. Higher-level processing steps require waiting for the necessary correction data and further processing time, which may delay use of the data. Therefore, there is a trade-off between data timeliness and appropriate level of processing, which is variable between hazard types and individual events. For example, there is merit in producing interferograms of earthquake events with a large deformation signal before atmospheric corrections (Fig. 10a), whereas the signal for smaller or deeper events could be obscured.
We identify the following recommendations as a pathway for LiCSAR development and InSAR communications:
Recommendation (1): metadata documentation and version control of the processing steps used to derive data outputs should be provided for each LiCSAR frame. Where feasible, data should be provided at each level of processing (e.g. before and after atmospheric correction) when corrections are applied. Corresponding difference maps would also reveal the spatially variable nature of the applied corrections. Metadata are essential for consistent and reproducible analysis and to allow third-party users or organizations to derive higher-level products from InSAR datasets such as LiCSAR.
Recommendation (2): development of new and existing products should be accompanied by clear communication of the uncertainties associated with each stage of processing and guidance for interpretation. This is important for higher-level products such as time series displacement data, where unresolved uncertainties and biases may be present.
Recommendation (3): development of a protocol for generating priority LiCSAR data in response to volcanic activity, and ensuring that COMET Volcano Portal outputs are accessible to volcano observatories.
Recommendation (4): data intercomparisons with non-LICSAR processing streams and methodologies. For example, comparisons with Alaska Satellite Facility's HyP3 (Meyer et al., 2017) and the GeoHazards Exploitation Platform (Galve et al., 2017) data should be encouraged to help refine processing methodologies and quantify uncertainties.
Recommendation (5): evaluate ways to better integrate natural hazard communications across multiple platforms. For example, linking data dissemination, collaborative online knowledge building, and subsequent InSAR applications in local event response or disaster risk-reduction strategies.
In this study, we evaluated the dissemination of ground deformation measurements from InSAR through Twitter in relation to sources of open-access data. Twitter activity was primarily associated with natural hazard response, specifically following earthquakes and volcanic activity, where InSAR measurements of ground deformation were tweeted. For earthquake events in the LiCSAR EIDP system, data were acquired, processed, and tweeted within 4.7±2.8 d (the shortest was 1 d). Applications of open-access Sentinel-1 data prevailed in the InSAR tweets and were applied to volcanic and earthquake events in the most engaged-with (retweeted) content. Twitter InSAR dissemination was primarily outreach to a non-scientific audience (62 %), including industry earth observation experts. LiCSAR data were widely accessed through the online portal and disseminated following major earthquake events to reveal ground deformation. However, further work is required to integrate dissemination of InSAR data into longer-term disaster risk-reduction strategies and broader UN Sustainable Development Goals. This requires tailoring the online analysis tools that are founded on open-access data to meet a diverse range of end-user needs, including long-term monitoring of tectonic and volcanic activity that can better inform risk-reduction strategies in the context of an urbanizing global population. We presented an example of using volcano observatory user feedback to develop the COMET Volcano Deformation Portal, by considering solutions to barriers to uptake of satellite data; however, in this case we drew on a small number (n=10) of respondents, and continued feedback should be sought. We summarized future development directions using five recommendations, which included both LiCSAR development and broader InSAR communications. For example, effectively communicating uncertainties, such as a spatially distributed displacement uncertainty, or uncertainties that accumulate through processing steps including atmospheric correction, are critical to increase accessibility given the often complex interpretability of InSAR products.
The data used to support the findings and results of this study are available from the Supplement. Twitter data are publicly accessible through Twitter (https://twitter.com/, last access: 30 May 2023).
The supplement related to this article is available online at: https://doi.org/10.5194/gc-6-75-2023-supplement.
All the authors have read and agreed to the published version of the paper. CSW designed the concept with JRE and SKE. CSW performed the analysis, prepared the figures, and wrote the paper with input from all the authors. JB and SKB provided the summary information of a survey on barriers to uptake of satellite data identified by volcano observatories.
The contact author has declared that none of the authors has any competing interests.
We collected tweets using the Twitter API and report anonymized and aggregated statistics, other than reporting on the top tweeters of InSAR data, where we believe reporting a subset of Twitter usernames does not create a risk of harm, provides recognition to active members of the Twitter InSAR community, and adds context (e.g. Lacassin et al., 2020).
Publisher’s note: Copernicus Publications remains neutral with regard to jurisdictional claims in published maps and institutional affiliations.
COMET is the NERC Centre for the Observation and Modelling of Earthquakes, Volcanoes and Tectonics, a partnership between UK Universities and the British Geological Survey. LiCSAR uses JASMIN, the UK's collaborative data analysis environment (http://jasmin.ac.uk, last access: 30 May 2023). This study contains modified Copernicus Sentinel data (2015–2022). We thank Elias Lewi Teklemariam, Patricia Mothes, Pedro Espín Bedón, Marco Yépez, Marco Córdova, and Santiago Aguaiza for feedback during the development of the COMET Volcano Deformation Portal. We thank Ailsa Naismith and an anonymous reviewer for comments that helped improve this study.
This research has been supported by UK Research and Innovation (grant nos. NE/K010867/1, NE/S009000/1, and NE/R015546/1) and the Royal Society (grant no. UF150282).
This paper was edited by Solmaz Mohadjer and reviewed by Ailsa Naismith and one anonymous referee.
Acar, A. and Muraki, Y.: Twitter for crisis communication: lessons learned from Japan's tsunami disaster, International Journal of Web Based Communities, 7, 392–402, 2011.
Albino, F., Biggs, J., and Syahbana, D. K.: Dyke intrusion between neighbouring arc volcanoes responsible for 2017 pre-eruptive seismic swarm at Agung, Nat. Commun., 10, 748, https://doi.org/10.1038/s41467-019-08564-9, 2019.
Anantrasirichai, N., Biggs, J., Albino, F., Hill, P., and Bull, D.: Application of Machine Learning to Classification of Volcanic Deformation in Routinely Generated InSAR Data, J. Geophys. Res.-Sol. Ea., 123, 6592–6606, https://doi.org/10.1029/2018jb015911, 2018.
Atwood, D. K., Meyer, F., and Arendt, A.: Using L-band SAR coherence to delineate glacier extent, Can. J. Remote Sens., 36, S186–S195, https://doi.org/10.5589/m10-014, 2010.
Biggs, J. and Wright, T. J.: How satellite InSAR has grown from opportunistic science to routine monitoring over the last decade, Nat. Commun., 11, 3863, https://doi.org/10.1038/s41467-020-17587-6, 2020.
Biggs, J., Dogru, F., Dagliyar, A., Albino, F., Yip, S., Brown, S., Anantrasirichai, N., and Atıcı, G.: Baseline monitoring of volcanic regions with little recent activity: application of Sentinel-1 InSAR to Turkish volcanoes, Journal of Applied Volcanology, 10, 2, https://doi.org/10.1186/s13617-021-00102-x, 2021.
Biggs, J., Anantrasirichai, N., Albino, F., Lazecky, M., and Maghsoudi, Y.: Large-scale demonstration of machine learning for the detection of volcanic deformation in Sentinel-1 satellite imagery, B. Volcanol., 84, 100, https://doi.org/10.1007/s00445-022-01608-x, 2022.
Broersma, M. and Graham, T.: Twitter as a news source, Journalism Practice, 7, 446–464, https://doi.org/10.1080/17512786.2013.802481, 2013.
Bruneau, P., Brangbour, E., Marchand-Maillet, S., Hostache, R., Chini, M., Pelich, R.-M., Matgen, P., and Tamisier, T.: Measuring the Impact of Natural Hazards with Citizen Science: The Case of Flooded Area Estimation Using Twitter, Remote Sens.-Basel, 13, 1153, https://doi.org/10.3390/rs13061153, 2021.
Burrows, K., Walters, R. J., Milledge, D., Spaans, K., and Densmore, A. L.: A New Method for Large-Scale Landslide Classification from Satellite Radar, Remote Sens.-Basel, 11, 237, https://doi.org/10.3390/rs11030237, 2019.
Calò, F., Calcaterra, D., Iodice, A., Parise, M., and Ramondini, M.: Assessing the activity of a large landslide in southern Italy by ground-monitoring and SAR interferometric techniques, Int. J. Remote Sens., 33, 3512–3530, https://doi.org/10.1080/01431161.2011.630331, 2012.
Chaabani, C., Abdelfattah, R., and Melgani, F.: Deep Learning Approach For Post-Flood Soil Deformation Mapping Using Insar Data, 2020 Mediterranean and Middle-East Geoscience and Remote Sensing Symposium (M2GARSS), Tunis, Tunisia, 77–80, https://doi.org/10.1109/M2GARSS47143.2020.9105155, 2020.
Colesanti, C., Ferretti, A., Novali, F., Prati, C., and Rocca, F.: SAR monitoring of progressive and seasonal ground deformation using the permanent scatterers technique, IEEE T. Geosci. Remote, 41, 1685–1701, https://doi.org/10.1109/TGRS.2003.813278, 2003.
Côté, I. M., Darling, E. S., and Heard, S. B.: Scientists on Twitter: Preaching to the choir or singing from the rooftops?, FACETS, 3, 682–694, https://doi.org/10.1139/facets-2018-0002, 2018.
Directorate Space, Security and Migration, European Commission Joint Research Centre (EC JRC): Copernicus Emergency Management Service, https://emergency.copernicus.eu/, last access: 17 June 2020.
Duffy, B. [@structuregeo]: “Watch a volcano breathe #Etna #volcano #insar @NASAJPL https://photojournal.jpl.nasa.gov/archive/PIA13201_Etna_INSAR.mov”, Twitter, https://twitter.com/structuregeo/status/1306752548129267713 (last access: 13 December 2022), posted: 01:31, 18 September 2020.
De Zan, F., Zonno, M., and López-Dekker, P.: Phase Inconsistencies and Multiple Scattering in SAR Interferometry, IEEE T. Geosci. Remote, 53, 6608–6616, https://doi.org/10.1109/TGRS.2015.2444431, 2015.
Dualeh, E. W., Ebmeier, S. K., Wright, T. J., Albino, F., Naismith, A., Biggs, J., Ordoñez, P. A., Boogher, R. M., and Roca, A.: Analyzing Explosive Volcanic Deposits From Satellite-Based Radar Backscatter, Volcán de Fuego, 2018, J. Geophys. Res.-Sol. Ea., 126, e2021JB022250, https://doi.org/10.1029/2021JB022250, 2021.
Earle, P. S., Bowden, D., and Guy, M.: Twitter earthquake detection: earthquake monitoring in a social world, Ann. Geophys.-Italy, 54, 708–715, 2011.
Ebmeier, S. K., Andrews, B. J., Araya, M. C., Arnold, D. W. D., Biggs, J., Cooper, C., Cottrell, E., Furtney, M., Hickey, J., Jay, J., Lloyd, R., Parker, A. L., Pritchard, M. E., Robertson, E., Venzke, E., and Williamson, J. L.: Synthesis of global satellite observations of magmatic and volcanic deformation: implications for volcano monitoring & the lateral extent of magmatic domains, Journal of Applied Volcanology, 7, 2, https://doi.org/10.1186/s13617-018-0071-3, 2018.
Elliott, J. R., Walters, R. J., and Wright, T. J.: The role of space-based observation in understanding and responding to active tectonics and earthquakes, Nat. Commun., 7, 13844, https://doi.org/10.1038/ncomms13844, 2016.
Elliott, J. R.: Earth Observation for the Assessment of Earthquake Hazard, Risk and Disaster Management, Surv. Geophys., 41, 1323–1354, https://doi.org/10.1007/s10712-020-09606-4, 2020.
Fielding, E. J. [@EricFielding]: “#Haitiearthquake2021 surface deformation measured by InSAR and SAR pixel offset tracking on JAXA ALOS2 images. Analyzed at NASA/JPL. Fault slip extends from epicenter about 60 km to west. Radar line-of-sight to satellite up and west. Both measure same direction in different ways.”, Twitter, https://twitter.com/EricFielding/status/1428629519947034624 (last access: 13 December 2022), posted: 09:06, 20 August 2021.
Gaddes, M. E., Hooper, A., Bagnardi, M., Inman, H., and Albino, F.: Blind Signal Separation Methods for InSAR: The Potential to Automatically Detect and Monitor Signals of Volcanic Deformation, J. Geophys. Res.-Sol. Ea., 123, 10226–10251, https://doi.org/10.1029/2018jb016210, 2018.
Galve, J. P., Pérez-Peña, J. V., Azañón, J. M., Closson, D., Caló, F., Reyes-Carmona, C., Jabaloy, A., Ruano, P., Mateos, R. M., Notti, D., Herrera, G., Béjar-Pizarro, M., Monserrat, O., and Bally, P.: Evaluation of the SBAS InSAR Service of the European Space Agency's Geohazard Exploitation Platform (GEP), Remote Sens.-Basel, 9, 1291, https://doi.org/10.3390/rs9121291, 2017.
Ganas, A., Kourkouli, P., Briole, P., Moshou, A., Elias, P., and Parcharidis, I.: Coseismic displacements from moderate-size earthquakes mapped by Sentinel-1 differential interferometry: the case of February 2017 Gulpinar earthquake sequence (Biga Peninsula, Turkey), Remote Sens.-Basel, 10, 1089, https://doi.org/10.3390/rs10071089, 2018.
Gens, R. and Van Genderen, J. L.: Review Article SAR interferometry–issues, techniques, applications, Int. J. Remote Sens., 17, 1803–1835, https://doi.org/10.1080/01431169608948741, 1996.
Geudtner, D., Torres, R., Snoeij, P., Davidson, M., and Rommen, B.: Sentinel-1 System capabilities and applications, 2014 IEEE Geoscience and Remote Sensing Symposium, 1457–1460, 2014.
Gill, J. C., Taylor, F. E., Duncan, M. J., Mohadjer, S., Budimir, M., Mdala, H., and Bukachi, V.: Invited perspectives: Building sustainable and resilient communities – recommended actions for natural hazard scientists, Nat. Hazards Earth Syst. Sci., 21, 187–202, https://doi.org/10.5194/nhess-21-187-2021, 2021.
Global Volcanism Program: Volcanoes of the World, (v. 5.0.0; 1 November 2022), edited by: Venzke, E., Smithsonian Institution [data set], https://doi.org/10.5479/si.GVP.VOTW5-2022.5.0, 2022.
Gold, N.: Using Twitter Data in Research: Guidance for Researchers and Ethics Reviewers, https://www.ucl.ac.uk/data-protection/sites/data-protection/files/using-twitter-research-v1.0.pdf (last access: 30 May 2023), 2020.
Goldstein, R. M., Engelhardt, H., Kamb, B., and Frolich, R. M.: Satellite Radar Interferometry for Monitoring Ice Sheet Motion: Application to an Antarctic Ice Stream, Science, 262, 1525–1530, https://doi.org/10.1126/science.262.5139.1525, 1993.
Gorelick, N., Hancher, M., Dixon, M., Ilyushchenko, S., Thau, D., and Moore, R.: Google Earth Engine: Planetary-scale geospatial analysis for everyone, Remote Sens. Environ., 202, 18–27, https://doi.org/10.1016/j.rse.2017.06.031, 2017.
Hagberg, J. O. and Ulander, L. M. H.: On the optimization of interferometric SAR for topographic mapping, IEEE T. Geosci. Remote, 31, 303–306, https://doi.org/10.1109/36.210472, 1993.
Henderson, S. T. and Pritchard, M. E.: Decadal volcanic deformation in the Central Andes Volcanic Zone revealed by InSAR time series, Geochem. Geophy. Geosy., 14, 1358–1374, https://doi.org/10.1002/ggge.20074, 2013.
Hicks, A. and Barclay, J.: Citizen centric risk communication, Geoscientist, https://www.geolsoc.org.uk/Geoscientist/Archive/August-2018/Hicks-Volcanic-comms (last access: 30 May 2023), 2018.
Hicks, S. P.: Geoscience analysis on Twitter, Nat. Geosci., 12, 585–586, https://doi.org/10.1038/s41561-019-0425-4, 2019.
Hooper, A., Zebker, H., Segall, P., and Kampes, B.: A new method for measuring deformation on volcanoes and other natural terrains using InSAR persistent scatterers, Geophys. Res. Lett., 31, L23611, https://doi.org/10.1029/2004gl021737, 2004.
Jónsdóttir, K. [@krjonsdottir] (2021): “Latest InSAR also suggests a dike intrusion in the same location as this spring (24feb-19mar). Seismicity is still high and today a M4.7 at 15:03 occurred east of the crater (Stóri Hrútur). A new eruption has not started yet... Volcano monitoring does not ask if it is holidays”, Twitter, https://twitter.com/krjonsdottir/status/1474413422855008257 (last access: 13 December 2022), posted: 04:15, 24 December 2021.
Jónsson, S. [@Sjonni_KAUST]: “Successive InSAR data of the Iceland crisis. The first includes the M5.7 earthquake, a few other offsets, and clear dike deformation, the second indicates dike migration to the southwest and shows the surface rupture of the M5 event last night (S1, desc., by Adriano) @ESA_EO”, Twitter, https://twitter.com/Sjonni_KAUST/status/1368589190850560000 (last access: 13 December 2022), posted: 03:47, 7 March 2021.
Joyce, K. E., Belliss, S. E., Samsonov, S. V., McNeill, S. J., and Glassey, P. J.: A review of the status of satellite remote sensing and image processing techniques for mapping natural hazards and disasters, Prog. Phys. Geogr., 33, 183–207, https://doi.org/10.1177/0309133309339563, 2009.
Kääb, A., Altena, B., and Mascaro, J.: Coseismic displacements of the 14 November 2016 Mw 7.8 Kaikoura, New Zealand, earthquake using the Planet optical cubesat constellation, Nat. Hazards Earth Syst. Sci., 17, 627–639, https://doi.org/10.5194/nhess-17-627-2017, 2017.
Kearney, M. W.: rtweet: Collecting and analyzing Twitter data, Journal of Open Source Software, 4, 1829, https://doi.org/10.21105/joss.01829, 2019.
Kennedy, J. H., Anderson, R. A., Biessel, R., Chase, T., Ellis, O., Fairbanks, K., Fleming, C., Horn, W. B., Johnston, A., and Kristenson, H.: Skip the Processing: On Demand Analysis-Ready InSAR from ASF, AGU Fall Meeting, New Orleans, LA, G45B-0395, 2021.
Kirschbaum, D., Malet, J.-P., and Roessner, S.: Fostering the uptake of satellite Earth Observation data for landslide hazard understanding: the CEOS Landslide Pilot, 19th EGU General Assembly, EGU2017, 23–28 April 2017, Vienna, Austria, https://ui.adsabs.harvard.edu/abs/2017EGUGA..19.8353K/abstract (last access: 30 May 2023), 2017.
Kirschbaum, D., Watson, C. S., Rounce, D. R., Shugar, D. H., Kargel, J. S., Haritashya, U. K., Amatya, P., Shean, D., Anderson, E. R., and Jo, M.: The State of Remote Sensing Capabilities of Cascading Hazards Over High Mountain Asia, Front. Earth Sci., 7, https://doi.org/10.3389/feart.2019.00197, 2019.
Lacassin, R., Devès, M., Hicks, S. P., Ampuero, J.-P., Bossu, R., Bruhat, L., Daryono, Wibisono, D. F., Fallou, L., Fielding, E. J., Gabriel, A.-A., Gurney, J., Krippner, J., Lomax, A., Sudibyo, Muh. M., Pamumpuni, A., Patton, J. R., Robinson, H., Tingay, M., and Valkaniotis, S.: Rapid collaborative knowledge building via Twitter after significant geohazard events, Geosci. Commun., 3, 129–146, https://doi.org/10.5194/gc-3-129-2020, 2020.
Lauknes, T. R., Piyush Shanker, A., Dehls, J. F., Zebker, H. A., Henderson, I. H. C., and Larsen, Y.: Detailed rockslide mapping in northern Norway with small baseline and persistent scatterer interferometric SAR time series methods, Remote Sens. Environ., 114, 2097–2109, https://doi.org/10.1016/j.rse.2010.04.015, 2010.
Lazecký, M., Spaans, K., González, P. J., Maghsoudi, Y., Morishita, Y., Albino, F., Elliott, J., Greenall, N., Hatton, E. L., Hooper, A., Juncu, D., McDougall, A., Walters, R. J., Watson, C., Weiss, J. R., and Wright, T.: LiCSAR: An Automatic InSAR Tool for Measuring and Monitoring Tectonic and Volcanic Activity, Remote. Sens., 12, 2430, https://doi.org/10.3390/rs12152430, 2020.
Lloyd, R., Biggs, J., Birhanu, Y., Wilks, M., Gottsmann, J., Kendall, J.-M., Ayele, A., Lewi, E., and Eysteinsson, H.: Sustained Uplift at a Continental Rift Caldera, J. Geophys. Res.-Sol. Ea., 123, 5209–5226, https://doi.org/10.1029/2018jb015711, 2018.
Maghsoudi, Y., Hooper, A. J., Wright, T. J., Lazecky, M., and Ansari, H.: Characterizing and correcting phase biases in short-term, multilooked interferograms, Remote Sens. Environ., 275, 113022, https://doi.org/10.1016/j.rse.2022.113022, 2022.
Massonnet, D., Rossi, M., Carmona, C., Adragna, F., Peltzer, G., Feigl, K., and Rabaute, T.: The displacement field of the Landers earthquake mapped by radar interferometry, Nature, 364, 138–142, https://doi.org/10.1038/364138a0, 1993.
Mendoza, M., Poblete, B., and Castillo, C.: Twitter under crisis: Can we trust what we RT?, Proceedings of the first workshop on social media analytics, Washington, DC, 25 July 2010, 71–79, https://doi.org/10.1145/1964858.1964869, 2010.
Meyer, F. J. [@SARevangelist]: “#SAR and #InSAR Twitter Help us keep our curated list of awesome SAR software, libraries, and resources updated! Current list at: https://github.com/RadarCODE/awesome-sar Got new, awesome open-source SAR resources? Add them to the current list! #OneStopSARShop #GoldenAgeOfSAR”, Twitter, https://twitter.com/SARevangelist/status/1426704903108403201 (last access: 13 December 2022), posted: 01:38, 15 August 2021.
Meyer, F. J., Arko, S. A., Hogenson, K., McAlpin, D. B., and Whitley, M. A.: A Cloud-Based System for Automatic Hazard Monitoring from Sentinel-1 SAR Data, AGU Fall Meeting Abstracts, New Orleans, Louisiana, 11–15 December 2017, G33A-03, 2017.
Moore, C., Wright, T., Hooper, A., and Biggs, J.: The 2017 Eruption of Erta 'Ale Volcano, Ethiopia: Insights Into the Shallow Axial Plumbing System of an Incipient Mid-Ocean Ridge, Geochem. Geophy. Geosy., 20, 5727–5743, https://doi.org/10.1029/2019gc008692, 2019.
Morishita, Y.: Nationwide urban ground deformation monitoring in Japan using Sentinel-1 LiCSAR products and LiCSBAS, Prog. Earth Planet. Sci., 8, 1–23, 2021.
Morishita, Y., Lazecky, M., Wright, T. J., Weiss, J. R., Elliott, J. R., and Hooper, A.: LiCSBAS: An Open-Source InSAR Time Series Analysis Package Integrated with the LiCSAR Automated Sentinel-1 InSAR Processor, Remote Sens.-Basel, 12, 424, https://doi.org/10.3390/rs12030424, 2020.
Murthy, D.: Twitter: Microphone for the masses?, Media, Culture and Society, 33, 779–789, https://doi.org/10.1177/0163443711404744, 2011.
Newhall, C.: Professional conduct of scientists during volcanic crises, B. Volcanol., 60, 323–334, 1999.
Novellino, A., Cesarano, M., Cappelletti, P., Di Martire, D., Di Napoli, M., Ramondini, M., Sowter, A., and Calcaterra, D.: Slow-moving landslide risk assessment combining Machine Learning and InSAR techniques, CATENA, 203, 105317, https://doi.org/10.1016/j.catena.2021.105317, 2021.
Oschatz, C., Stier, S., and Maier, J.: Twitter in the News: An Analysis of Embedded Tweets in Political News Coverage, Digital Journalism, 10, 1–20, https://doi.org/10.1080/21670811.2021.1912624, 2021.
Pallister, J., Papale, P., Eichelberger, J., Newhall, C., Mandeville, C., Nakada, S., Marzocchi, W., Loughlin, S., Jolly, G., Ewert, J., and Selva, J.: Volcano observatory best practices (VOBP) workshops – a summary of findings and best-practice recommendations, J. Appl. Volcanol., 8, 2, https://doi.org/10.1186/s13617-019-0082-8, 2019.
Parsons, T.: The Weight of Cities: Urbanization Effects on Earth's Subsurface, AGU Advances, 2, e2020AV000277, https://doi.org/10.1029/2020AV000277, 2021.
Petrovic, S., Osborne, M., McCreadie, R., Macdonald, C., Ounis, I., and Shrimpton, L.: Can twitter replace newswire for breaking news?, Proceedings of the international AAAI conference on web and social media, Cambridge, Massachusetts, USA, 8–11 July 2013, 713–716, https://doi.org/10.1609/icwsm.v7i1.14450, 2013.
Pettorelli, N., Vik, J. O., Mysterud, A., Gaillard, J.-M., Tucker, C. J., and Stenseth, N. C.: Using the satellite-derived NDVI to assess ecological responses to environmental change, Trends Ecol. Evol., 20, 503–510, https://doi.org/10.1016/j.tree.2005.05.011, 2005.
Pilger, C., Gaebler, P., Hupe, P., Kalia, A. C., Schneider, F. M., Steinberg, A., Sudhaus, H., and Ceranna, L.: Yield estimation of the 2020 Beirut explosion using open access waveform and remote sensing data, Sci. Rep.-UK, 11, 14144, https://doi.org/10.1038/s41598-021-93690-y, 2021.
Pinel, V., Hooper, A., De la Cruz-Reyna, S., Reyes-Davila, G., Doin, M. P., and Bascou, P.: The challenging retrieval of the displacement field from InSAR data for andesitic stratovolcanoes: Case study of Popocatepetl and Colima Volcano, Mexico, J. Volcanol. Geoth. Res., 200, 49–61, https://doi.org/10.1016/j.jvolgeores.2010.12.002, 2011.
Piter, A., Vassileva, M., Haghighi, M. H., and Motagh, M.: Exploring Cloud-Based Platforms for Rapid Insar Time Series Analysis, Int. Arch. Photogramm. Remote Sens. Spatial Inf. Sci., XLIII-B3-2021, 171–176, https://doi.org/10.5194/isprs-archives-XLIII-B3-2021-171-2021, 2021.
Poblet, M., García-Cuesta, E., and Casanovas, P.: Crowdsourcing Tools for Disaster Management: A Review of Platforms and Methods, in: AI Approaches to the Complexity of Legal Systems, Lecture Notes in Computer Science, vol. 8929, Springer, Berlin, Heidelberg, 261–274, https://doi.org/10.1007/978-3-662-45960-7_19, 2014.
Pritchard, M. E., Biggs, J., Wauthier, C., Sansosti, E., Arnold, D. W. D., Delgado, F., Ebmeier, S. K., Henderson, S. T., Stephens, K., Cooper, C., Wnuk, K., Amelung, F., Aguilar, V., Mothes, P., Macedo, O., Lara, L. E., Poland, M. P., and Zoffoli, S.: Towards coordinated regional multi-satellite InSAR volcano observations: results from the Latin America pilot project, Jo. Appl. Volcanol., 7, 5, https://doi.org/10.1186/s13617-018-0074-0, 2018.
R Core Team: R: A language and environment for statistical computing. R Foundation for Statistical Computing, Vienna, Austria, https://www.R-project.org/ (last access: 30 May 2023), 2021.
Rigby, R., Burns, H., Watson, C. S., Lazecky, M., Ebmeier, S., Morishita, Y., and Wright, T.: COMET_VolcDB: COMET Volcanic and Magmatic Deformation Portal (2021 beta release) (1.1-beta), Zenodo, https://doi.org/10.5281/zenodo.4545877, 2021.
Rosen, P. A., Hensley, S., Joughin, I. R., Li, F. K., Madsen, S. N., Rodriguez, E., and Goldstein, R. M.: Synthetic aperture radar interferometry, P. IEEE, 88, 333–382, https://doi.org/10.1109/5.838084, 2000.
Rott, H. and Nagler, T.: The contribution of radar interferometry to the assessment of landslide hazards, Adv. Space Res., 37, 710–719, https://doi.org/10.1016/j.asr.2005.06.059, 2006.
Ruan, T., Kong, Q., McBride, S. K., Sethjiwala, A., and Lv, Q.: Cross-platform analysis of public responses to the 2019 Ridgecrest earthquake sequence on Twitter and Reddit, Sci. Rep.-UK, 12, 1634, https://doi.org/10.1038/s41598-022-05359-9, 2022.
Shugar, D. H., Jacquemart, M., Shean, D., Bhushan, S., Upadhyay, K., Sattar, A., Schwanghart, W., McBride, S., de Vries, M. V. W., Mergili, M., Emmer, A., Deschamps-Berger, C., McDonnell, M., Bhambri, R., Allen, S., Berthier, E., Carrivick, J. L., Clague, J. J., Dokukin, M., Dunning, S. A., Frey, H., Gascoin, S., Haritashya, U. K., Huggel, C., Kääb, A., Kargel, J. S., Kavanaugh, J. L., Lacroix, P., Petley, D., Rupper, S., Azam, M. F., Cook, S. J., Dimri, A. P., Eriksson, M., Farinotti, D., Fiddes, J., Gnyawali, K. R., Harrison, S., Jha, M., Koppes, M., Kumar, A., Leinss, S., Majeed, U., Mal, S., Muhuri, A., Noetzli, J., Paul, F., Rashid, I., Sain, K., Steiner, J., Ugalde, F., Watson, C. S., and Westoby, M. J.: A massive rock and ice avalanche caused the 2021 disaster at Chamoli, Indian Himalaya, Science, 373, eabh4455, https://doi.org/10.1126/science.abh4455, 2021.
Sheetz, M. [@thesheetztweetz]: “NASA announces two new missions to Venus: 1 – DAVINCI+ (Deep Atmosphere Venus Investigation of Noble gases, Chemistry, and Imaging Plus) 2 – VERITAS (Venus Emissivity, Radio Science, InSAR, Topography, and Spectroscopy)”, Twitter, https://twitter.com/thesheetztweetz/status/1400174073540493316 (last access: 13 December 2022), posted: 08:34, 2 June 2021.
Simons, M. and Rosen, P. A.: 3.12 – Interferometric Synthetic Aperture Radar Geodesy, in: Treatise on Geophysics, edited by: Schubert, G., Elsevier, Amsterdam, 391–446, https://doi.org/10.1016/B978-044452748-6.00059-6, 2007.
Sinnenberg, L., Buttenheim, A. M., Padrez, K., Mancheno, C., Ungar, L., and Merchant, R. M.: Twitter as a Tool for Health Research: A Systematic Review, Am. J. Public Health, 107, e1–e8, https://doi.org/10.2105/AJPH.2016.303512, 2016.
Smets, B. [@smetsbenoit]: “First Sentinel-1 interferogram over Nyiragongo and the Virunga region. Amazing deformation signal! #Nyiragongo #OVG #GVO #Eruption #MasTer #InSAR”, Twitter, https://twitter.com/smetsbenoit/status/1397296480340353027 (last access: 13 December 2022), posted: 10:00, 25 May 2021.
Solano, D. [@Mr_InSAR]: “El #hundimiento del terreno en #CDMX se debe a la sobreexplotación del agua subterránea. Lo mismo ocurre en muchas otras ciudaddes del país) #Guanajuato, #Guadalajara, #Toluca, #Puebla, etc.). Abro hilo”, Twitter, https://twitter.com/Mr_InSAR/status/1425524572070170628 (last access: 13 December 2022), posted: 19:28, 11 August 2021.
Stevens, V. L. and Avouac, J.-P.: On the relationship between strain rate and seismicity in the India–Asia collision zone: implications for probabilistic seismic hazard, Geophys. J. Int., 226, 220–245, https://doi.org/10.1093/gji/ggab098, 2021.
Tessema, T. T. [@TTemtime]: “Hello, my name is Tesfaye Temtime. I recently finished my PhD in Geophysics from the University of Bristol, UK. I am an enthusiast of detecting surface changes using satellite geodesy (i.e. InSAR and GNSS) and modelling”, Twitter, https://twitter.com/TTemtime/status/1435162379462062081 (last access: 13 December 2022), posted: 09:45, 7 September 2021.
Tronin, A. A.: Satellite Remote Sensing in Seismology. A Review, Remote Sens.-Basel, 2, 124–150, 2010.
Tsironi, V., Ganas, A., Karamitros, I., Efstathiou, E., Koukouvelas, I., and Sokos, E.: Kinematics of Active Landslides in Achaia (Peloponnese, Greece) through InSAR Time Series Analysis and Relation to Rainfall Patterns, Remote Sens.-Basel, 14, 844, https://doi.org/10.3390/rs14040844, 2022.
Turner, W., Rondinini, C., Pettorelli, N., Mora, B., Leidner, A. K., Szantoi, Z., Buchanan, G., Dech, S., Dwyer, J., Herold, M., Koh, L. P., Leimgruber, P., Taubenboeck, H., Wegmann, M., Wikelski, M., and Woodcock, C.: Free and open-access satellite data are key to biodiversity conservation, Biol. Conserv., 182, 173–176, https://doi.org/10.1016/j.biocon.2014.11.048, 2015.
UN: The Sustainable Development Goals Report 2020, https://unstats.un.org/sdgs/report/2020/The-Sustainable-Development-Goals-Report-2020.pdf (last access: 2 November 2022), 2020.
UNISDR: Sendai framework for disaster risk reduction 2015–2030, https://www.undrr.org/publication/sendai-framework-disaster-risk-reduction-2015-2030(last access: 30 May 2023), 2015.
Van Noorden, R.: Online collaboration: Scientists and the social network, Nature News, 512, 126–129, 2014.
Vieweg, S., Hughes, A. L., Starbird, K., and Palen, L.: Microblogging during two natural hazards events: what twitter may contribute to situational awareness, Proceedings of the SIGCHI conference on human factors in computing systems, Atlanta, Georgia, USA, 10–15 April 2010, 1079–1088, https://doi.org/10.1145/1753326.1753486, 2010.
Voigt, S., Kemper, T., Riedlinger, T., Kiefl, R., Scholte, K., and Mehl, H.: Satellite Image Analysis for Disaster and Crisis-Management Support, IEEE T. Geosci. Remote, 45, 1520–1528, https://doi.org/10.1109/TGRS.2007.895830, 2007.
Walter, T. R. [@VOLCAPSE]: “I’d like sharing one of the most beautiful #InSAR pattern one can find at volcanoes. Thats from Wolf, Galápagos, showing intense deformation associated with the ongoing fissure eruption, captured by desc. Sentinel-1 in 5Jan22-17Jan22. Each colour cycle is approx 3 cm of motion.”, Twitter, https://twitter.com/VOLCAPSE/status/1484616658345996292 (last access: 13 December 2022), posted: 07:59, 21 January 2022.
Wang, J., Pierce, M., Ma, Y., Fox, G., Donnellan, A., Parker, J., and Glasscoe, M.: Using Service-Based GIS to Support Earthquake Research and Disaster Response, Comput. Sci. Eng., 14, 21–30, https://doi.org/10.1109/MCSE.2012.61, 2012.
Weiss, J. R., Walters, R. J., Morishita, Y., Wright, T. J., Lazecky, M., Wang, H., Hussain, E., Hooper, A. J., Elliott, J. R., Rollins, C., Yu, C., Gonzaley, P. J., Spaans, K., Li, Z., and Parsons, B.: High-resolution surface velocities and strain for Anatolia from Sentinel-1 InSAR and GNSS data, Geophys. Res. Lett., 47, e2020GL087376, https://doi.org/10.1029/2020GL087376, 2020.
West, S. E., Bowyer, C. J., Apondo, W., Büker, P., Cinderby, S., Gray, C. M., Hahn, M., Lambe, F., Loh, M., Medcalf, A., Muhoza, C., Muindi, K., Njoora, T. K., Twigg, M. M., Waelde, C., Walnycki, A., Wainwright, M., Wendler, J., Wilson, M., and Price, H. D.: Using a co-created transdisciplinary approach to explore the complexity of air pollution in informal settlements, Humanities and Social Sciences Communications, 8, 285, https://doi.org/10.1057/s41599-021-00969-6, 2021.
Wickham, H.: stringr: simple, consistent wrappers for common string operations, R package version 1.4.0, https://CRAN.R-project.org/package=stringr (last access: 30 May 2023), 2017.
Wright, T. J., Parsons, B. E., and Lu, Z.: Toward mapping surface deformation in three dimensions using InSAR, Geophys. Res. Lett., 31, L01607, https://doi.org/10.1029/2003gl018827, 2004.
Yu, C., Li, Z., Penna, N. T., and Crippa, P.: Generic Atmospheric Correction Model for Interferometric Synthetic Aperture Radar Observations, J. Geophys. Res.-Sol. Ea., 123, 9202–9222, https://doi.org/10.1029/2017JB015305, 2018.
Zawacki, E. E., Bohon, W., Johnson, S., and Charlevoix, D. J.: Exploring TikTok as a promising platform for geoscience communication, Geosci. Commun., 5, 363–380, https://doi.org/10.5194/gc-5-363-2022, 2022.
Zhou, X., Chang, N.-B., and Li, S.: Applications of SAR Interferometry in Earth and Environmental Science Research, Sensors, 9, 1876–1912, 2009.