the Creative Commons Attribution 4.0 License.
the Creative Commons Attribution 4.0 License.
 | 04 Oct 2021
About right: references in open-access EGU (European Geosciences Union) journals
We investigated the number of references per page for different European Geosciences Union journals, which share the same text formatting. Although the journals formally all focus on geoscience, different disciplines are covered, from ocean science and biogeosciences to the technical description of numerical model development. In this study, we show that the number of references per page is remarkably constant across these journals. In addition, this value has remained constant in the last decade, despite the consistent increase in the number of pages and in the number of references in almost all journals considered. Independently of the quality of the references used in an article, we show that for the EGU (European Geosciences Union) journals the average number of references per page is 3.82 (1.87–6.18 at 90 % confidence level). This reveals that there is a consensus regarding optimum reference density, which depends on the journal's layout and not on the journal's discipline.
- Article
(1328 KB) - Full-text XML
- BibTeX
- EndNote


The number of references in a scientific paper can influence reader judgement of the paper's quality (Lovaglia, 1991), and it is thus an important factor in defining its success, i.e. its number of citations (Fox et al., 2016). Therefore, it is important that authors include an optimal (and balanced) quantity and quality of references in their articles.
It has been shown (Abt and Garfield, 2002) that the number of references per page is remarkably constant across a large number of disciplines and that longer papers are, on average, more frequently cited than shorter papers (Leimu and Koricheva, 2005). Nevertheless, the creation of a homogeneous and standardised text length is a challenging task, with each journal having different formatting layouts, which could influence the perception of reference quantity and, indirectly, result in pressure for an increase or decrease in their numbers.
In the last decades, the length of scientific papers has undergone a significant increase. Ucar et al. (2014) showed not only a clear trend towards an increase in the number of pages in papers in engineering journals but also that this increase has not yet begun to level off. This increase in paper length is mirrored by a constant increase in the number of references over time (Biglu, 2008; Jaunich, 2018). Bornmann and Mutz (2015) revealed a large increase in the number of references from the middle of the 20th century onward. The temporal increase in the number of references per papers varies among different disciplines (Sánchez-Gil et al., 2018). Furthermore, Nicolaisen and Frandsen (2021) showed that
there is a drop in short reference lists and a corresponding increase in a bit longer and medium-sized reference lists. Long and very long reference lists remain much more stable in shares over time and therefore do not contribute much to the observed growth.
A steady state in reference numbers has until now only been artificially reached in a few journals and/or manuscript types, through the enforcement of limits in the number of references (Anger, 1999). Nevertheless, most of these studies focused on the number of references per article, without analysing this parameter with respect to the paper length, or, similarly, without investigating reference density. A notable exception is the work of Milojević (2012), which found different temporal trends in references per page, depending on the field of study.
The European Geophysical Society (the predecessor of the European Geosciences Union) started its first open-access (OA) journal in 2001, with the launch of the journal Atmospheric Chemistry and Physics (Pöschl, 2004, 2012). The success of this first journal prompted the European Geosciences Union (EGU), through Copernicus Publications, to establish additional OA journals. A total of 19 journals are currently published by Copernicus Publications (for the EGU), covering various topics of the Earth, planetary and space sciences.
In this work we examined of the OA EGU journals, which have identical layouts and therefore allow for a direct comparison between the different journals. In addition, all the paper-related metadata have been published online in a searchable XML format, which allows for automatic computer scripting for information gathering. It must be stressed that Copernicus Publications publish other OA journals in addition to the EGU journals considered. However, these journals use diverse layouts, which hinders the comparison between them.
In this work we analyse the reference density, i.e. the number of references per page, in the OA journals published by the EGU. The goal is to investigate whether the reference density varies among journals which cover different topics but have the exact same layout. We show that there exists a well defined range for the number of references per page, similar for all OA EGU journals, and that this has remained remarkably constant over time. In the Sect. 2, the methods for data collection are explained, followed by an analysis of the temporal trends (Sect. 3). Finally, the main results are derived in Sect. 4, followed by the conclusions.
We considered articles accepted and published in XML form in the 2010–2020 period from the EGU OA journals. Therefore, only EGU journals which started operating in 2010 at the latest were used in this study, which resulted in the inclusion of a total of 12 journals (see Table 1):
-
GMD, Geoscientific Model Development;
-
ACP, Atmospheric Chemistry and Physics;
-
BG, Biogeosciences;
-
CP, Climate of the Past;
-
AMT, Atmospheric Measurement Techniques;
-
OS, Ocean Science;
-
ESD, Earth System Dynamics;
-
TC, The Cryosphere;
-
NHESS, Natural Hazards and Earth System Sciences;
-
NPG, Nonlinear Processes in Geophysics;
-
SE, Solid Earth;
-
HESS, Hydrology and Earth System Sciences.
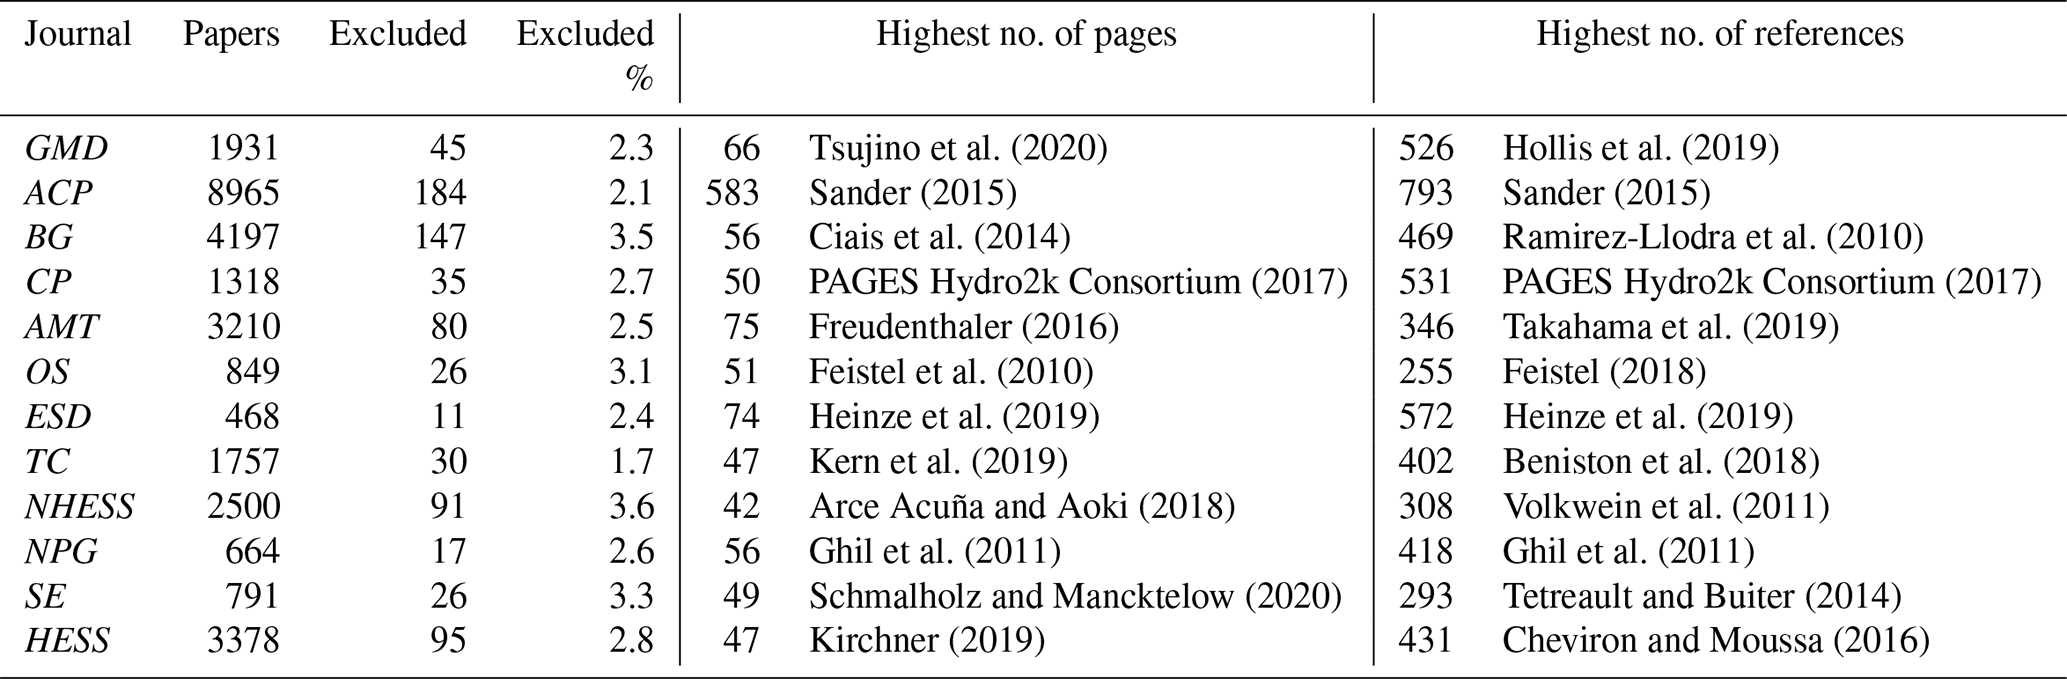
Table 1Summary of journal characteristics. The number of papers analysed in each journal is listed, as well as the number of papers excluded (also expressed as a fraction) as outliers. The papers with the highest number of pages and the highest number of references are also listed for each journal.
An automatic Python script was used to recursively collect all the information required, such as the number of pages and the number of references, from the XML version of each article.
To avoid counting papers which cited an unrepresentative number of references (such as zero references or pure compilation articles), the outliers, which were defined as (i) papers containing no references or (ii) papers containing a number of references above the average plus 3 times the reference's standard deviation, were removed. In total 30 028 papers were downloaded, of which 787 were excluded as outliers; i.e. 29 241 published papers were used in this analysis.
In Table 1 the numbers of papers analysed and the numbers excluded from the analysis for each journal are presented. Roughly, ≃ 3 % of the papers published in each journal were excluded as outliers. The outlier fraction ranges from 1.7 % for TC to 3.6 % for NHESS.
In addition to the numbers of analysed and disregarded papers, Table 1 lists the papers with the highest numbers of pages and references in the period 2010–2020 for each journal. The longest articles range in length from 42 pages (Arce Acuña and Aoki, 2018) to 583 pages (Sander, 2015). The maximum number of references in an article ranges from 255 in Feistel (2018) to 793 in Sander (2015). Review article Sander (2015) stands out among all other EGU articles with respect to both its number of pages and the number of references. In this paper, a list of measurements of Henry's law coefficients for numerous gases of atmospheric relevance are presented. However, it should be noted that not all the papers with higher numbers of references are review articles or compilations of measurements (see, for example, Takahama et al., 2019 or Hollis et al., 2019).
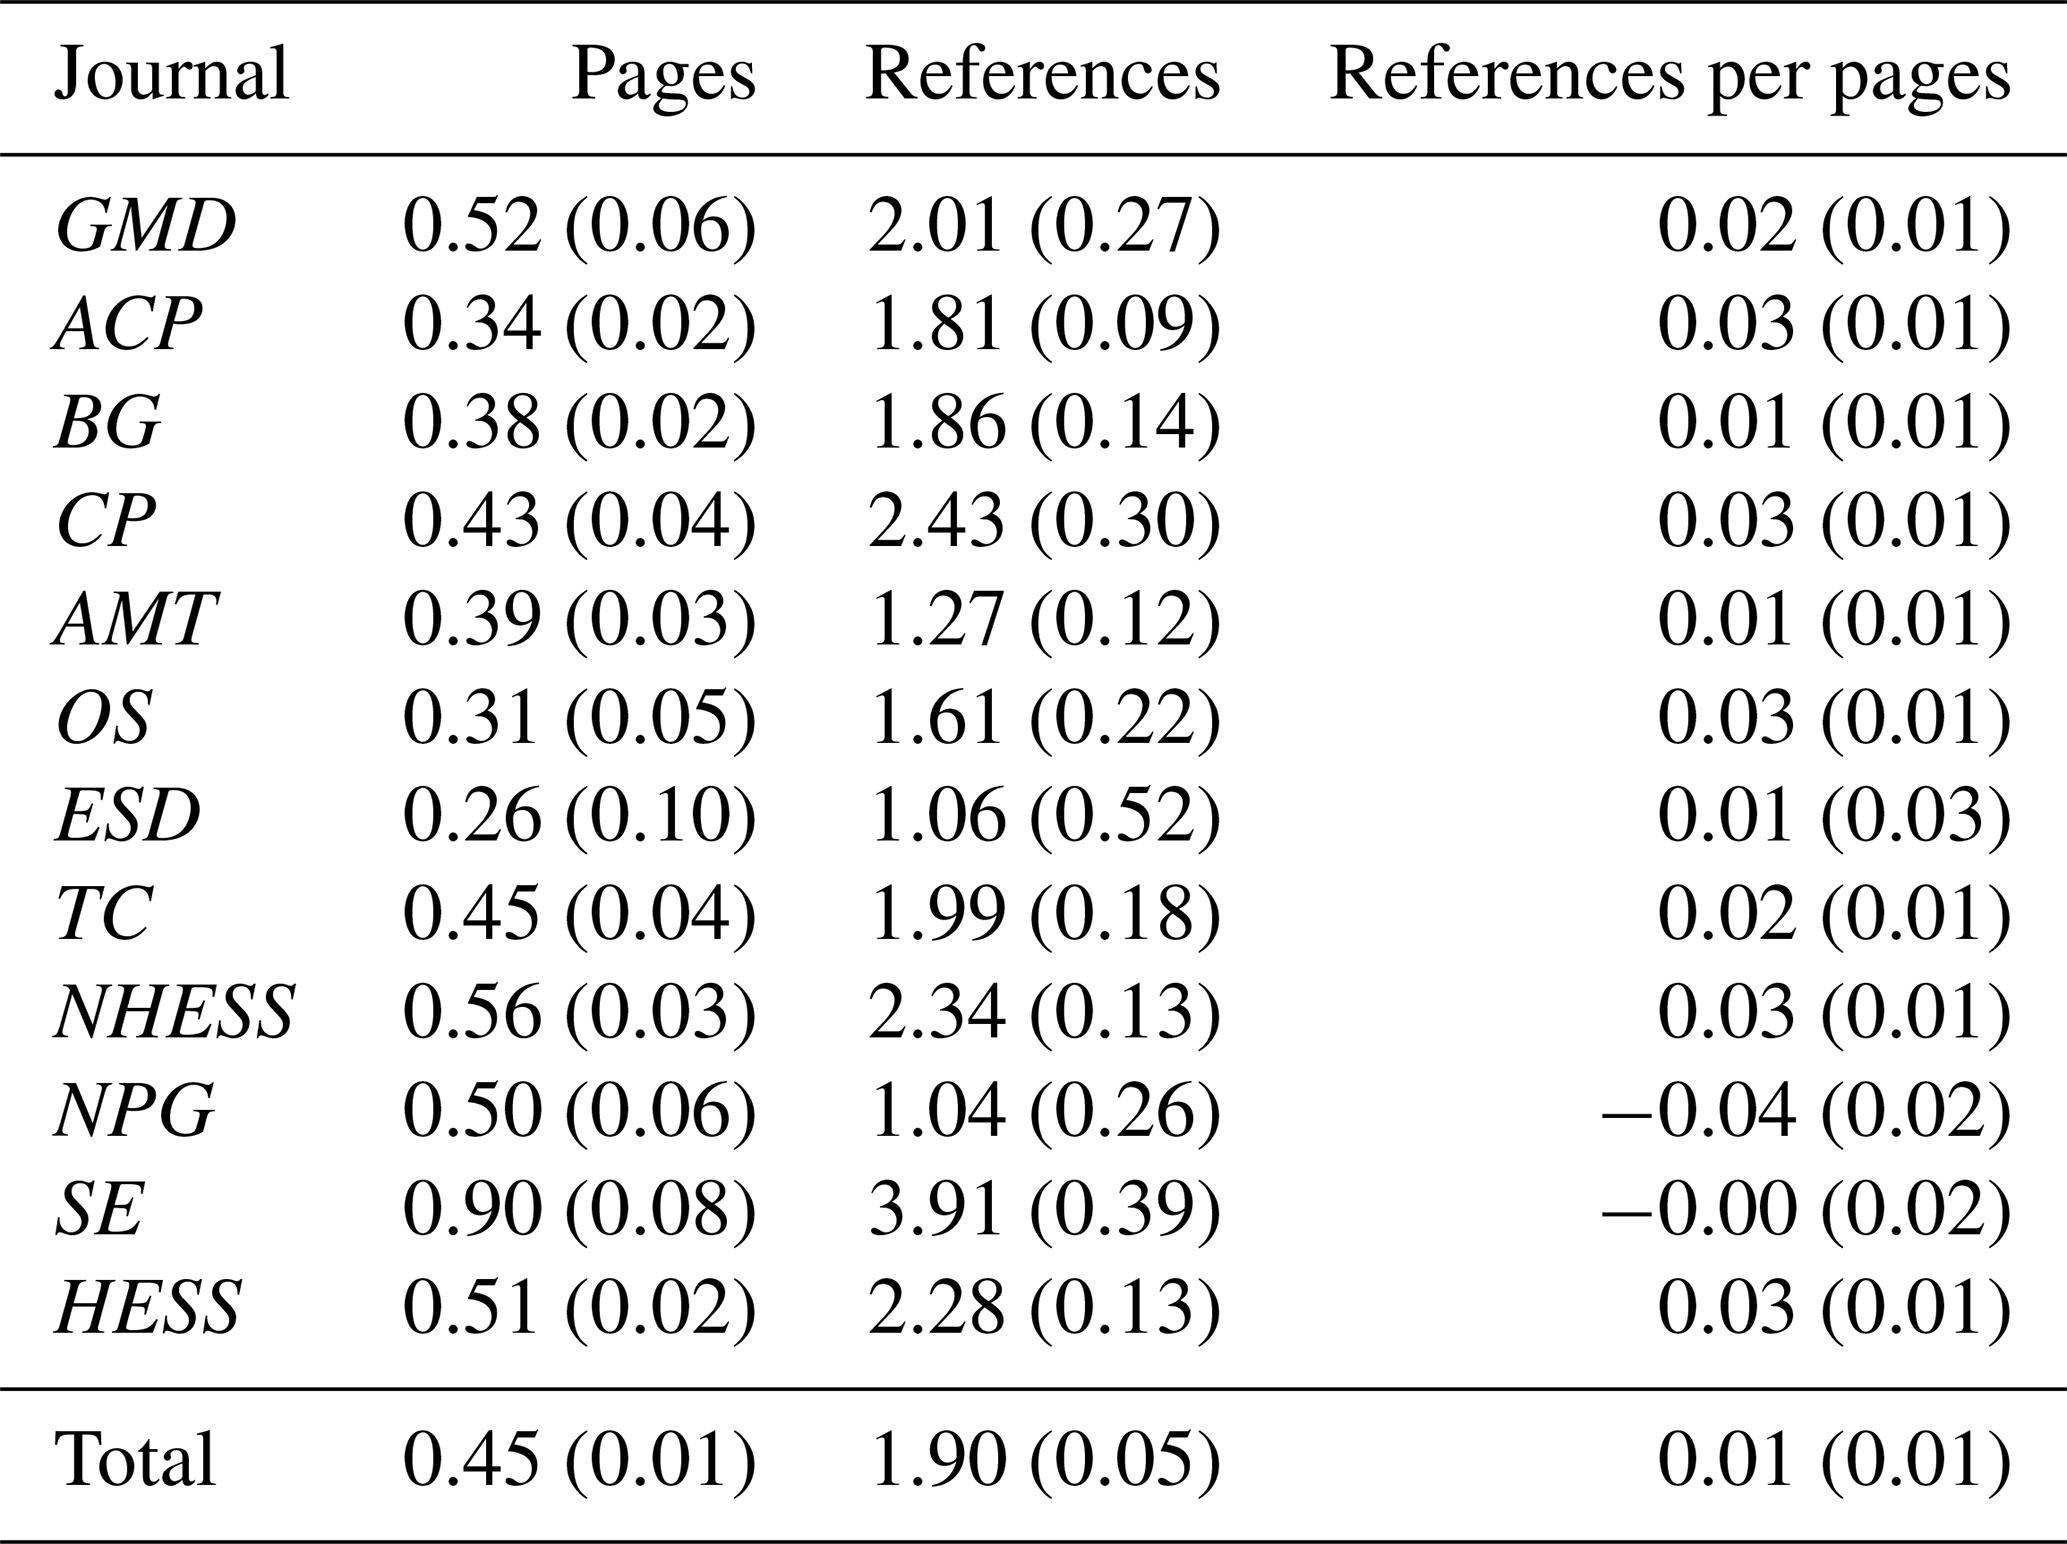
For each journal analysed, we estimated the trends in number of pages, references and references per page: our results are presented in Table 2. In EGU publications, the number of pages and references per paper have increased in the last decade. The increase in pages per paper ranges from 0.26 pages yr−1 in ESD to 0.90 pages yr−1 in SE. Similarly, the number of references also increased in the same period, ranging from 1.06 to 3.91 references per year in ESD and SE, respectively. Importantly, all these temporal trends (both number of pages and number of references) are statistically significant at 99 % confidence level, with the exception of the ESD journal.
Table 2Linear fit of the temporal trends of pages, references and references per page for different EGU journals for all analysed papers between 2010 and 2020. The numbers inside the parentheses are the standard deviations of the estimated time trends (slope of the linear fit). The units are in yr−1.
The increase in number of citations may be attributed to the increasing growth of available literature. In fact, by publishing more papers, more papers can (or must) be cited in future work. Analogously, the increase in absolute number of citations reflects also the maturity that a specific science field has reached, whereby the large (and increasing) number of citations mirrors the large (and increasing) amount of research performed on the specific topic. Furthermore, accessibility could be a major point for increasing citations over time: OA papers (with the leading role of pure OA journals) enable easy access to citable material. In addition, technological development (e.g. fast internet connection, searchable and online downloadable journals) facilitates the search and usage of previous literature. Finally, Persson et al. (2004) suggested that with the intensification of scientific collaboration an increase in citations of co-published papers must be expected; therefore, this increase is a sign of increasing national and international collaboration between research teams.
In addition to the increase in the number of pages and the number of references in the period 2010–2020, we estimated also the evolution of reference density (i.e. number of references per page) over this period. As shown in Table 2, these trends are very close to zero. The only journal with a clear statistically significant trend is ACP, which presents an increase in reference density per year equal to 0.032, while none of the other journals present a statistically significant trend. This is in contrast to the findings of Ucar et al. (2014), who found a variable reference density along the 50 years of study, but it is in agreement with the work of Abt and Garfield (2002).
Based on these findings, we can consider the reference density to be constant in OA EGU journals, which, in turn, enables us to inspect all papers published in the period covered.
The probability density distribution of pages against references is presented in Fig. 1. Both pages and references exhibit a clear log-normal distribution, although for a few journals (e.g ESD) the number of papers available was quite low, which precludes the derivation of meaningful statistics. In each plot the linear fit (with no intercept) was also overlaid on the distribution. The linear fits range from 2.8 (AMT) to 4.6 (CP) references per page, showing quite homogeneous behaviour within all the papers, with a coherent and similar reference density in all EGU journals.
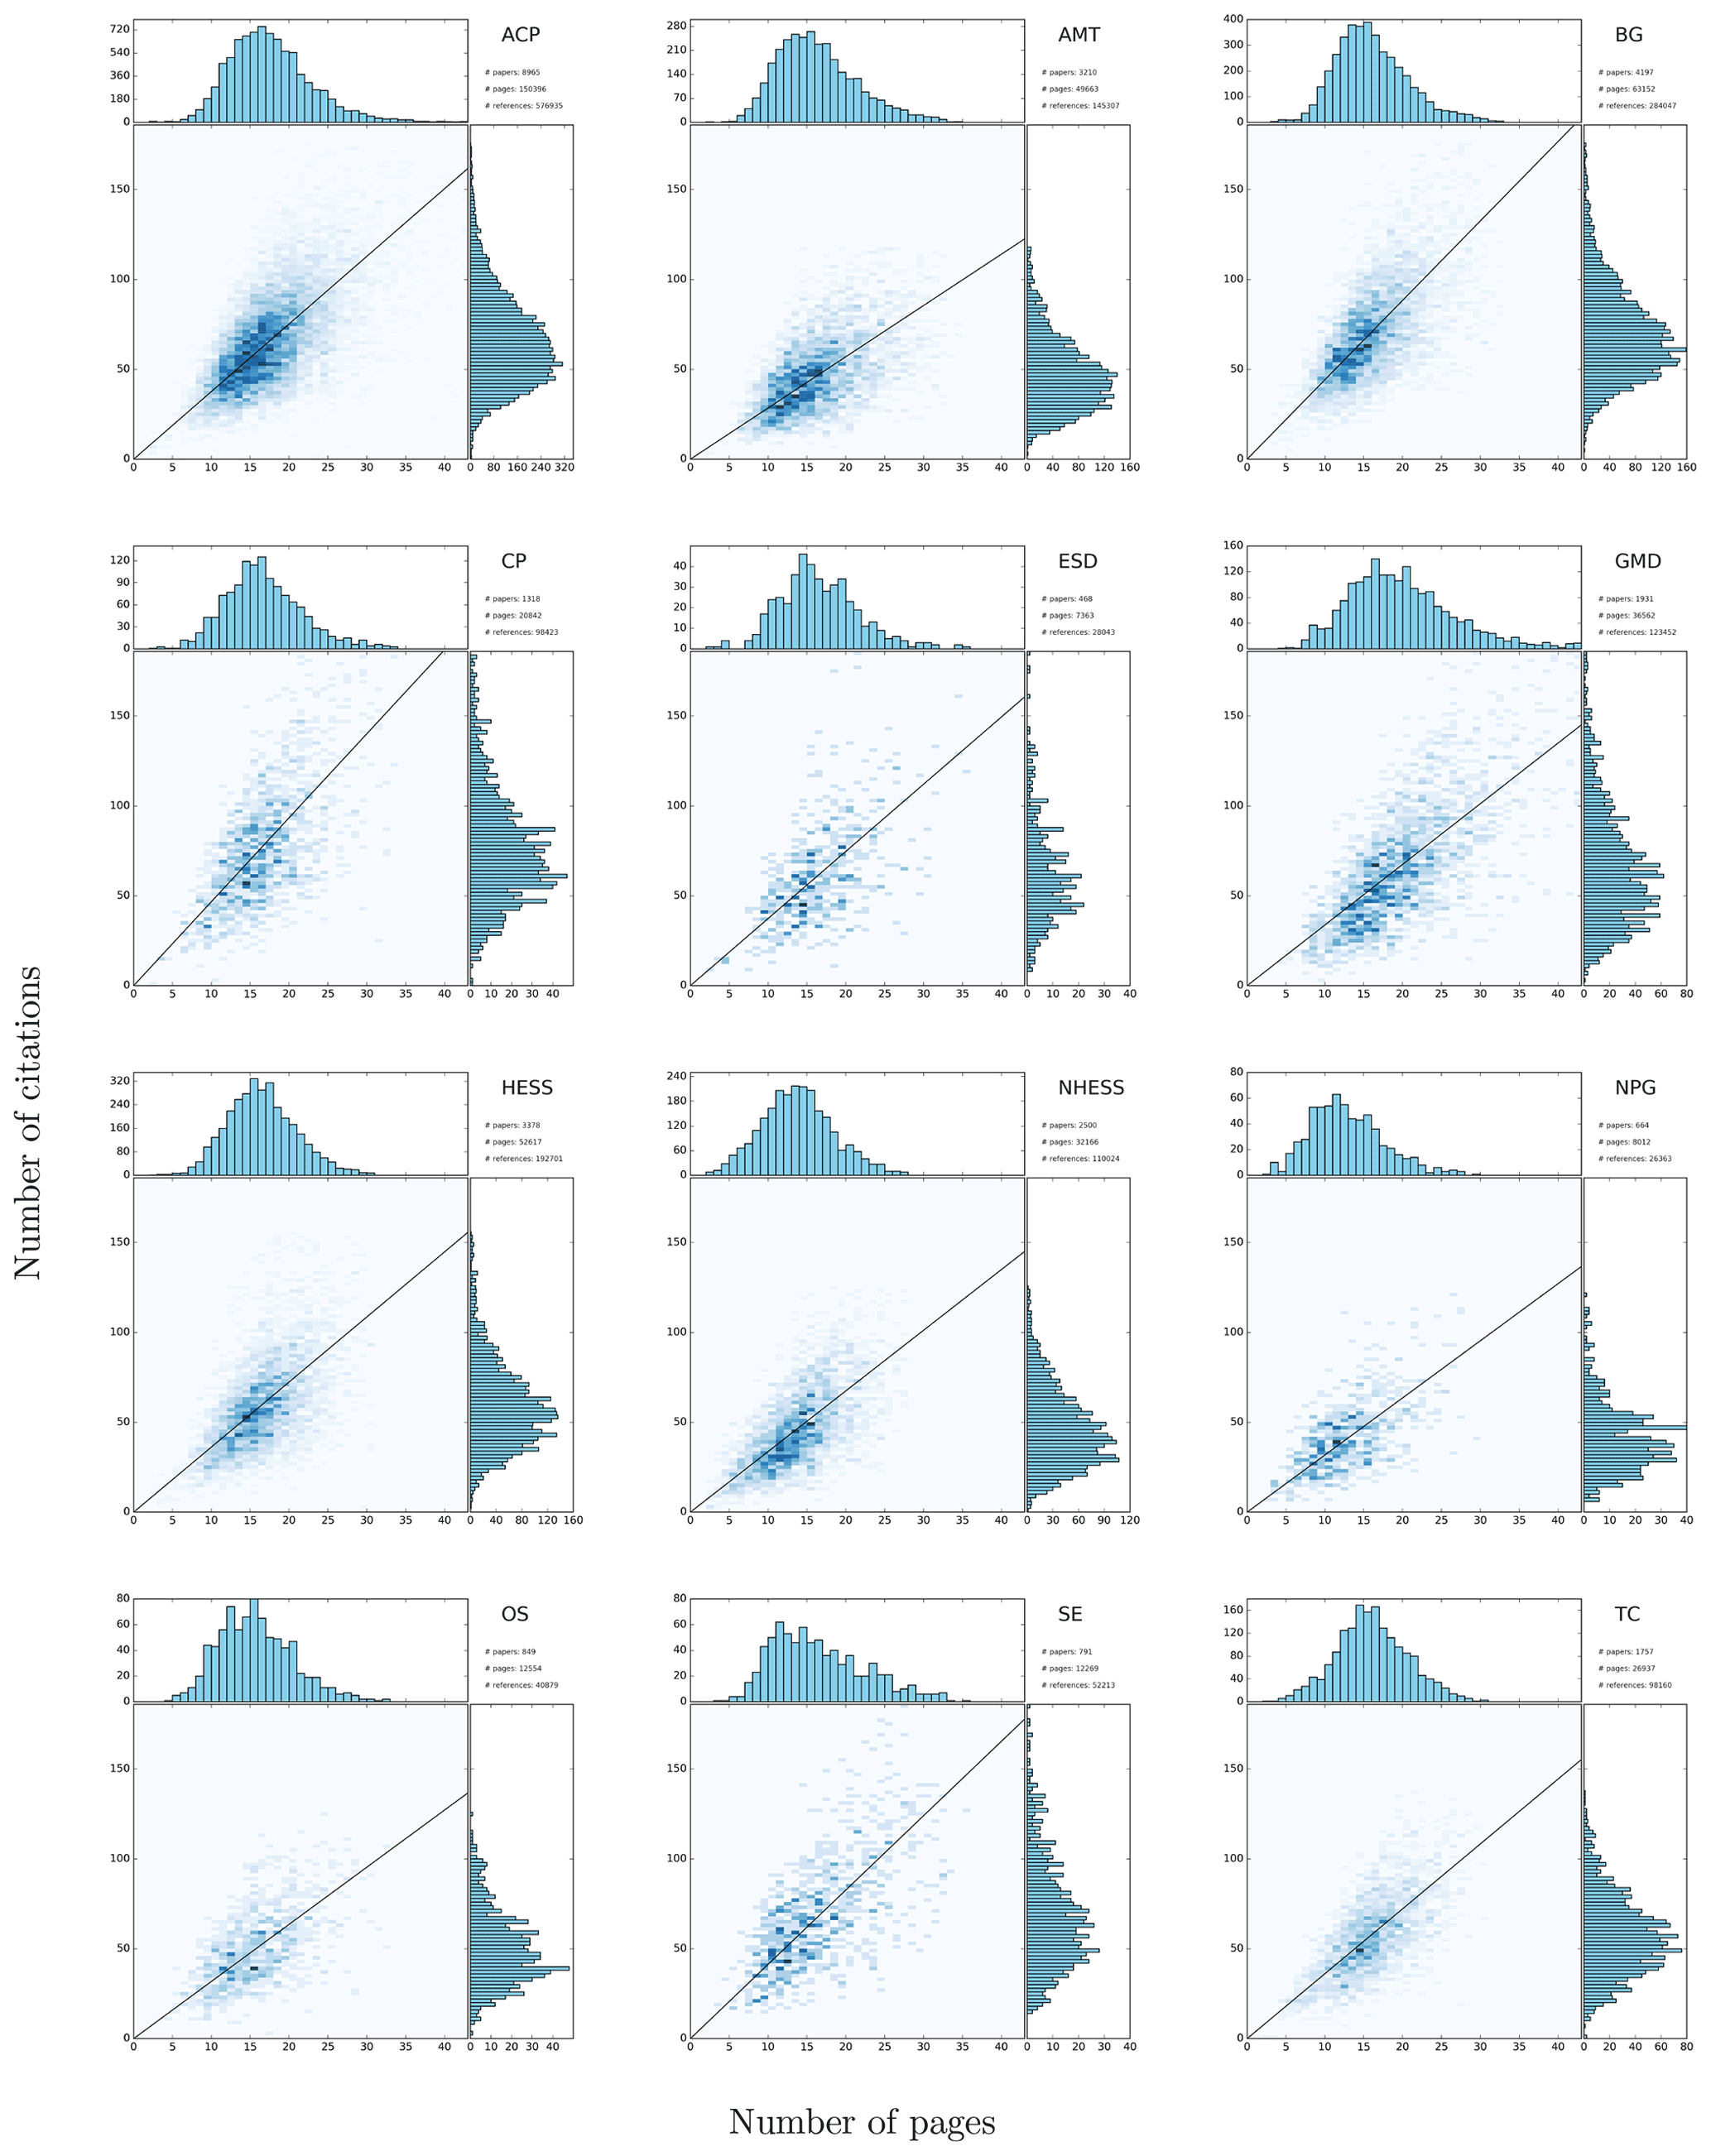
Figure 1Shown are two-dimensional histograms (centre) with frequency histograms for pages (top) and references (right) for different EGU journals. The journal abbreviation and the total number of papers, pages and references are listed on the top right of each plot. The black line depicts the linear fit (with no intercept). The axes for the two-dimensional histograms are the same in all plots.
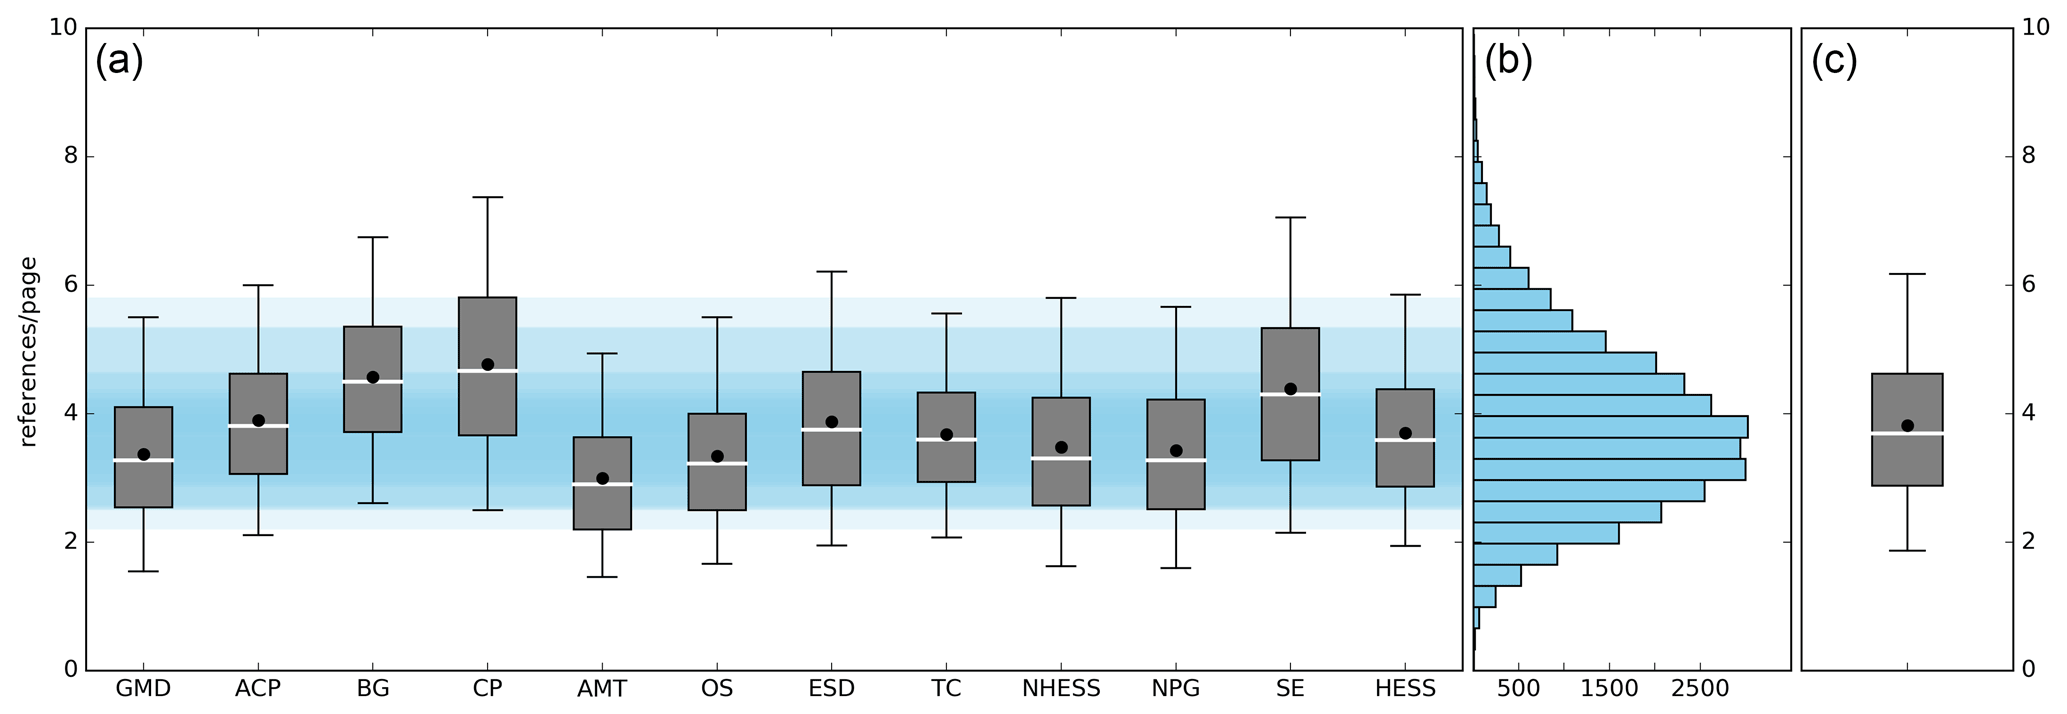
Figure 2(a) Box plot of numbers of references per page. The box represents the distribution quartiles (25 % and 75 %); the white lines are the medians, and the black dots are the averages. The bars represent the 90 % confidence levels. The abbreviation of the respective journal is listed on the bottom. The light blue area represents the overlap of the 25 %–75 % quartiles range for all the journals. (b) Probability density histograms of numbers of references per page for all the papers from all journals. (c) Box plot of numbers of references per page as on the left but for all papers from all journals.
For each journal, the average number of pages and the number of references were calculated, and the results are presented in Table 3. The average numbers of pages and references can exhibit strong variations between the journals, with differences of up to 60 %. The longest papers appear on average in GMD, with 19 pages, while the shortest were published in NPG with 12 pages. NPG also exhibits the lowest number of references per paper (i.e. 40 references per paper), while CP has the highest, with 77 references per paper on average.
Table 3Average numbers of pages, references and references per page (Refs. per page) for different EGU journals for all analysed papers. The range at 90 % confidence level is listed in parentheses.

Finally, the average reference densities for each journal (based on the reference density for each article) have been estimated (see Table 3 and Fig. 2). The number of references per page ranges from 3.00 to 4.77, for AMT and CP, respectively. Despite the differences in reference number or page distribution between the journals, the numbers of reference per page are statistically similar for all journals.
The reference density for each journal displays a classical log-normal distribution. Combining all the reference density distributions also results (to a good approximation) a log-normal distribution (Mitchell, 1968; Cobb et al., 2012; Dufresne, 2008). From this, we estimated the overall reference density and obtained an average of 3.82 references per page with a confidence level of 90 % between 1.87 and 6.18 references per page.
It is difficult to establish the cause of the relationship between pages and references. Although it is clear that the number of pages and the number of references in a paper influence each other positively, they are influenced both directly and indirectly by multiple factors, including, foe example, the number of authors (see Abt and Garfield, 2002). Nevertheless, here we showed that the journal layout plays an essential role in defining this ratio, as this remains constant between all the OA EGU journals, independently of the research field, and therefore substantially confirming the findings of Abt and Garfield (2002).
The importance of references in scientific journals has been clearly established. In this work we took advantage of the OA EGU journals, which, although they cover different areas in geoscience, share the same layout, thereby allowing for a direct comparison. It is shown that in the period 2010–2020, the number of pages and the number of references has been increasing in a statistically significant way.
Different reasons may underlie this growth, such as open access to existing literature together with technological development which facilitates searching for relevant citations. Additionally, we suggested this growth to be especially strong in EGU journals, as geophysics is still a relatively immature field, with a growing number of researchers and, consequently, strong growth in the ensuing literature, which tends to be referenced increasingly in subsequent studies.
Despite the increases in publication length and number of references in all journals since 2010, the reference density (i.e. number of references per page) has remained remarkably constant. In addition, no statistical difference in reference density can be observed in any of the journals. The average number of references per published page was estimated based on all the published papers, which shows that the optimal reference density is 3.82 references per page (1.87–6.18 at 90 % confidence level). This work shows that the layout does influence the number of references per page, confirming previous work.
It has been shown that papers with a large number of references tend to be cited more (Lovaglia, 1991); here we showed that the number of references correlates with the length of the paper, suggesting that articles presenting work in more detail and with enhanced presentation of data or ideas tends to have a greater impact on subsequent literature. It is therefore important that a paper should be as long as it needs to be, with the authors able to describe their research in sufficient detail.
This work provides an indication for authors preparing their manuscript for EGU journals, suggesting how many references are “about right” in a paper. This is especially important for less experienced authors, as it shows if their citation strategy fits with the existing body of literature. Furthermore, reviewers or editors should be particularly careful in evaluating manuscripts whose reference density is outside the range 1.87–6.18, as this indicates a non-standard (or outlying) manuscript with an uncommonly high (or low) number of references.
The code for analysis is available upon request to the contact author.
The data used in this work are freely available under Creative Commons licence (CC BY 4.0) on each EGU journal website.
The contact author has declared that there are no competing interests.
Publisher’s note: Copernicus Publications remains neutral with regard to jurisdictional claims in published maps and institutional affiliations.
The author would like to thank Ulrich Pöschl for the constructive discussion, John Crowley for his support and help, and Sam Illingworth for the suggestions for improvements.
This paper was edited by Sam Illingworth and reviewed by two anonymous referees.
Abt, H. A. and Garfield, E.: Is the relationship between numbers of references and paper lengths the same for all sciences?, J. Am. Soc. Inf. Sci. Tec., 53, 1106–1112, https://doi.org/10.1002/asi.10151, 2002. a, b, c, d
Anger, J.: Should there be a recommended limit to the number of references in a scientific article?, Sao Paulo Med. J., 117, 42–43, 1999. a
Arce Acuña, M. and Aoki, T.: Tree-based mesh-refinement GPU-accelerated tsunami simulator for real-time operation, Nat. Hazards Earth Syst. Sci., 18, 2561–2602, https://doi.org/10.5194/nhess-18-2561-2018, 2018. a, b
Beniston, M., Farinotti, D., Stoffel, M., Andreassen, L. M., Coppola, E., Eckert, N., Fantini, A., Giacona, F., Hauck, C., Huss, M., Huwald, H., Lehning, M., López-Moreno, J.-I., Magnusson, J., Marty, C., Morán-Tejéda, E., Morin, S., Naaim, M., Provenzale, A., Rabatel, A., Six, D., Stötter, J., Strasser, U., Terzago, S., and Vincent, C.: The European mountain cryosphere: a review of its current state, trends, and future challenges, The Cryosphere, 12, 759–794, https://doi.org/10.5194/tc-12-759-2018, 2018. a
Biglu, M.: The influence of references per paper in the SCI to Impact Factors and the Matthew Effect, Scientometrics, 74, 453–470, 2008. a
Bornmann, L. and Mutz, R.: Growth rates of modern science: A bibliometric analysis based on the number of publications and cited references, J. Assoc. Inf. Sci. Tech., 66, 2215–2222, 2015. a
Cheviron, B. and Moussa, R.: Determinants of modelling choices for 1-D free-surface flow and morphodynamics in hydrology and hydraulics: a review, Hydrol. Earth Syst. Sci., 20, 3799–3830, https://doi.org/10.5194/hess-20-3799-2016, 2016. a
Ciais, P., Dolman, A. J., Bombelli, A., Duren, R., Peregon, A., Rayner, P. J., Miller, C., Gobron, N., Kinderman, G., Marland, G., Gruber, N., Chevallier, F., Andres, R. J., Balsamo, G., Bopp, L., Bréon, F.-M., Broquet, G., Dargaville, R., Battin, T. J., Borges, A., Bovensmann, H., Buchwitz, M., Butler, J., Canadell, J. G., Cook, R. B., DeFries, R., Engelen, R., Gurney, K. R., Heinze, C., Heimann, M., Held, A., Henry, M., Law, B., Luyssaert, S., Miller, J., Moriyama, T., Moulin, C., Myneni, R. B., Nussli, C., Obersteiner, M., Ojima, D., Pan, Y., Paris, J.-D., Piao, S. L., Poulter, B., Plummer, S., Quegan, S., Raymond, P., Reichstein, M., Rivier, L., Sabine, C., Schimel, D., Tarasova, O., Valentini, R., Wang, R., van der Werf, G., Wickland, D., Williams, M., and Zehner, C.: Current systematic carbon-cycle observations and the need for implementing a policy-relevant carbon observing system, Biogeosciences, 11, 3547–3602, https://doi.org/10.5194/bg-11-3547-2014, 2014. a
Cobb, B. R., Rumí, R., and Salmerón, A.: Approximating the distribution of a sum of log-normal random variables, Stat. Comput., 16, 293–308, 2012. a
Dufresne, D.: Sums of lognormals, in: Proceedings of the 43rd Actuarial Research Conference, 14–16 August 2008, University of Regina, Regina, Canada, 1–6, 2008. a
Feistel, R.: Thermodynamic properties of seawater, ice and humid air: TEOS-10, before and beyond, Ocean Sci., 14, 471–502, https://doi.org/10.5194/os-14-471-2018, 2018. a, b
Feistel, R., Wright, D. G., Kretzschmar, H.-J., Hagen, E., Herrmann, S., and Span, R.: Thermodynamic properties of sea air, Ocean Sci., 6, 91–141, https://doi.org/10.5194/os-6-91-2010, 2010. a
Fox, C. W., Paine, C. T., and Sauterey, B.: Citations increase with manuscript length, author number, and references cited in ecology journals, Ecol. Evol., 6, 7717–7726, 2016. a
Freudenthaler, V.: About the effects of polarising optics on lidar signals and the Δ90 calibration, Atmos. Meas. Tech., 9, 4181–4255, https://doi.org/10.5194/amt-9-4181-2016, 2016. a
Ghil, M., Yiou, P., Hallegatte, S., Malamud, B. D., Naveau, P., Soloviev, A., Friederichs, P., Keilis-Borok, V., Kondrashov, D., Kossobokov, V., Mestre, O., Nicolis, C., Rust, H. W., Shebalin, P., Vrac, M., Witt, A., and Zaliapin, I.: Extreme events: dynamics, statistics and prediction, Nonlin. Processes Geophys., 18, 295–350, https://doi.org/10.5194/npg-18-295-2011, 2011. a, b
Heinze, C., Eyring, V., Friedlingstein, P., Jones, C., Balkanski, Y., Collins, W., Fichefet, T., Gao, S., Hall, A., Ivanova, D., Knorr, W., Knutti, R., Löw, A., Ponater, M., Schultz, M. G., Schulz, M., Siebesma, P., Teixeira, J., Tselioudis, G., and Vancoppenolle, M.: ESD Reviews: Climate feedbacks in the Earth system and prospects for their evaluation, Earth Syst. Dynam., 10, 379–452, https://doi.org/10.5194/esd-10-379-2019, 2019. a, b
Hollis, C. J., Dunkley Jones, T., Anagnostou, E., Bijl, P. K., Cramwinckel, M. J., Cui, Y., Dickens, G. R., Edgar, K. M., Eley, Y., Evans, D., Foster, G. L., Frieling, J., Inglis, G. N., Kennedy, E. M., Kozdon, R., Lauretano, V., Lear, C. H., Littler, K., Lourens, L., Meckler, A. N., Naafs, B. D. A., Pälike, H., Pancost, R. D., Pearson, P. N., Röhl, U., Royer, D. L., Salzmann, U., Schubert, B. A., Seebeck, H., Sluijs, A., Speijer, R. P., Stassen, P., Tierney, J., Tripati, A., Wade, B., Westerhold, T., Witkowski, C., Zachos, J. C., Zhang, Y. G., Huber, M., and Lunt, D. J.: The DeepMIP contribution to PMIP4: methodologies for selection, compilation and analysis of latest Paleocene and early Eocene climate proxy data, incorporating version 0.1 of the DeepMIP database, Geosci. Model Dev., 12, 3149–3206, https://doi.org/10.5194/gmd-12-3149-2019, 2019. a, b
Jaunich, M.: Editorial: The average number of references per article published in Polymer Testing over the years, Polym. Test., 68, A1–A2, https://doi.org/10.1016/j.polymertesting.2018.05.034, 2018. a
Kern, S., Lavergne, T., Notz, D., Pedersen, L. T., Tonboe, R. T., Saldo, R., and Sørensen, A. M.: Satellite passive microwave sea-ice concentration data set intercomparison: closed ice and ship-based observations, The Cryosphere, 13, 3261–3307, https://doi.org/10.5194/tc-13-3261-2019, 2019. a
Kirchner, J. W.: Quantifying new water fractions and transit time distributions using ensemble hydrograph separation: theory and benchmark tests, Hydrol. Earth Syst. Sci., 23, 303–349, https://doi.org/10.5194/hess-23-303-2019, 2019. a
Leimu, R. and Koricheva, J.: What determines the citation frequency of ecological papers?, Trends Ecol. Evol., 20, 28–32, 2005. a
Lovaglia, M. J.: Predicting citations to journal articles: The ideal number of references, Am. Sociol., 22, 49–64, 1991. a, b
Milojević, S.: How are academic age, productivity and collaboration related to citing behavior of researchers?, PloS one, 7, e49176 https://doi.org/10.1371/journal.pone.0049176, 2012. a
Mitchell, R. L.: Permanence of the log-normal distribution, JOSA, 58, 1267–1272, 1968. a
Nicolaisen, J. and Frandsen, T. F.: Number of references: a large-scale study of interval ratios, Scientometrics, 126, 259–285, 2021. a
PAGES Hydro2k Consortium: Comparing proxy and model estimates of hydroclimate variability and change over the Common Era, Clim. Past, 13, 1851–1900, https://doi.org/10.5194/cp-13-1851-2017, 2017. a, b
Persson, O., Glänzel, W., and Danell, R.: Inflationary bibliometric values: The role of scientific collaboration and the need for relative indicators in evaluative studies, Scientometrics, 60, 421–432, 2004. a
Pöschl, U.: Interactive journal concept for improved scientific publishing and quality assurance, Learn. Publ., 17, 105–113, 2004. a
Pöschl, U.: Multi-stage open peer review: scientific evaluation integrating the strengths of traditional peer review with the virtues of transparency and self-regulation, Front. Comput. Neurosc., 6, 33, https://doi.org/10.3389/fncom.2012.00033, 2012. a
Ramirez-Llodra, E., Brandt, A., Danovaro, R., De Mol, B., Escobar, E., German, C. R., Levin, L. A., Martinez Arbizu, P., Menot, L., Buhl-Mortensen, P., Narayanaswamy, B. E., Smith, C. R., Tittensor, D. P., Tyler, P. A., Vanreusel, A., and Vecchione, M.: Deep, diverse and definitely different: unique attributes of the world's largest ecosystem, Biogeosciences, 7, 2851–2899, https://doi.org/10.5194/bg-7-2851-2010, 2010. a
Sánchez-Gil, S., Gorraiz, J., and Melero-Fuentes, D.: Reference density trends in the major disciplines, J. Informetr., 12, 42–58, 2018. a
Sander, R.: Compilation of Henry's law constants (version 4.0) for water as solvent, Atmos. Chem. Phys., 15, 4399–4981, https://doi.org/10.5194/acp-15-4399-2015, 2015. a, b, c, d, e
Schmalholz, S. M. and Mancktelow, N. S.: Folding and necking across the scales: a review of theoretical and experimental results and their applications, Solid Earth, 7, 1417–1465, https://doi.org/10.5194/se-7-1417-2016, 2016. a
Takahama, S., Dillner, A. M., Weakley, A. T., Reggente, M., Bürki, C., Lbadaoui-Darvas, M., Debus, B., Kuzmiakova, A., and Wexler, A. S.: Atmospheric particulate matter characterization by Fourier transform infrared spectroscopy: a review of statistical calibration strategies for carbonaceous aerosol quantification in US measurement networks, Atmos. Meas. Tech., 12, 525–567, https://doi.org/10.5194/amt-12-525-2019, 2019. a, b
Tetreault, J. L. and Buiter, S. J. H.: Future accreted terranes: a compilation of island arcs, oceanic plateaus, submarine ridges, seamounts, and continental fragments, Solid Earth, 5, 1243–1275, https://doi.org/10.5194/se-5-1243-2014, 2014. a
Tsujino, H., Urakawa, L. S., Griffies, S. M., Danabasoglu, G., Adcroft, A. J., Amaral, A. E., Arsouze, T., Bentsen, M., Bernardello, R., Böning, C. W., Bozec, A., Chassignet, E. P., Danilov, S., Dussin, R., Exarchou, E., Fogli, P. G., Fox-Kemper, B., Guo, C., Ilicak, M., Iovino, D., Kim, W. M., Koldunov, N., Lapin, V., Li, Y., Lin, P., Lindsay, K., Liu, H., Long, M. C., Komuro, Y., Marsland, S. J., Masina, S., Nummelin, A., Rieck, J. K., Ruprich-Robert, Y., Scheinert, M., Sicardi, V., Sidorenko, D., Suzuki, T., Tatebe, H., Wang, Q., Yeager, S. G., and Yu, Z.: Evaluation of global ocean–sea-ice model simulations based on the experimental protocols of the Ocean Model Intercomparison Project phase 2 (OMIP-2), Geosci. Model Dev., 13, 3643–3708, https://doi.org/10.5194/gmd-13-3643-2020, 2020. a
Ucar, I., López-Fernandino, F., Rodriguez-Ulibarri, P., Sesma-Sanchez, L., Urrea-Micó, V., and Sevilla, J.: Growth in the number of references in engineering journal papers during the 1972–2013 period, Scientometrics, 98, 1855–1864, 2014. a, b
Volkwein, A., Schellenberg, K., Labiouse, V., Agliardi, F., Berger, F., Bourrier, F., Dorren, L. K. A., Gerber, W., and Jaboyedoff, M.: Rockfall characterisation and structural protection – a review, Nat. Hazards Earth Syst. Sci., 11, 2617–2651, https://doi.org/10.5194/nhess-11-2617-2011, 2011. a