the Creative Commons Attribution 4.0 License.
the Creative Commons Attribution 4.0 License.
 | 06 Nov 2020
ElectroMagnetic Music: a new tool for attracting people's interest in Geosciences, while sensitizing them to planet sustainability
Antonio Menghini
Stefano Pontani
Vincenzo Sapia
Tiziana Lanza
In recent years, different sonification methods used to organize scientific work have come out of the scientific realm and crossed into other areas for purposes other than those pursued strictly by scientific research. ElectroMagnetic Music (EMusic), a project born in Italy, fits fully into this area. By transforming into musical pitches the voltage response collected by the transient electromagnetic method (TEM), a well-known geophysical tool for subsurface exploration, this novel approach enables us to extract musical pieces reflecting the geological setting and to provide a soundtrack (i.e. the soundscape or the audio component of a landscape). The soundscape becomes the basis from which a dedicated band improvises jazz music. Besides being a new method for creating music, the project not only has the ambitious goal of attracting people to Earth sciences and their investigative methods but also of raising awareness of the environmental problems that characterize geological sites through the music. In this work, we explore the EMusic experiences gained as a live band travelling around the world. We also report some preliminary data on people's reactions and anticipate some future plans to better assess the potential of the method as a good science communication tool.
- Article
(4618 KB) - Full-text XML
- BibTeX
- EndNote


Music is powerful in that it sensitizes people, thanks to its capacity to involve everybody, without the barriers of language, culture or religion. Most recently, sonification of scientific data has become more and more popular, obtaining great visibility in the media. Some recent approaches include the sonification of gravitational waves (Hughes, 2016), planet orbits (Quinton and Benyon, 2016), global temperature variations (Hilgren, 2019), seismic noise (Avanzo et al., 2010), earthquakes (Michael, 2013) and geophysical data (Dell'Aversana et al., 2016). Following this trend, ElectroMagnetic Music (EMusic) is the first project that, by utilizing the electromagnetic (EM) responses of the Earth, provides a new method for sonifying data strictly related to the geological nature of the subsoil. From the available literature, sonification is defined as the use of non-speech audio to convey information or to feel data. In this way, sonification turns to representational techniques in which data sets or selected features of a specific output signal are mapped into audio signals. This concept has an old origin; it was exploited for capturing the main structure of complex data clustering to make it more discernible for humans. To date, sonification has become an almost immediate tool for perceiving some physical parameters. For instance, it is widely used in medicine for monitoring patient health parameters and for detecting the level of radioactive concentration through a Geiger counter or the type of buried ferrous/metal objects by means of a metal detector, among many others. All these examples could then be reasonably considered as a process of sonification in which we are capable of translating a specific flow of data derived from a physical excitation of natural materials, by means of external source of energy, into audio signals. Therefore, we are able to identify something that we cannot directly see by listening to its signal.
Sonification is different from audification. With the second term, we identify an auditory display technique for representing a sequence of data values as sound. By definition, it is described as a “direct translation of a data waveform to the audible domain” (Roger, 2009), so that it typically requires large data sets with periodic components. Nevertheless, both sonification and audification are representational techniques in which data sets are turned into audio signals. Both are appropriate tools for perceiving when the information being displayed changes in time (i.e. climate change) or intensity (i.e. health parameters).
However, their relationship can be demonstrated in the sense that data values in some sonifications that directly define audio signals are called audification. From Hermann and Ritter (1999), we can understand also how sonification is a good tool for rapid screening of complex clustering data so that it has a higher potential for interacting with the raw records, as a preliminary step, and also in conjunction with their visualization.
Anyway, a detailed overview of sonification in general, and the status of the research in this specific field, is beyond the scope of this paper so, for an in-depth discussion of sonification and audification concepts, the reader can refer to many other papers already published (such as Kramer et al., 2010; Walker and Nees, 2011; de Mora et al., 2020).
In recent years both of these techniques have come out of the scientific realm and crossed into other areas for purposes other than those previously described. Sonification is used often in the artistic sphere as a valuable vehicle for bringing science to the general public. We set out to use EMusic not only to excite people and to have fun with musicians but also to bring people closer to Earth sciences and their investigative methods.
To do this, we directly investigate down to the subsurface, looking at a specific physical property of the Earth. Thus, it is not out of place to claim that we can extract the effective sound of the Earth. In fact, the source of our sonification process depends upon the electrical behaviour of the rocks (i.e. the resistivity).
Similar to other sonification processes, we adopt a mathematical rule that allows us to translate the geophysical data into audible frequencies, following a procedure codified by Menghini and Pontani (2016). It would be, therefore, more correct to say that we can produce pitches rather than sounds. The musical notes can be played by any kind of instrument and also by a human voice. The involvement of the musicians is direct as they have to arrange an improvisation or a composition by using these pitches provided by the Earth; the EMusic data are the bricks that will be used to build any musical performance (some examples have been reported by Menghini, 2016, 2018; Duncombe, 2019). This allows us to achieve an effective connection between art (music) and science (geology) in a way that can be easily appreciated by a non-expert audience. Geoscientists actively participate in the composition of the work, so they can be considered as composers, or, rather, as the medium between the Earth and the performers by providing some keywords on the history of the geological site inspiring the musicians.
EMusic has been conceived to translate, into music, the data acquired by a specific scientific instrument normally used for many geoscience applications. We believe that this technique has great potential in terms of science and art communication. To obtain a first taste of this potential, in the first phase, our agenda included mainly live events at several geo-sites. We performed all around the world, in close co-operation with musicians, to promote the EMusic. We also used the internet to spread our method of sonification, the events performed and the ones scheduled. In the near future, we intend to bring the project to schools to involve students in Earth sciences and planet sustainability, while introducing them to a different approach to music.
For the time being, as a live band, we are satisfied as the project has obtained great interest from the scientific and musical communities. The European Geosciences Union (EGU) General Assembly in Vienna, Austria, invited us to play twice (in 2017 and 2018). Geoscience Australia invited us to play in Canberra and Perth. The American Geophysical Union (AGU) Centennial Grant awarded us with a 5 h sound installation based on airborne EM data collected in the Colorado Mountains. Under the patronage of the city of Naples, the geological survey of the Campania district and in collaboration with the Vesuvius National Park, we played on the top of the Vesuvius volcano. We also performed at the Istituto Nazionale di Geofisica e Vulcanologia (INGV) open day. We carried out a tour of seven stages, namely “Sounds from the Geology of Italy”, based on the sonification of EM data collected in some of the most beautiful natural and cultural sites, involving famous international jazzists like Enrico Rava and Francesco Cafiso.
This paper describes, in detail, our method of sonification and refers to the events performed in collaboration with INGV. We describe also the potentialities of the methods from a science communication perspective, even if, so far, we have not conducted an evaluation. Nevertheless, as previously said, we plan, in the near future, to experiment with the method in schools in order to have the opportunity to extensively evaluate its efficaciousness in terms of attracting students' interest to geosciences while sensitizing them to planet sustainability. To this end, we are at present implementing a project named Georisonanze (Georesonances).
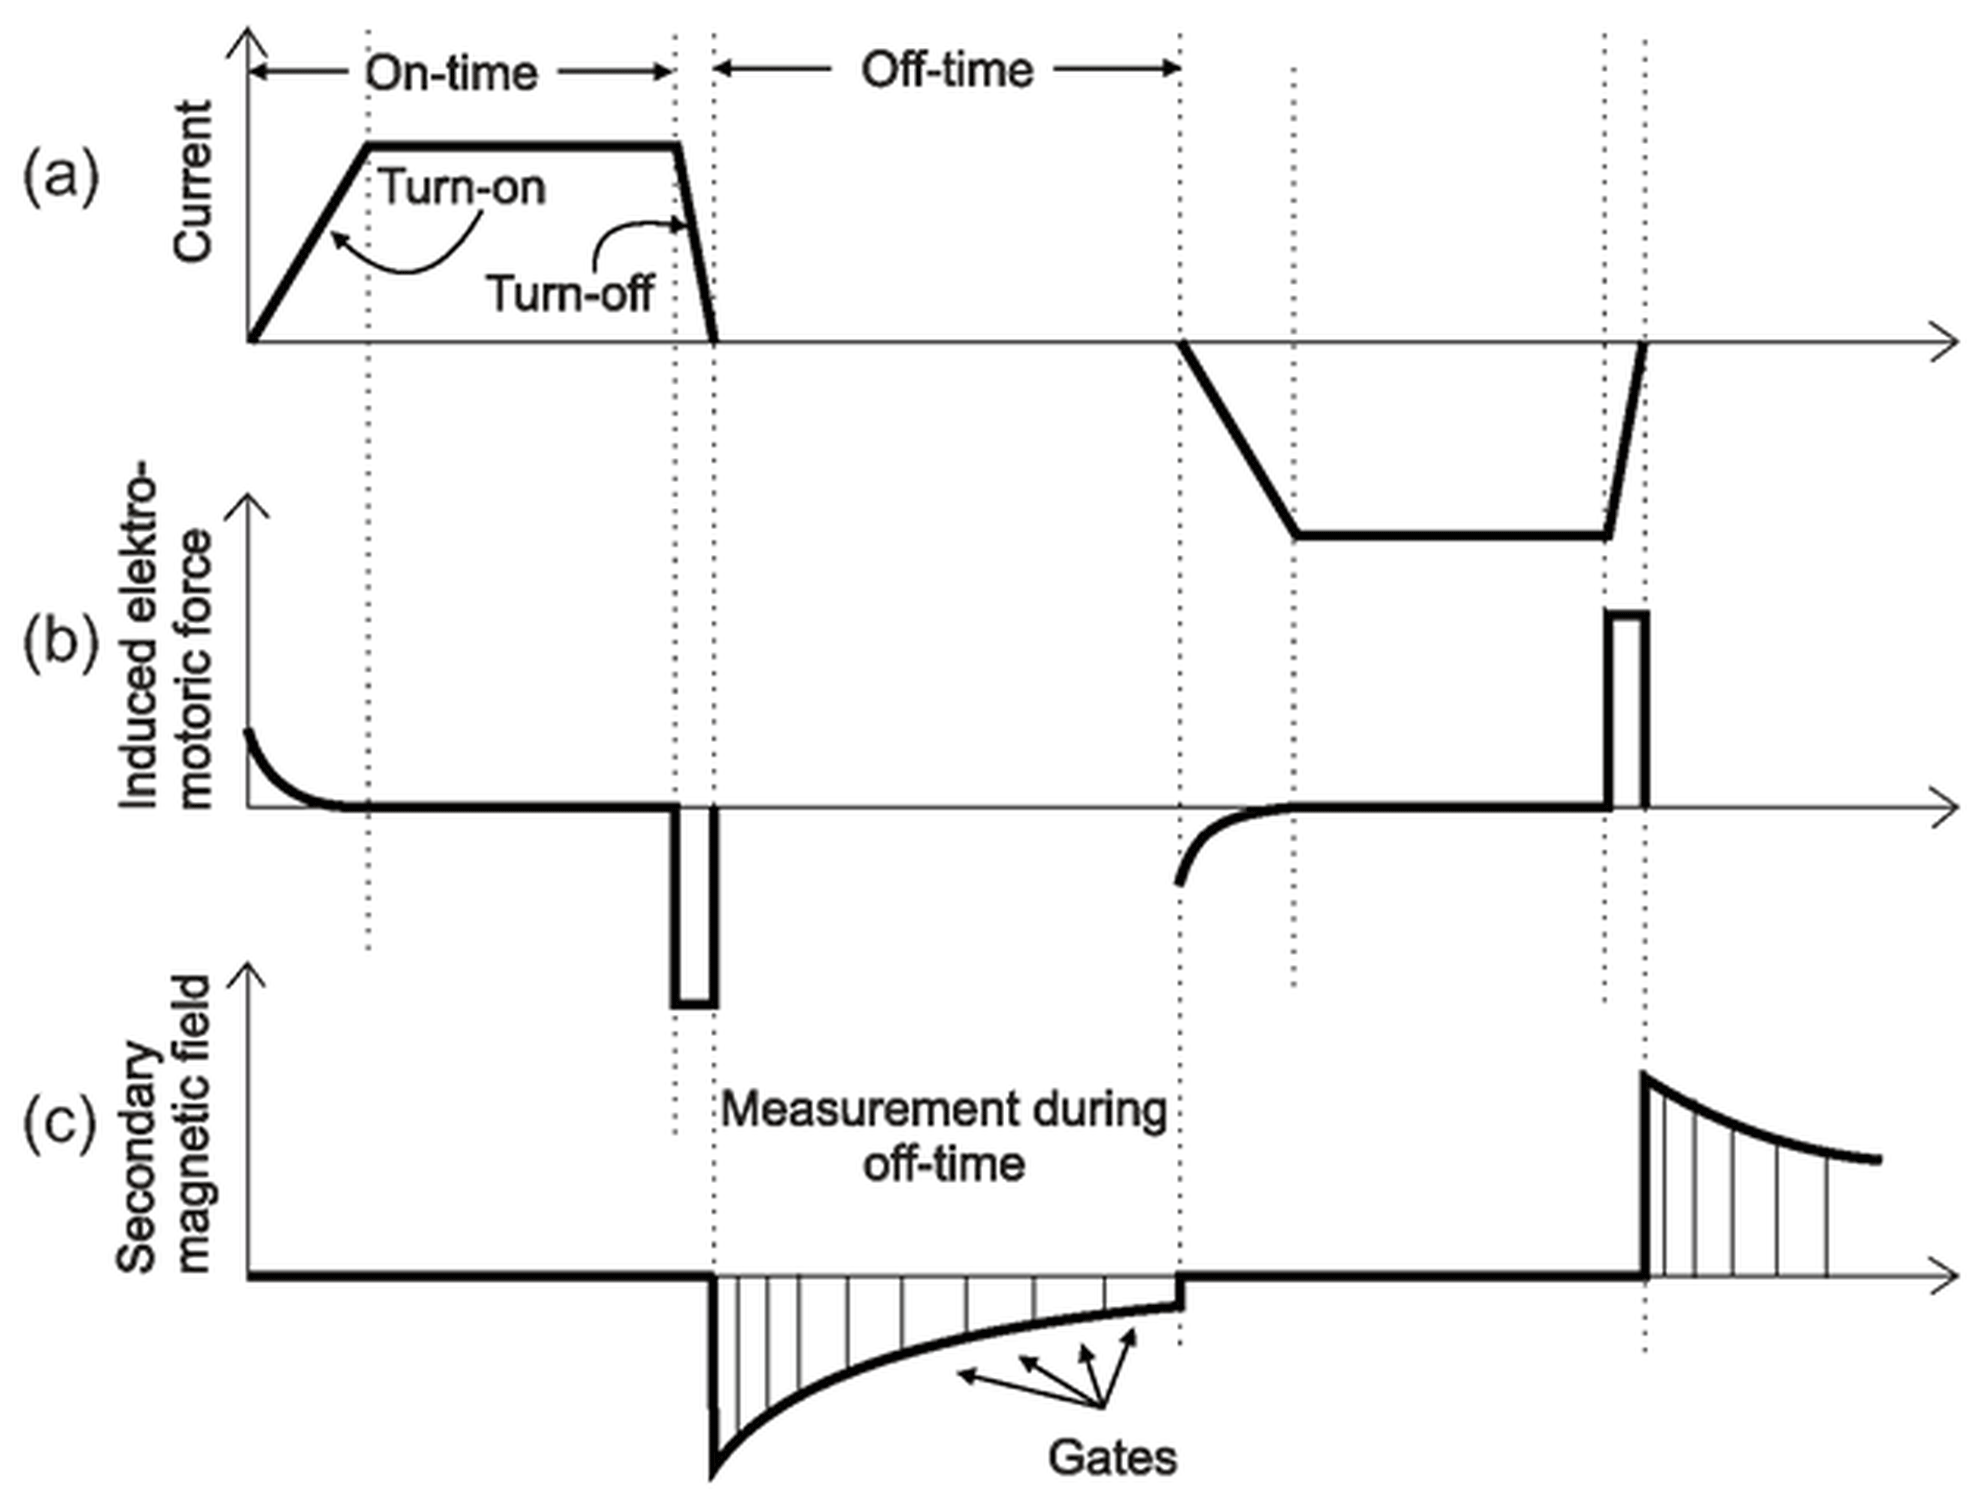
Figure 1(a) Current injected in the transmitter loop. (b) The induced electromotoric force in the ground. (c) The secondary magnetic field measured in the receiver coil. The listening time is during the off time (adapted from Christiansen et al., 2006).
3.1 TEM method
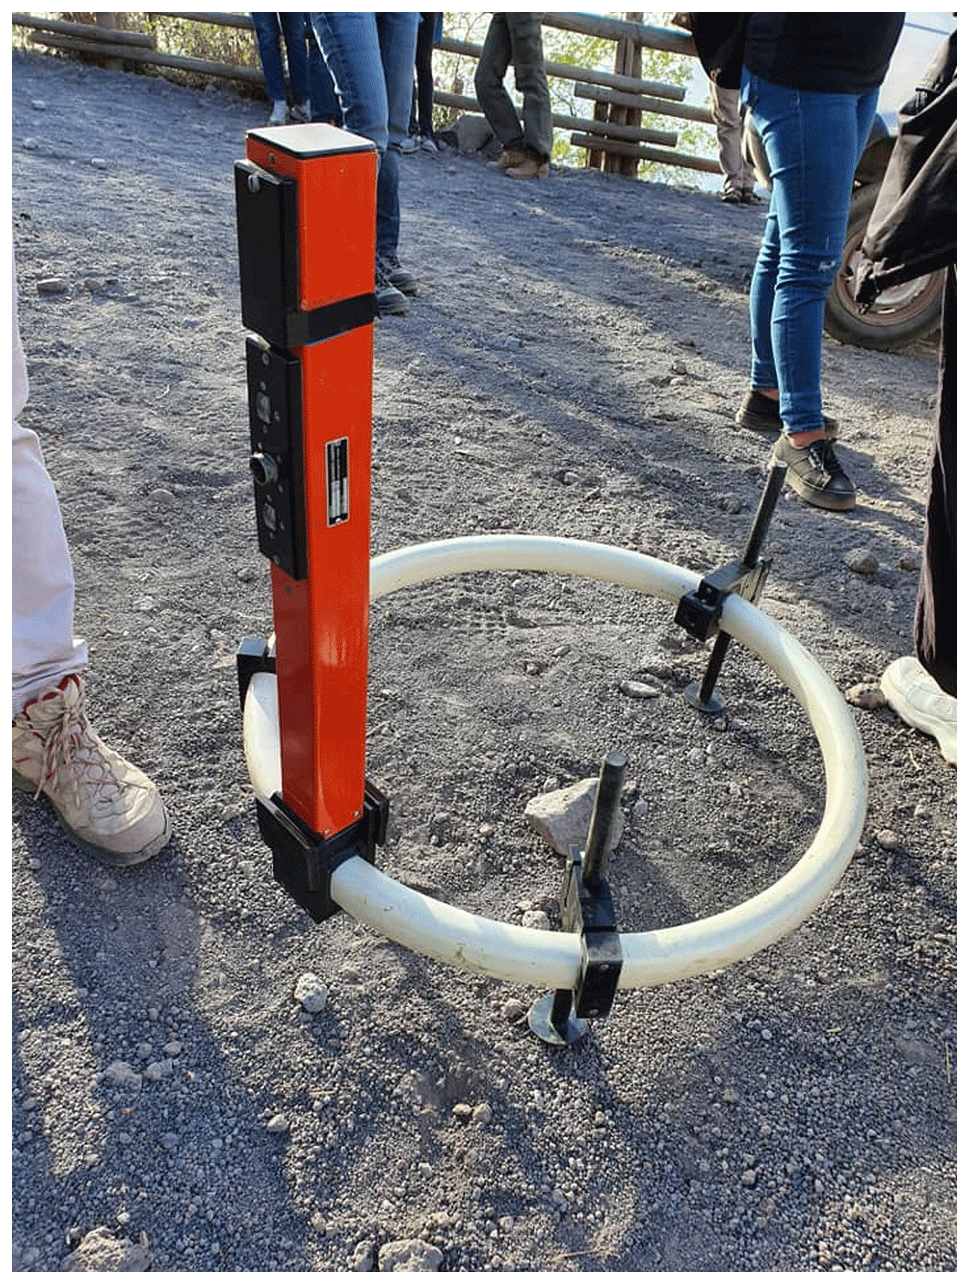
Before describing our sonification method, we dedicate a paragraph to the geophysical method at the basis of it. The transient EM method (TEM) is a well-known geophysical technique, widely applied in the field of geoscience since the 1950s, for detecting mining and groundwater resources (Fitterman and Stewart, 1986). TEM measurements can be performed directly on the ground or through a sophisticated airborne system (AEM hereinafter). The main difference is that AEM is able to map wide areas in a relatively short time. The collected TEM data can be used in the construction of accurate 3D geological models (Sapia et al., 2015a) after careful data processing and system calibration (Viezzoli et al., 2013; Sapia et al., 2015b). Nevertheless, ground TEM data are a valuable tool for mapping the subsurface structure in many fields of application such as the geological mapping of seismic areas (Civico et al., 2017; Villani et al., 2019) to groundwater studies (Auken et al., 2003), although the recovered models differ in terms of structure resolutions compared to the AEM ones due to a limited number of measured field data (Sapia et al., 2014). The electromagnetic induction theory, which is at the base of TEM methods, is well described in Nabighian and Macnae (1991). In general, the instrumentation is characterized by two main components, namely a transmitter (square loop) and a receiver (induction coil). A current is forced to flow in the loop, thus generating a magnetic field which is stable inside and outside the loop, unless current changes occur. The current is then suddenly turned off, and this generates a change in the magnetic field (i.e. rapid magnetic flux variation), which, in turn, induces a current to flow in the ground (Fig. 1). The induction currents (known as eddy current) diffuse downward and outward at a decreasing rate, which strictly depends on the electrical properties of the medium (i.e. its resistivity). The higher the resistivity, the faster the current decay and the lower the signal strength (voltage). The receiver coil (Fig. 2) records the rate of change in the magnetic field produced by the decay in the eddy currents by means of several time gates, which are specifically designed to accurately catch the transient curve in the form of voltage values over time (Fig. 1c).
Therefore, the sampling of this response is achieved by means of a series of gates having different widths which increase with time as the signal becomes weaker and weaker as it goes down. Since the voltage response for each time gate is assigned to its centre, it follows that the data are spaced so that they become more and more distant from each other.
3.2 Data sonification
The listening time that we use to sonify the Earth response is the period in which the system is off (Fig. 1c) and no currents are flowing into the wire (off time).
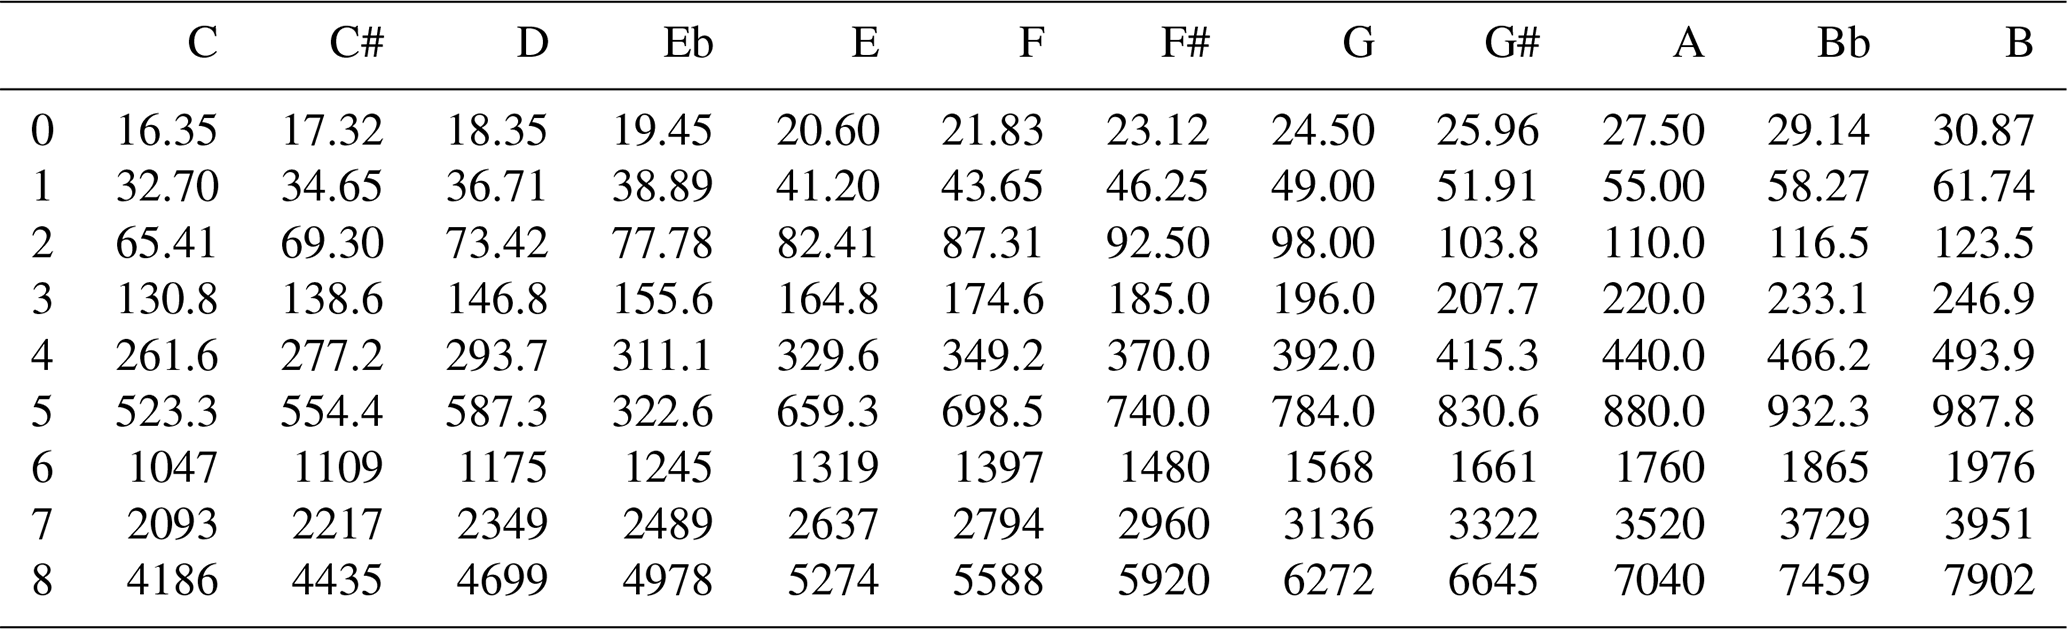
Regarding sonification's rules, we need to start by considering that the sound frequency associated to musical pitches is distributed on a non-linear scale (according to log2). Table 1 shows the relationship between frequency and pitch according to the equal tempered scale (12 note scale).
The Musical Instrument Digital Interface (MIDI) pitch values are linked, with frequency, through the following equations:
where f is the frequency and m is the MIDI pitch.
In order to listen to the sonified voltage response, we need to normalize the geophysical values so that they stay within the MIDI range between 0 and 127 MIDI units and correspond to the frequency range between 8176 and 12 543 854 Hz. Actually, the audible range is limited to 10–110 MIDI units. To convert geophysical data into musical notes, the EMusic exploits this simple formula, as follows:
where XN is the normalized value, X is the measured voltage value, XMAX is the maximum voltage value and XMIN is the minimum voltage value.
The choice of XMAX and XMIN is a key point, and it was achieved after having considered a wide statistical assessment of EM data sets collected all over the world from very different geological contexts. The highest limit can be assigned to seawater (to which a resistivity of 0.2–0.3 Ωm corresponds), while the lowest one can be measured for highly resistive rocks (higher than 1000 Ωm). In order to make any sonified transients comparable, we prefer to use the same range of voltage, i.e. fixed values for a minimum and maximum response. This device allows us to compare different geological scenarios and different EM systems in an objective way. This approach can be similar to the choice of the edges in a colour scale used for imaging a physical parameter (e.g. resistivity). Of course, this means that we cannot exploit the full frequency range for any sounding. In the case of a highly conductive situation, we could stay within a narrow sequence of high tones, while, for a very resistive environment, we could obtain only low tones separated by wide intervals. It follows that anyone can immediately understand which geological scenario we are in simply by hearing the EMusic outcome. Based on these considerations, the values were fixed as XMAX=1 E-3 V/Am4 and XMIN=1 E-12 V/Am4.
Once the value of XN is obtained, we assign, for each sampling gate, the closest pitch in Table 1, as we prefer to adopt the equal tempered scale to make the music more appealing (at least for a standard Western listener). An alternative approach could be the use of microtones, i.e. musical notes that are not in the 12 note scale. In this case, any precise frequency drawn from the voltage response is used as it is, without any approximation. But, in this case, the musical performance can be carried out only by means of electronic instruments or by acoustic instruments with a different tuning.
Figure 3 shows a typical transient (i.e. the voltage response of the Earth expressed as V/m4A) as drawn from the field data reported in Table 2. The gates are displayed by using a linear scale for time. As the transient works out within a few milliseconds, we adopted a time expansion that can be chosen, depending on how long we want to arrange the composition (usually, we use values between 100 000 and 1 million). Otherwise, our ears would hear a single chord formed by all the gates/pitches. Indeed, this is true of the so-called flight mode we used this approach, as we have to handle several soundings collected during an airborne EM survey. In this particular kind of method, the data are acquired during a flight, so that a huge number of soundings can be sonified. An example was presented at the EGU 2017 General Assembly (Menghini and Pontani, 2017) in which a flight mode composition was arranged by using AEM data collected over Sierra Leone.
On the contrary, due to the large dynamic range, the voltages are shown on a log scale. Figure 3 refers to an airborne TEM sounding collected over the Selinunte temple in Sicily, and it was the first track of the concert we performed at EGU General Assembly in 2018. For each gate, we reported the corresponding pitches that were used by the musicians to improvise.
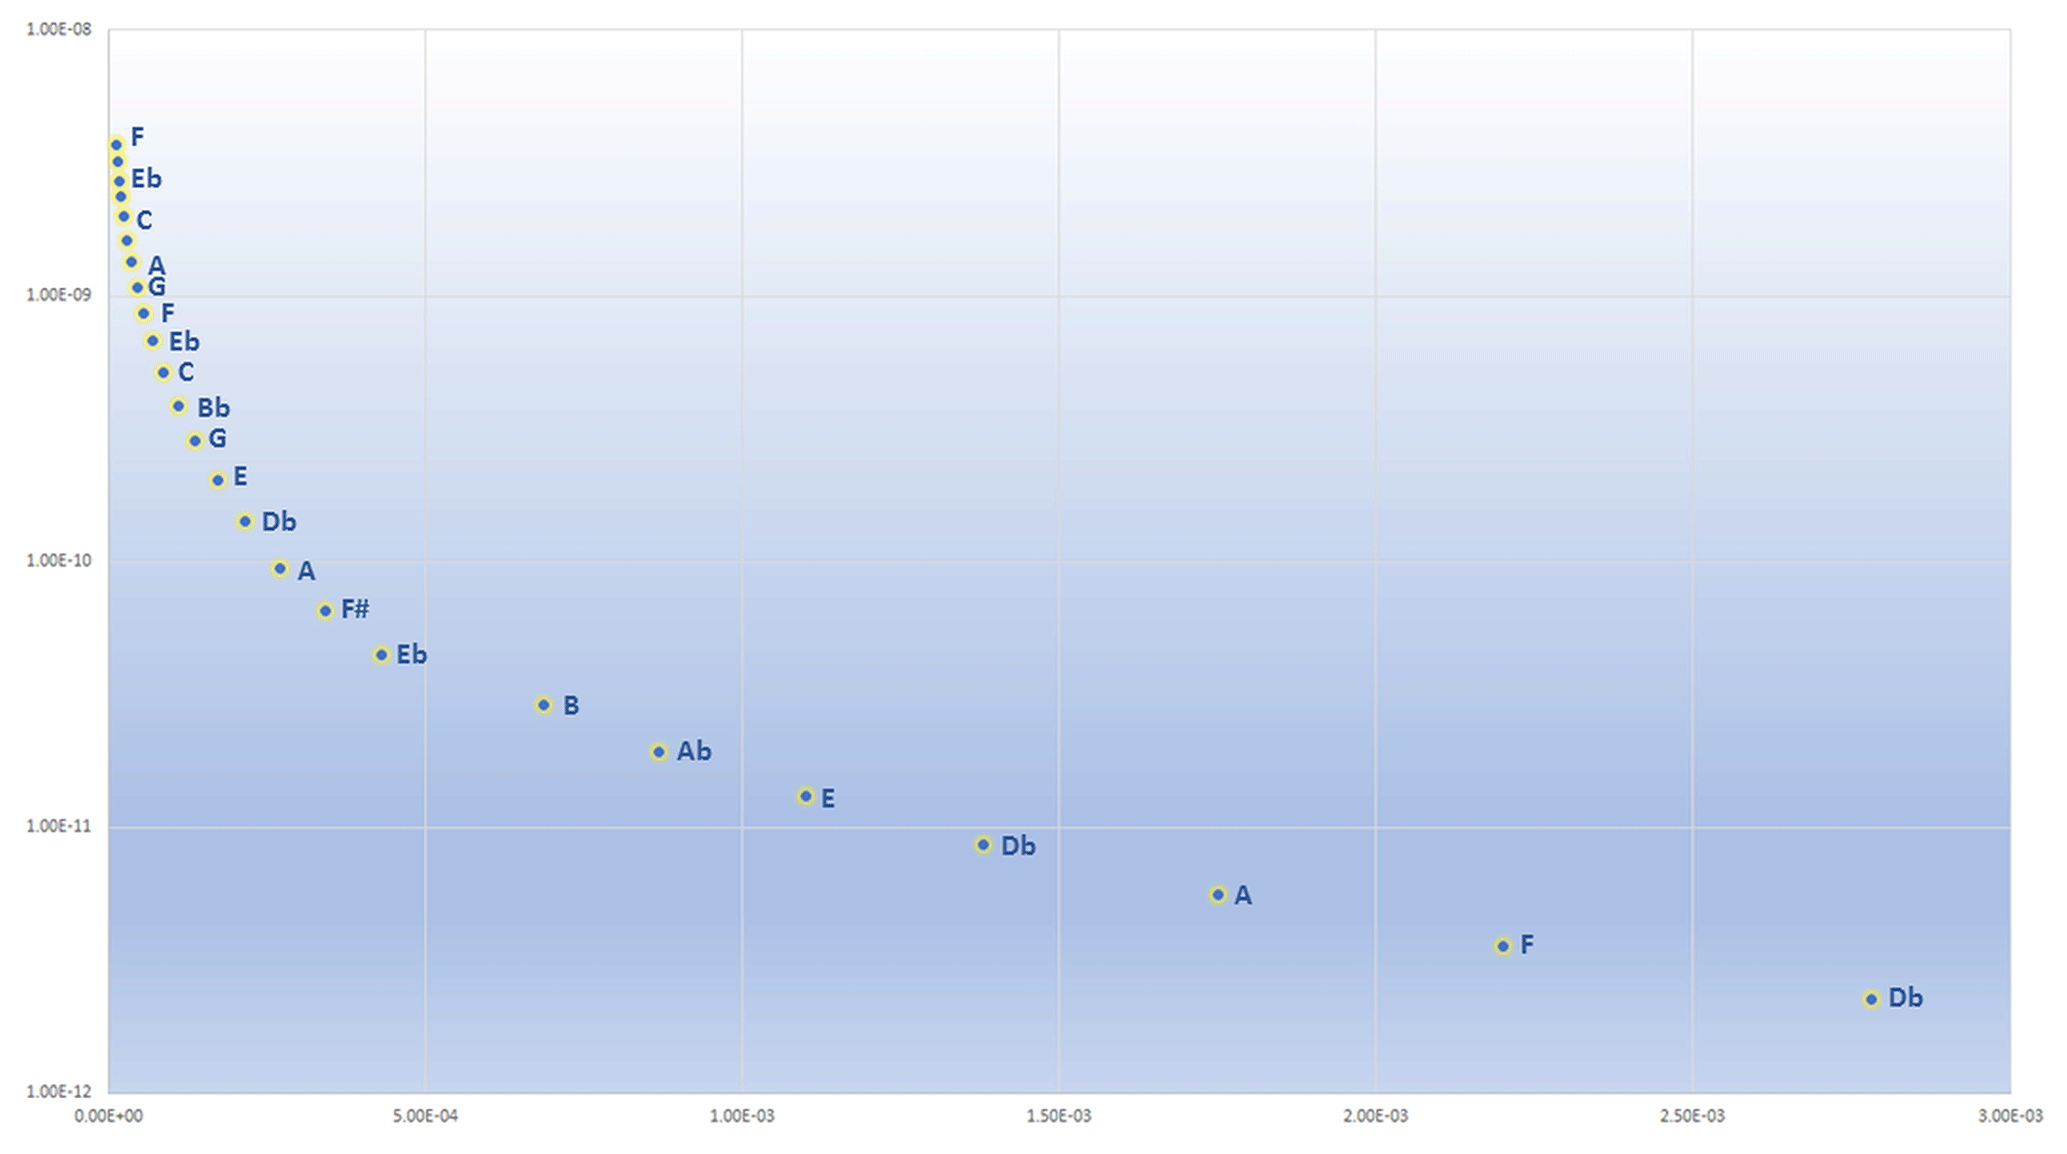
Figure 3Sonified transient of a TEM sounding collected over the Selinunte temple, Sicily. The y axis shows the normalized voltage response of the Earth (V/Am4), and the x axis shows the actual acquisition time of the geophysical instrument (in seconds).
Essentially, we can recognize four typical features of a pure EMusic composition (soundscape) as follows:
-
The pitch is directly proportional to the voltage response, i.e. the notes are produced by a conductive formation that produces a stronger response (e.g. clays or shales) and is higher than those extracted from a resistive rock (e.g. limestone or granite).
-
The pitches must become lower and lower as the voltage response becomes weaker and weaker.
-
The interval between two near pitches is linked to the resistivity of the material, i.e. it will be smaller (chromatism) in the case of conductive formation due to the slower decay, while it will be wider for resistive rocks where the eddy currents travel faster.
-
The execution time is dictated by the technical specifications of the geophysical instrument; hence, the first pitches will be closer and they will become ever more distant during the performance.
3.3 How EMusic shows are organized
As we stated, by describing some events that already took place (Sect. 5), an EMusic show requires an active role of geoscientists. During the concert, geoscientists introduce every track to prepare the audience for what they are going to hear. The concert in Ferento that we presented at the EGU General Assembly 2018 (for a video of the event, see Sect. 5.2) can be an example of how the event develops. On that occasion, the audience experienced a journey into the Earth by travelling into older and older geological formations. In introducing the first track, a geoscientist explained how the TEM method works and how geophysicists can model the subsurface by comparing the decay rate of the transient with the interval among pitches. During the second composition, the musicians began to interplay with the pitches provided by the Earth. We reversed the first track so that people listened to the return from the maximum exploration depth (in this case about 100 m) to the surface. The saxophonist and the guitarist were able to improvise over the EMusic base, by using the same pitches, in a sort of natural jam session, where the Earth was the band leader. Then, we analysed each geological formation by showing the musical mood provided by the relative pitches.
How do the musicians work with the obtained soundscapes? They can choose different modalities. One is to reverse the pure EMusic track. Starting from the deeper and late gates/pitches, the musicians have the possibility to stay tuned to the Earth's pitches during the return trip to the surface. As the saxophonist Marco Guidolotti played during this reversed part of Selinunte piece, the relative score has the form shown in Fig. 4 (notice that the pitches are translated into an Eb instrument, while the sonification produced notes in the C key). The musician chose to fix some chords that can be assigned by grouping the pitches so as to obtain some chords.
The whole piece can be listened to on YouTube (https://www.youtube.com/watch?v=qsTlMZsGoBE&feature=youtu.be, last access: September 2020), with the first half composed by using pure sonified data and the second one with the interplay of the saxophonist.
Table 2Voltage response of the Selinunte sounding and the corresponding transformation into MIDI and frequency.
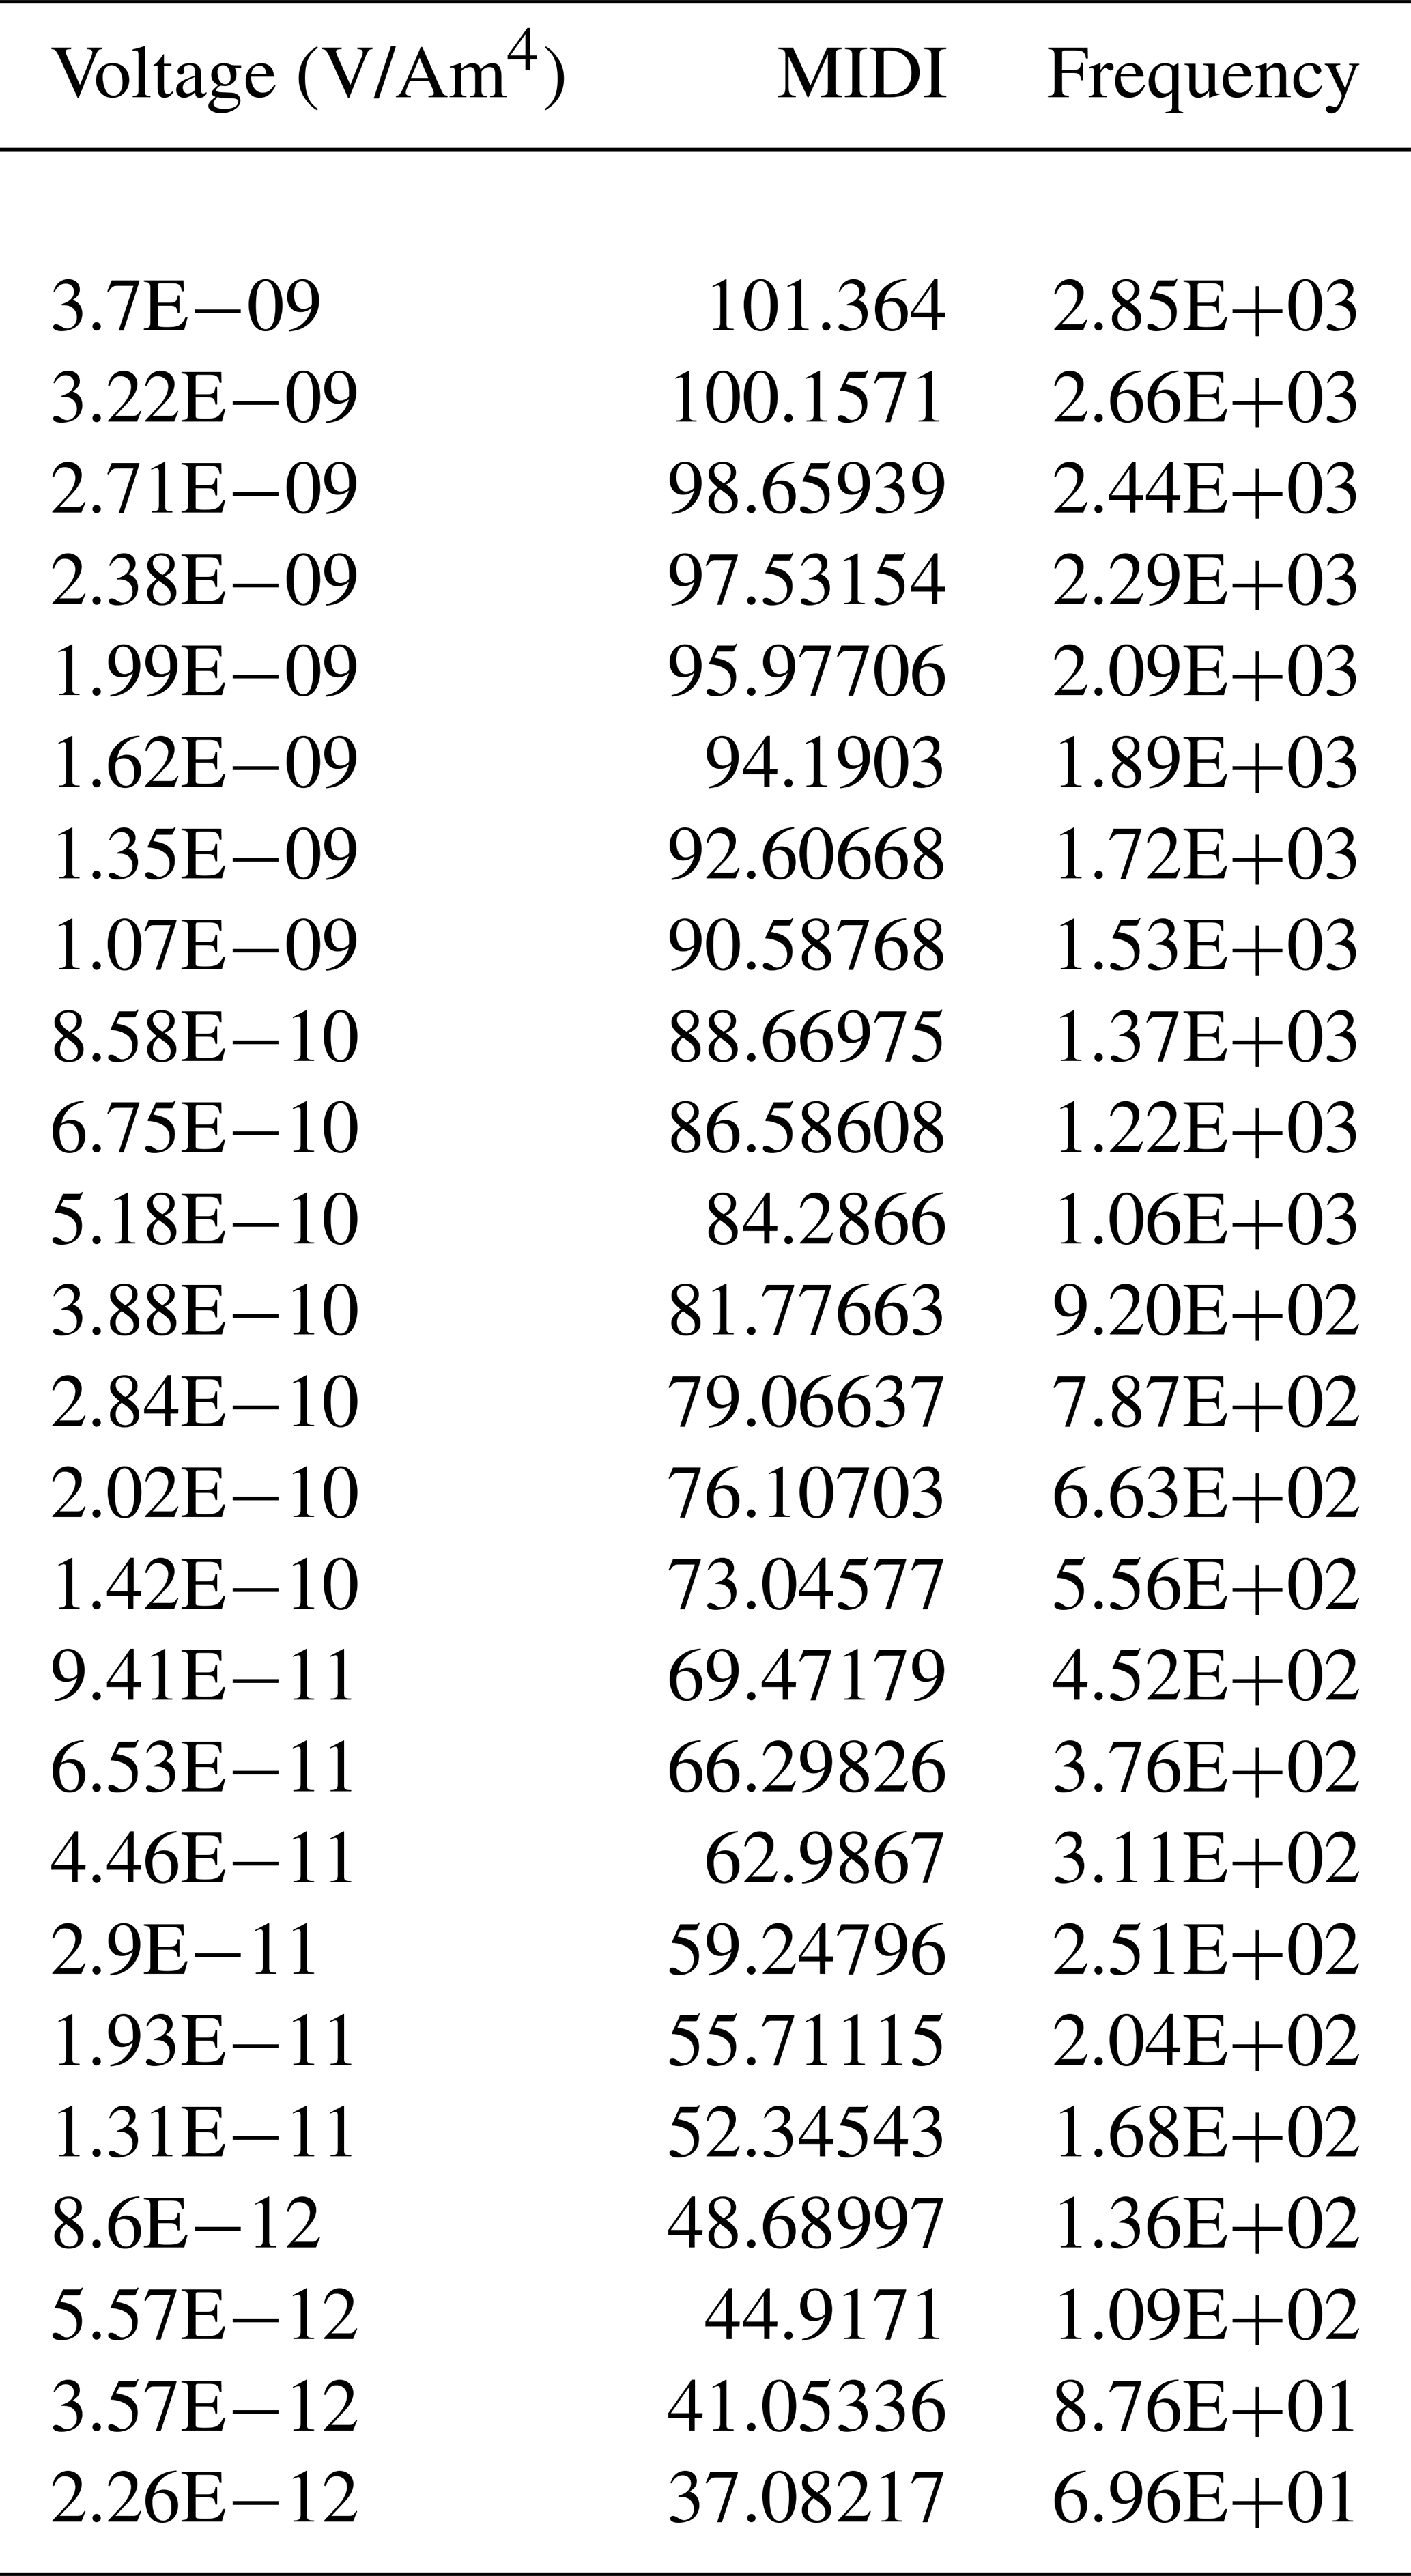
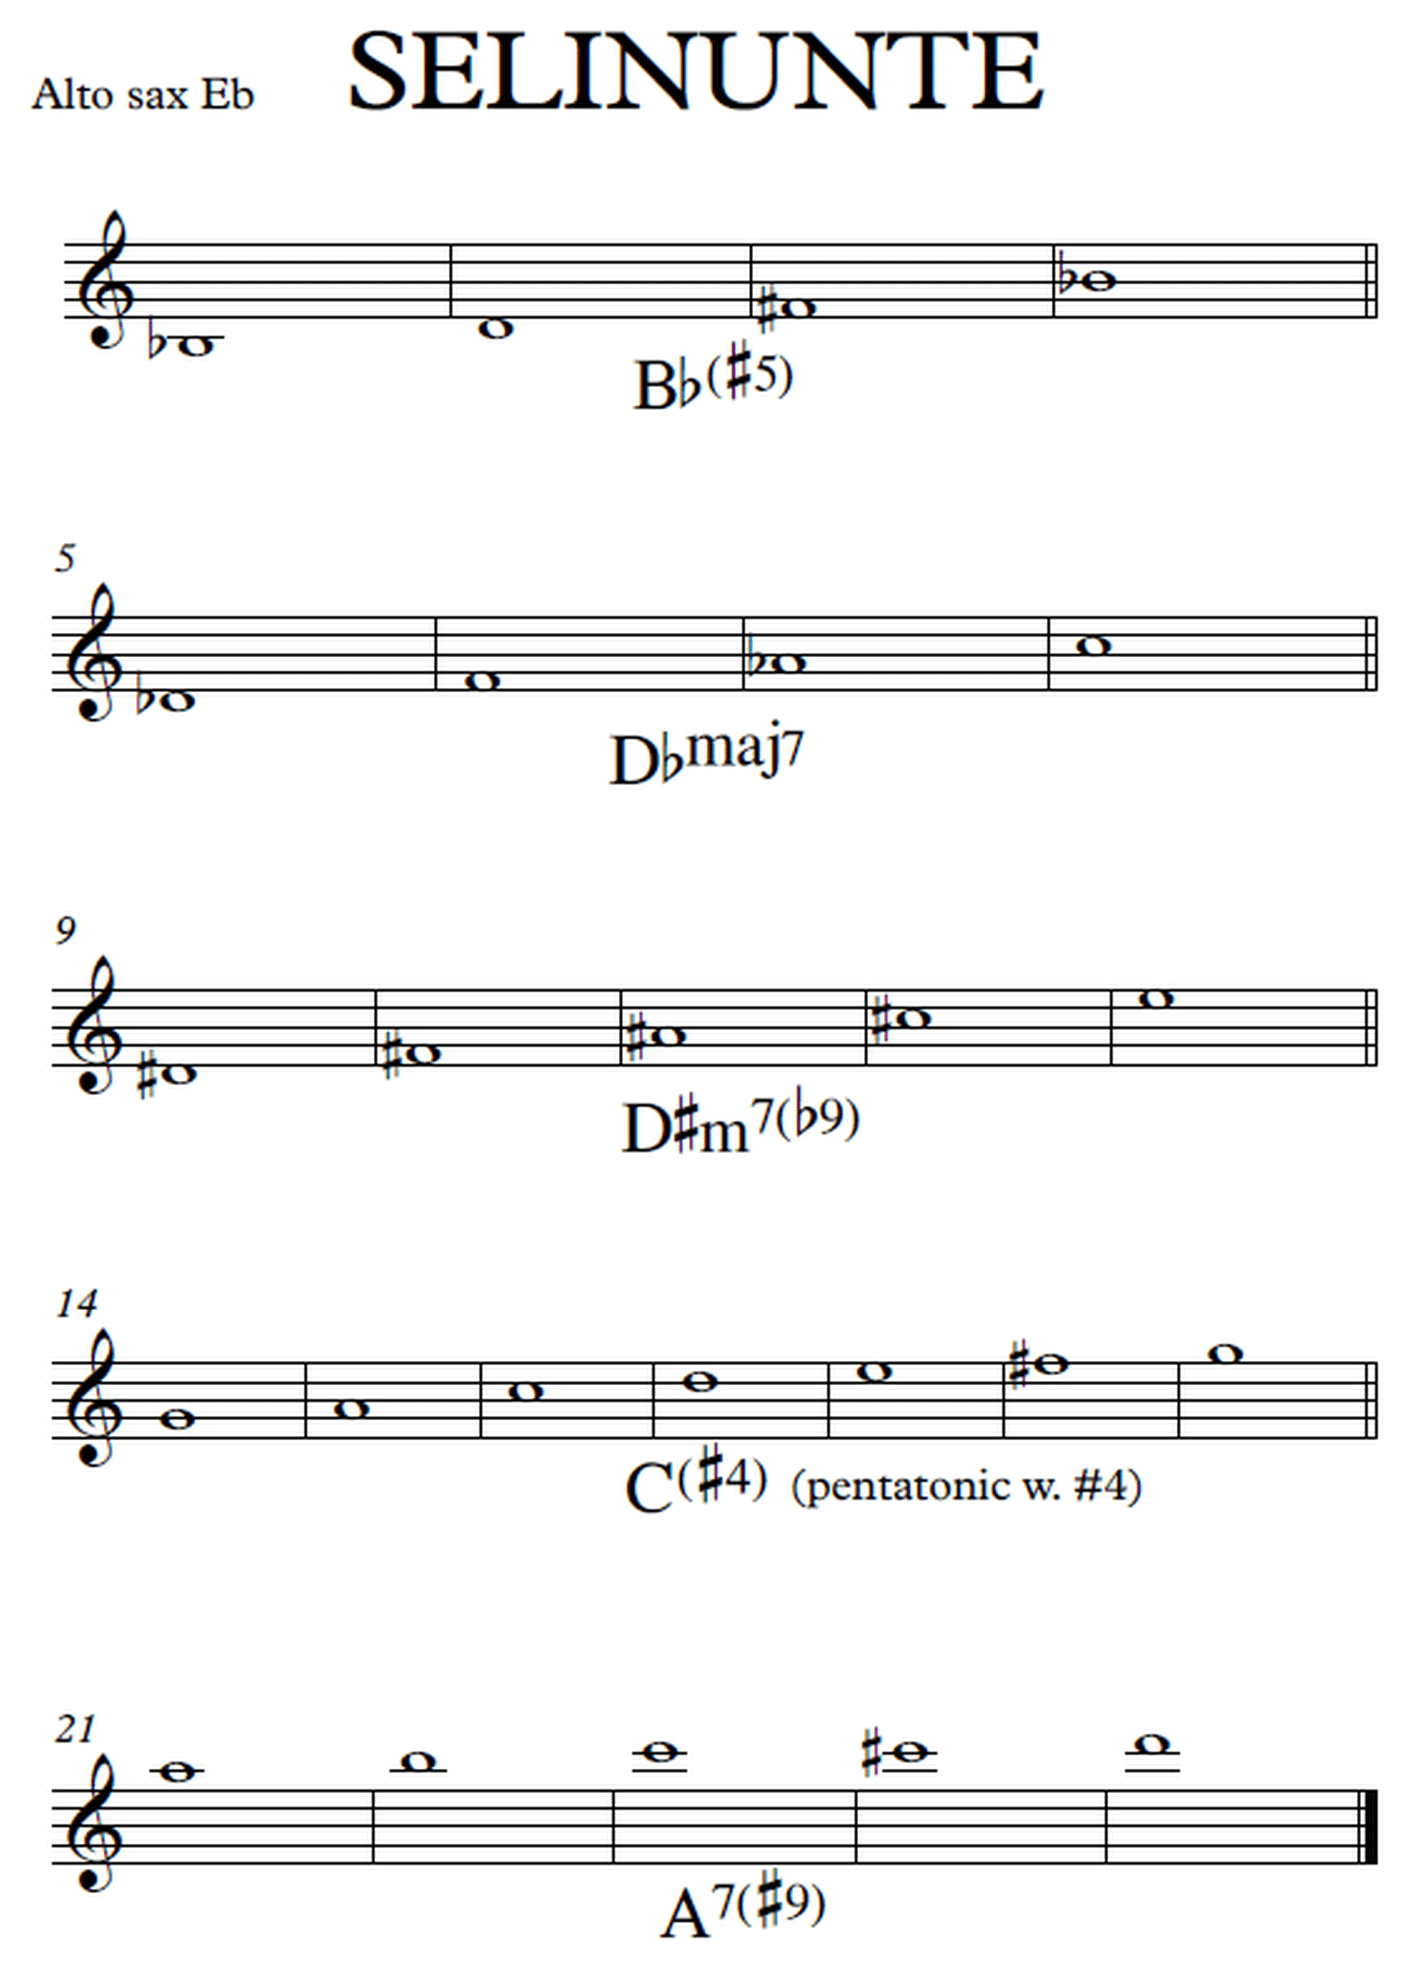
Figure 4Score of the Selinunte composition.
Another modality is to group the pitches according the different geological formations crossed by the EM signal. It requires a modelling of the geophysical data that can be achieved by the geophysicist. The musicians can use it to compose original pieces or to address the improvisation into a more restricted musical scale/chords.
The interplay between the geophysicist, who sonified the data, and the musicians is certainly one of the main steps since it represents an effective connection between music and geology. Besides the pitches extracted from the subsurface, the geophysicist/geologist provides some keywords that can suggest ideas for the improvisation/composition by the musicians. These keywords are associated with the modality of the deposition of the formations, paleogeographic info and specific colours associated with the rocks. For example, for the pitches drawn from a volcanic rock, the keywords could be hot, fire, red and explosion. Moreover, when the EMusic is performed live, the musicians are inspired directly by the landscape, as in a kind of audio land art. For example, for the Vesuvius concert, the quartet that performed at the concert were obviously inspired by an excursion to the crater and were captured by the astonishing scene. Also, the stage location immediately at the foot of the main crater, Piazzale Ercolano, at 1000 m above sea level (a.s.l.) contributed to the artistic outcome.
All the musicians involved in the project were really enthusiastic about having the opportunity to work on an original approach to improvisation/composition. Similar to standard pieces played in jazz music, they needed to start with a predefined framework formed by notes, chords and modes, while at the same time benefitting from a higher degree of freedom, which is an advantage. In this case, the geophysicist only provides the pitches and the keywords, without influencing any musical features (such as the choice of the instruments, kind of arrangement, development of the track and so on). Of course, this ability is not specific to jazzists, since it can be easily achieved by any performer of contemporary music.
In the following, we describe the main EMusic shows performed in collaboration with INGV. On each occasion we had the opportunity to interact with different audiences, namely scientists, geo-tourists, children and families. From the description of the following events, it is clear that the events may not always follow the same line-up. Sometimes the geology of the place of data acquisition is discussed during the concert; in other cases, as with the Vesuvius concert, it can even be introduced before the concert begins.
5.1 Performing at the EGU General Assembly
At the EGU General Assembly, we had the opportunity to perform twice (2017–2018). In 2017, the show took the name of “Sounds from the World”, while in 2018 the show was named “Sounds from the Geology of Italy” (Fig. 5). The first was based on data collected in Russia (Siberia), Sierra Leone (Nimini), Canada (British Columbia) and Italy (Castelluccio plain), while the second used data from Sicily (Selinunte), Campania (Phlegrean Fields), Umbria (Castelluccio plain) and Veneto (Venice). An excerpt from the 2018 performance is available on YouTube (https://www.youtube.com/watch?v=qplHWpKPFr4&feature=youtu.be, last access: September 2020).
Since the audience was mainly geoscientists, in both cases the show was introduced – in the same format used for a geo-conference – by a formal description of the geological features and evolution of each of the sites, including seismic and volcanic risk, ice ages, ore bodies origin (diamonds and gold) and global warming. Unfortunately, due to the amount of work during the general assembly, the EGU organizers did not effectively promote the two events, and the participation was low (about 20–30 people). Anyhow, we received sincere congratulations from those present. The number of views of the excerpt on YouTube (231) subsequently achieved confirm a positive feedback.
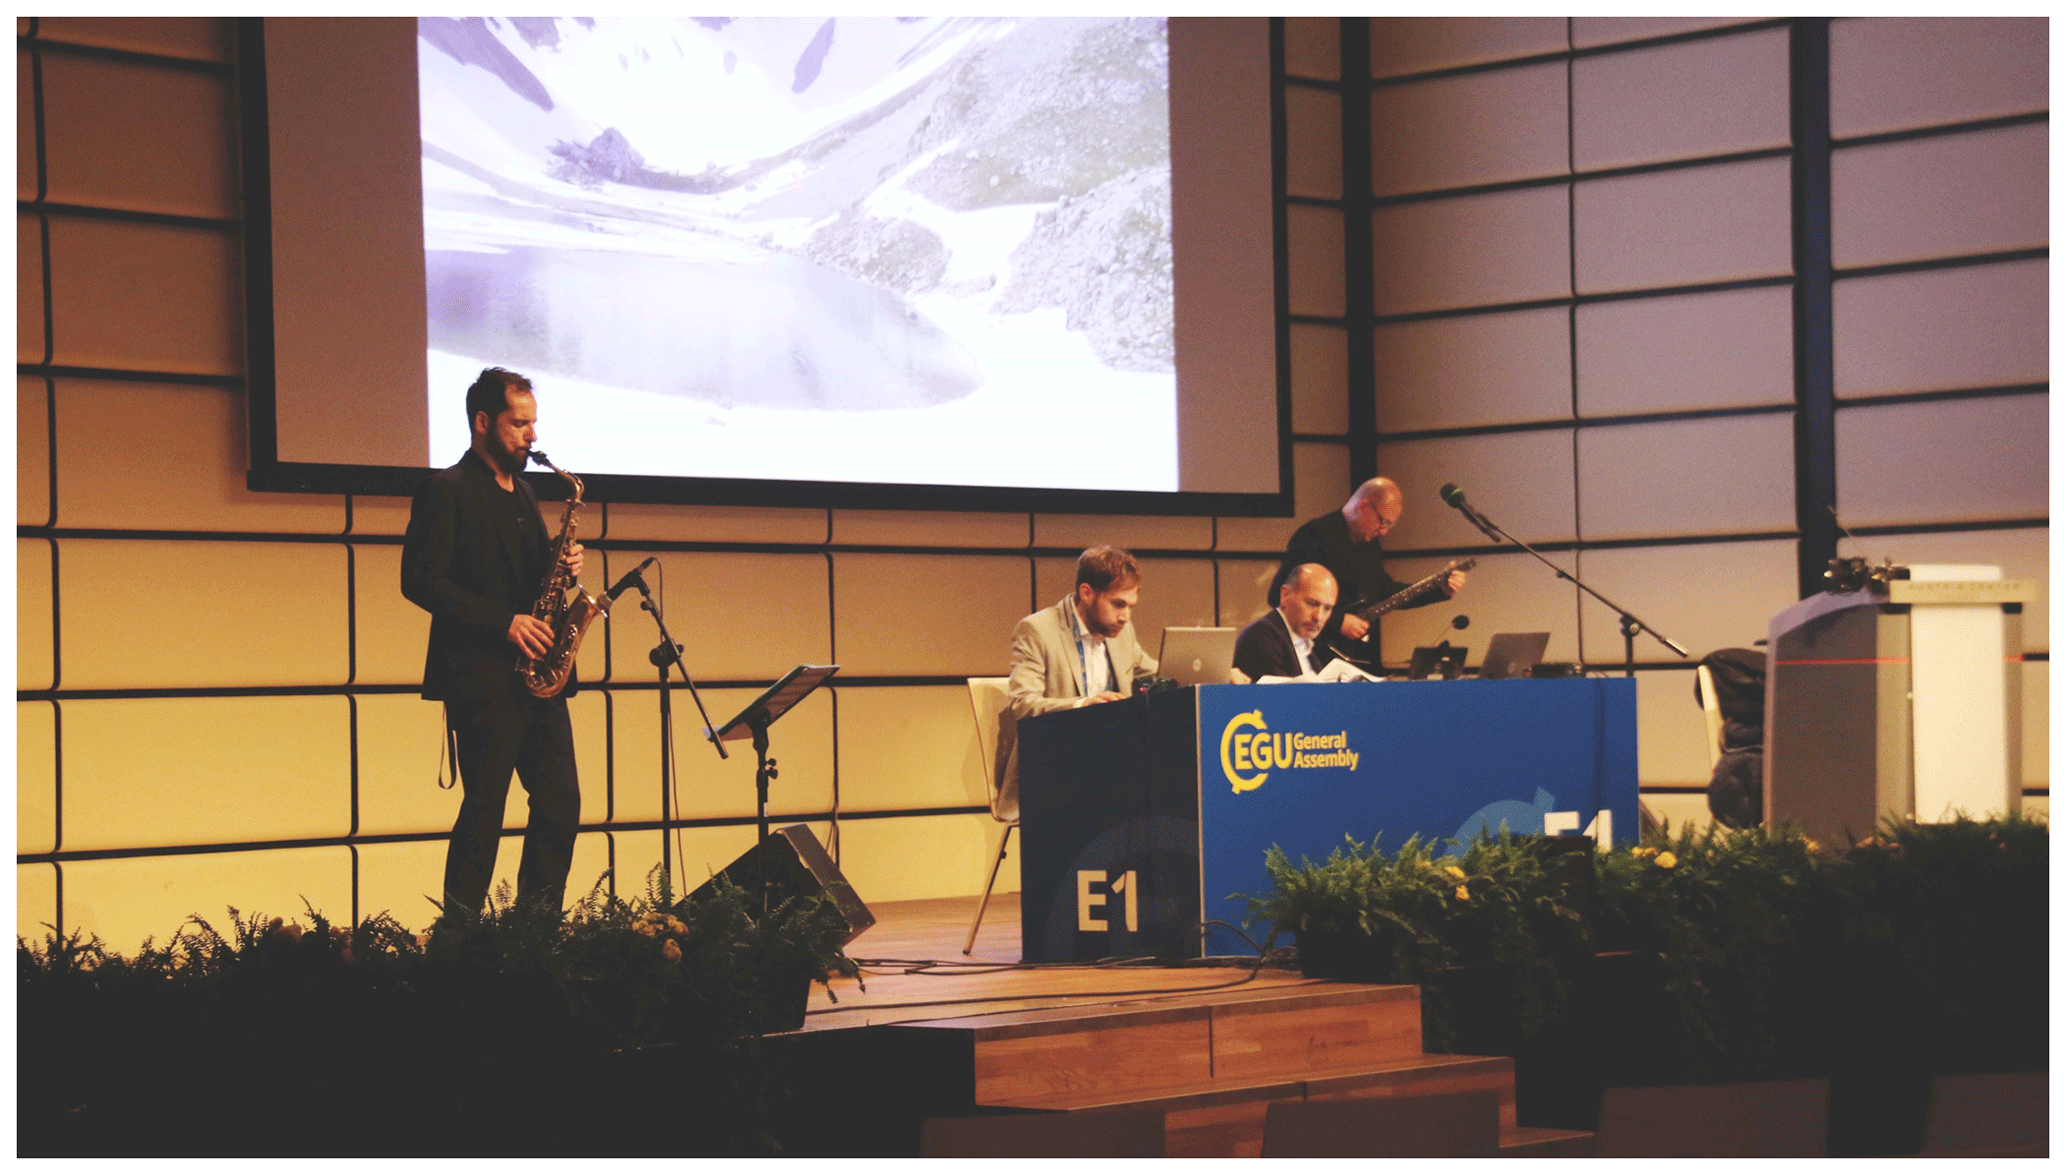
Figure 5A moment from the “Sounds from the Geology of Italy” show at the EGU General Assembly 2018.
The EMusic project and its ongoing activity in collaboration with INGV has been presented on several occasions at the EGU General Assembly. The general assembly is the annual meeting of the EGU, the greatest gathering, in Europe, of geoscientists from all over the world. The assembly also includes outreach sessions, and since 2015, it has also included a session on Earth sciences and art. So, we arranged the presentations in order to capture the attention of a wider audience.
In 2017, a poster launched the first pilot project, the MUsical Tools for ENhancing the Awareness of Global Emergencies (MUTENAGE) project, illustrating five specific global environmental emergencies, namely the pollution of aquifers, seawater intrusion along the coastlines, seismic risk, drought and permafrost melting. Our objective was to make it immediately clear how, for each of these, the TEM method can be an excellent diagnostic tool as the voltage response is greatly affected. When we add music, by associating well-defined musical footprints to the geophysical variations through the sonification process, we suppose that the impact of climatic–environmental changes can also be perceived by the general public and students of every age and grade. Of course, this presupposes the spreading of the EMusic method and the effort of understanding how it also works as a geophysical diagnostic tool. As an immediate example of how the EMusic can describe the geological features of a site and the environmental issues related to it, we chose the effect of seawater intrusion. The phenomenon is well marked by the progressive increase in the voltage, and hence the pitches, when approaching the coastline. When it is translated into EMusic, the musical sequence gives an immediate perception of the environmental impact caused by the erosion of the coasts.
But, it was only in 2018 that we had the possibility to give an immediate taste of the EMusic to the scientific community when we presented at the Earth sciences and art Presenting Interactive COntent (PICO) session. The PICO is a recently developed way of presenting at a scientific conference. Compared to a poster session, a PICO is more suitable for a presentation including art. It allows one to have a couple of minutes to introduce one's work. Then, one reaches an interactive screen to receive anyone interested and show one's work in detail. We had the possibility, in our “Diatomites sound like a B13 chord” presentation, to show an excerpt of an EM concert in the ancient Roman theatre of Ferento, central Italy (https://www.youtube.com/watch?v=IaQLhoEQi84&feature=youtu.be, last access: September 2020).
The session was crowded, and we had several geoscientists already involved in other geo-musical projects asking for detailed information at our screening. The video on YouTube has reached 458 views, which is a remarkable outcome considering the scientific feature. As we discuss later, the single tracks of the Ferento concert have been uploaded on Spotify, obtaining positive feedback, with an average of 50 streams.
5.2 The Vesuvius concert
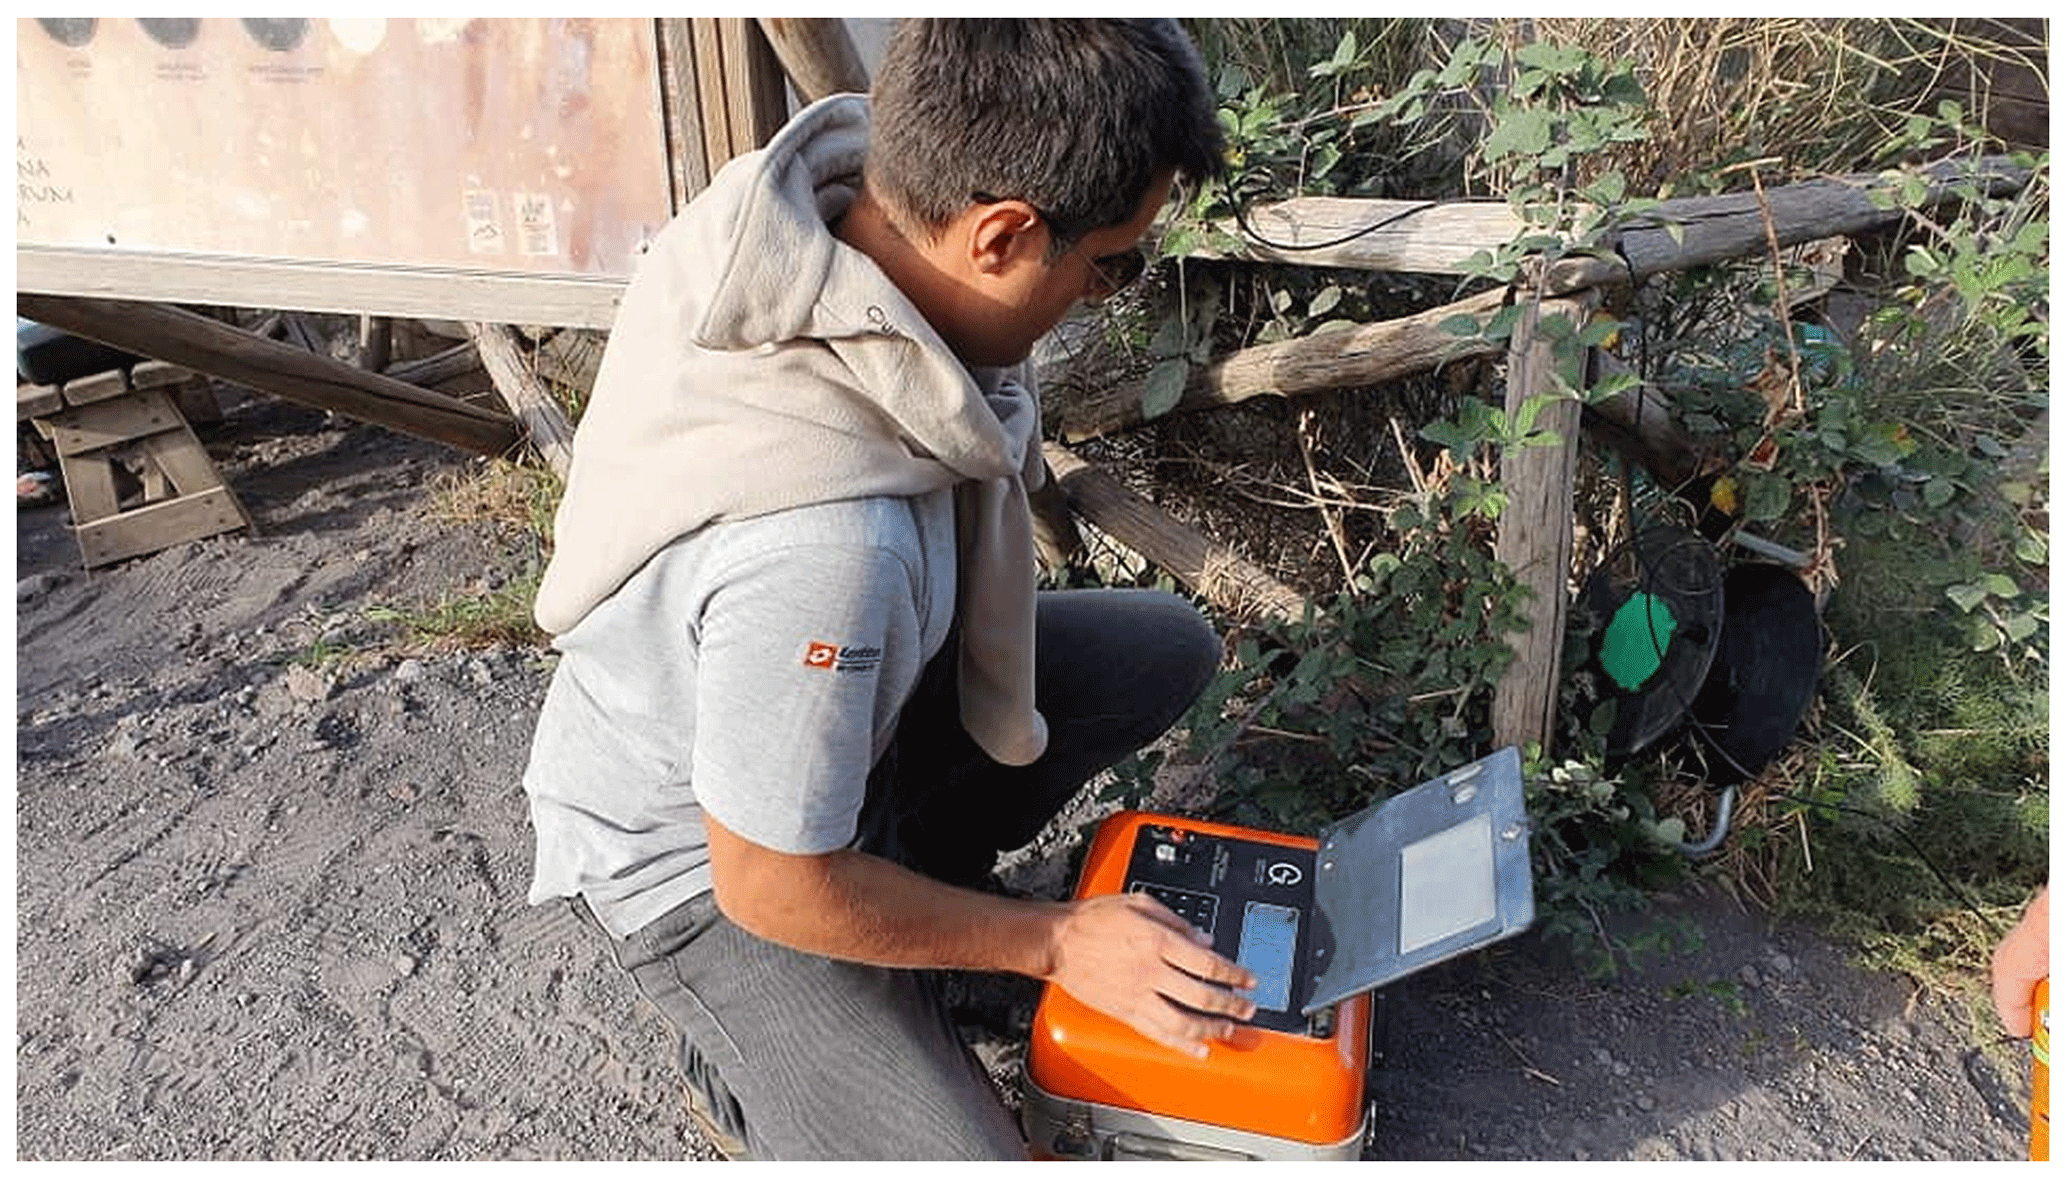
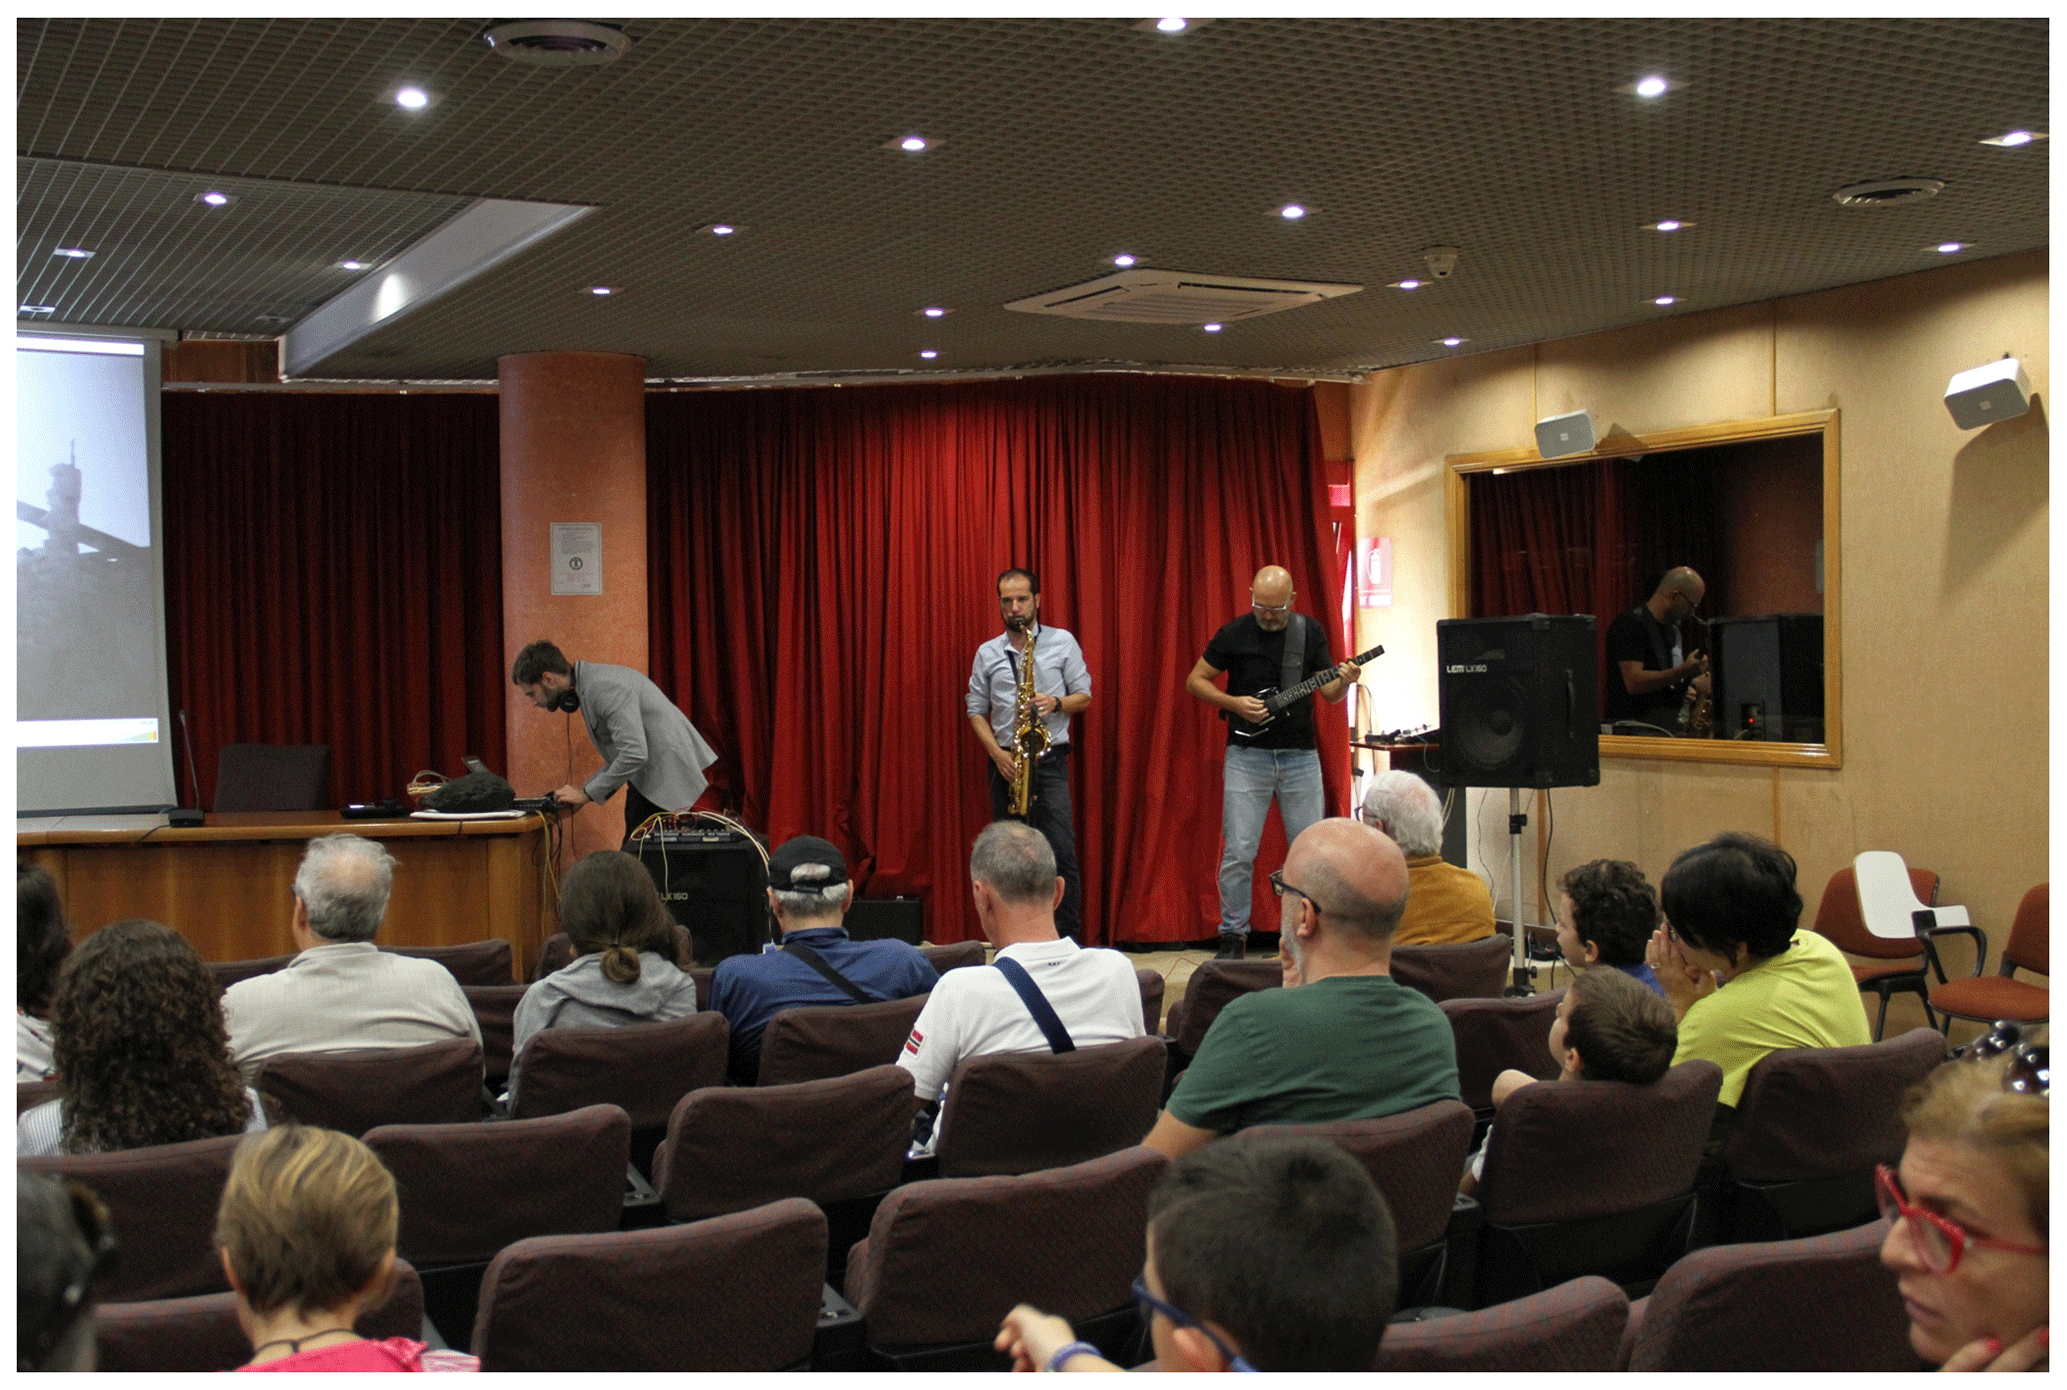
On another occasion, we had the opportunity to arrange the performance in a way that is different to the show in Ferento as previously described. It was a show halfway between geo-tourism and a musical concert. On 21 September 2019, we performed at the Vesuvius National Park in collaboration with the geological survey of Campania. Visitors assisted with the TEM data collecting (Fig. 6) and were able to experience the geophysical equipment at work. They asked several questions, and some people were particularly intrigued by the instruments, confirming the advantages of a direct experience.
The EM response was sonified on-site under the eyes of those present, and the pitches were immediately transferred to the musicians (the Marco Guidolotti Quartet and the EMusic artistic director, Stefano Pontani) in order to prepare the concert. As the subsurface was formed by very resistive rocks (lava and scoriae from the last activity in 1944). the signal was weak, so it fell very quickly into the background noise. Moreover, due to the high resistivity, the pitches were low. We extracted only six useful gates, and this outcome greatly limited the possibility of arranging a full concert of more than 1 h. We involved the audience in the contingencies of the case, having also had the opportunity to discuss the limits of science with people. Scientists can obtain unexpected results, which are not always positive. Being aware of this risk, we had already thought to use a second TEM sounding collected over a more favourable situation; in fact, this test was carried out in a quarry where we had the opportunity to characterize the historical pyroclastic flow responsible for the destruction of Pompeii to the older layers of the Somma volcano that preceded the Vesuvius building. Thus, we were able to split the transient into three different pieces. The full concert is available on YouTube, starting at about minute 40 (https://www.youtube.com/watch?v=Xh_tY22E1_A&feature=youtu.be&fbclid=IwAR0bqdEHslm1pD-Up8z_uiMQ7dxvODISckwlDhZOe4slWIwyvMIZ7JGaU_I, last access: September 2020).
Also, in this case, the feedback can be considered promising, with 291 views (11 likes).
5.3 INGV open day
On 29 September 2019, we were at the INGV open day during the celebration of its last 20 years of research activity and scientific achievements (Fig. 7). It was a rare opportunity to involve families and people of different educational backgrounds. We performed three different EMusic pieces inspired by three topics popular in the media, namely seismic risk, volcanic risk and environmental pollution. The EMusic band, formed by Marco Guidolotti on the saxophone, Stefano Pontani on the guitar and Riccardo Marini on electronics, conferred with INGV researchers presenting on the subjects. Musical compositions were based on EM data collected in the Castelluccio plain (close to the Mount Vettore fault that triggered the last seismic sequence in central Italy), Australia (in an area affected by seawater intrusion) and the Vulsini area in northern Latium (where the Pleistocene volcanism built huge structures, like the largest volcanic lake in Europe). We combined live music with videos specially edited for the event that resembled the three main topics of the EMusic compositions. The videos showed images of volcanos from all around the world, from the Australian landscape and from the national park of Monti Sibillini.
The open day involved more than 2000 people and about 300 of them, organized in different groups of about 30 people, each spent at least 20 min in the conference room listening to our concert. Regarding the audience's appreciation of the whole day, we have some preliminary data as reported from a sample of 150 examined opinion poll surveys (89.6 % satisfaction for the whole open day event; Massimo Crescimbene, personal communication, 2020). We also had the opportunity to talk directly to the people outside the conference room and after the concert, asking them questions like “what did you gain from the EMusic?” or “why did you like or not like the music itself?” From the informal interviews with students and families or even with INGV colleagues, we perceived enthusiasm. Most interesting was that students mainly caught the change in intensity and duration in time of the music as being due to change in subsurface geology, while they also appreciated the videos and their combination with the live music. As for our INGV colleagues, they were satisfied with the way we decided to bring people close to the geosciences.
As a project based on sonification, we can already count on a series of studies that have already been performed on what makes this technique so compelling in the public's imagination. Sonification has already attracted the interest of scholars in the social sciences and humanities (Sterne and Akiyama, 2012; Schoon and Volmar, 2012; Harenberg and Weissberg, 2012; Rumori, 2012). Further studies discuss the experience of sonification in terms of its promise to create sublime experiences of science (Supper, 2014). As long as we stay a live band performing music created from the interaction between science and art, we can, in all respects, fit into what Supper (2014), reporting the thoughts of Born and Barry (2010), defines as the logic of accountability and the logic of ontology. Accountability is referred to as art and art–science initiatives used to legitimate scientific research. As Supper (2014) observes from reporting on several examples of such collaborations in the sonification field, such a legitimation is not always a one-way street. Rather than art making science more accessible to the public, art and science are involved in an act of legitimacy exchange. In our particular case, who knows if the EMusic will help increase the audience of jazz and improvised music? As for the logic of ontology, Born and Barry (2010) explain that it is referred to “altering existing ways of thinking about the nature of art and science, and with transforming the relations between artists and scientists and their objects and publics”. In this sense, the EMusic surely suggests new ways of creating music, stressing the role of improvisation, while making the relationship with scientists essential in this area.
6.1 Preliminary feedback
Concerning the impact of the EMusic on the public at present, we can count on some data extrapolated from our web channels, such as YouTube and Spotify. The data can just give indications on the interest aroused and on the number of likes. We report them knowing that they are purely indicative since we have never had an advertising campaign, given that such an action requires a budget. On some occasions we have received media coverage that has contributed to raised interest of people before and after an event. The Vesuvius concert was covered by a whole page on one of the most popular Italian newspapers, La Repubblica (Fig. 8); a video from the same newspaper (https://www.youtube.com/watch?v=WlrcSqxeE0k, last access: September 2020) scored 1764 views (with 32 likes and 1 unlike). Another article appeared in its scientific supplement. Not least, the event was subject of a question of a popular TV quiz broadcasted by the national RAI 1 channel.
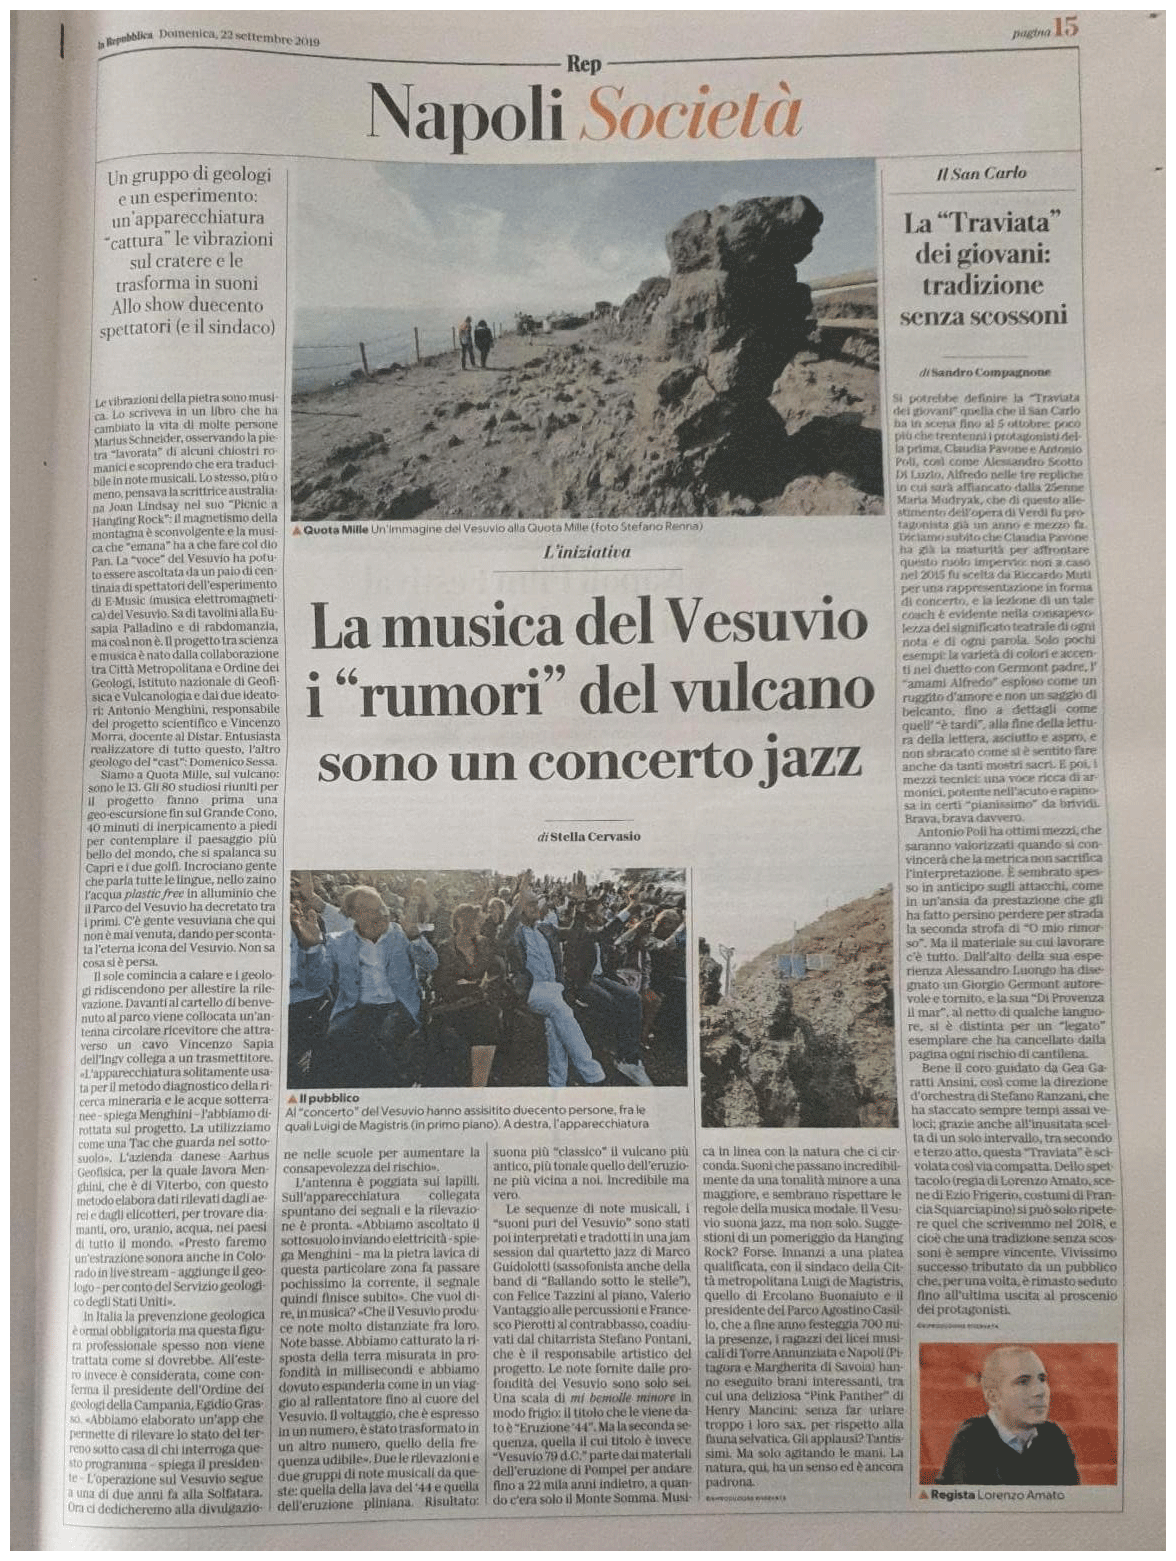
Figure 8A full page of La Repubblica newspaper dedicated to the Vesuvius concert.
We tried to perform a statistical analysis by assessing our main channels and media tools. We have two YouTube channels (one under Antonio Menghini, available at https://www.youtube.com/channel/UCJvHljuFPLHZddyPMghtfzw, last access: September 2020, and another under the EMusic Team, available at https://www.youtube.com/channel/UCLuh1HyrSzIMiAPWGmzPm9g, last access: September 2020), scoring a total of 32 subscribers. They contain mainly music videos, most of them reporting on EMusic events.
In his paper on YouTube videos, Allgaier (2012), reporting on Watercutter (2011), claims that if the science in the clips is accurate and valid, and if they are entertaining and gripping too, then they have the potential to become helpful tools in science education and science communication. In this respect, our activity on YouTube has also been addressed to spread the science behind our music. Encouraging feedback in this sense comes from the most viewed of our YouTube videos, “Listening guide to EMusic”, which scored 948 views and an average view duration (AVD) of 1:56 min, suggesting the interest in understanding more about our method of sonification from an audience not only from Italy (28 %) but also from the US (9 %) and Australia (1 %), followed by a large international presence from at least 10 other countries.
The second most viewed video is “I Suoni della Viterbo Sotterranea” (704 views and an AVD of 0:54 min), which is connected with a geo-tourism site in central Italy. In this case, the viewers are most probably visitors from the related geo-site. On that occasion, some people purchased the EMusic CD containing the tracks drawn from this particular site. So far, we have sold 200 CDs, which can be considered a positive outcome since this geo-tourism site is the only point that sells the albums (besides a small number sold during concerts). Also, in this case, we appeared in the local press.
The scientific video, “Induced Polarization” (624 views), occupies the third position, suggesting the didactic value of the project. The video is not linked in anyway to concerts or events and is most likely viewed by students or researchers. It is an original way to explain the complex phenomenon of induced polarization in the EM method.
Concerning the video reporting on events in collaboration with INGV, namely the EGU show of “Sounds from the World”, one of the tracks called “Sounds from the Fault” scored 586 views and an AVD of 1:25 min. Moreover, “Sounds from the Geology of Italy” was viewed 231 times with an AVD of 1:45 min. The Ferento concert presented at the PICO poster has 458 views, with an AVD of 1:31 min, and the video associated with the oral presentation, “Flying through an African Greenstone Belt”, has 360 views and an AVD of 1:59 min.
As we have already highlighted, the feedback from the Vesuvius concert has been largely positive, with a high rate of views of the La Repubblica video (1764 views) and of the full concert (291 views).
The examination of the number of streams on Spotify provides a partial view of the musical outcome of the project as the listeners, in this case, do not have any complementary information about the project (e.g. listening guide, papers, etc.). We can state that they are more interested in the musical feature. Indeed, we uploaded only 15 EMusic tracks, mostly from the Ferento concert. The most streamed track is “Sounds at the foot of an extinct volcano” (212 streams), which is not linked to any show. The second track is “Sound from the Fault” (199), which is in any case linked to the EGU events, and “Halfway River” (173), which is one of the tracks from “Sounds from the World”. The total streams scored 955.
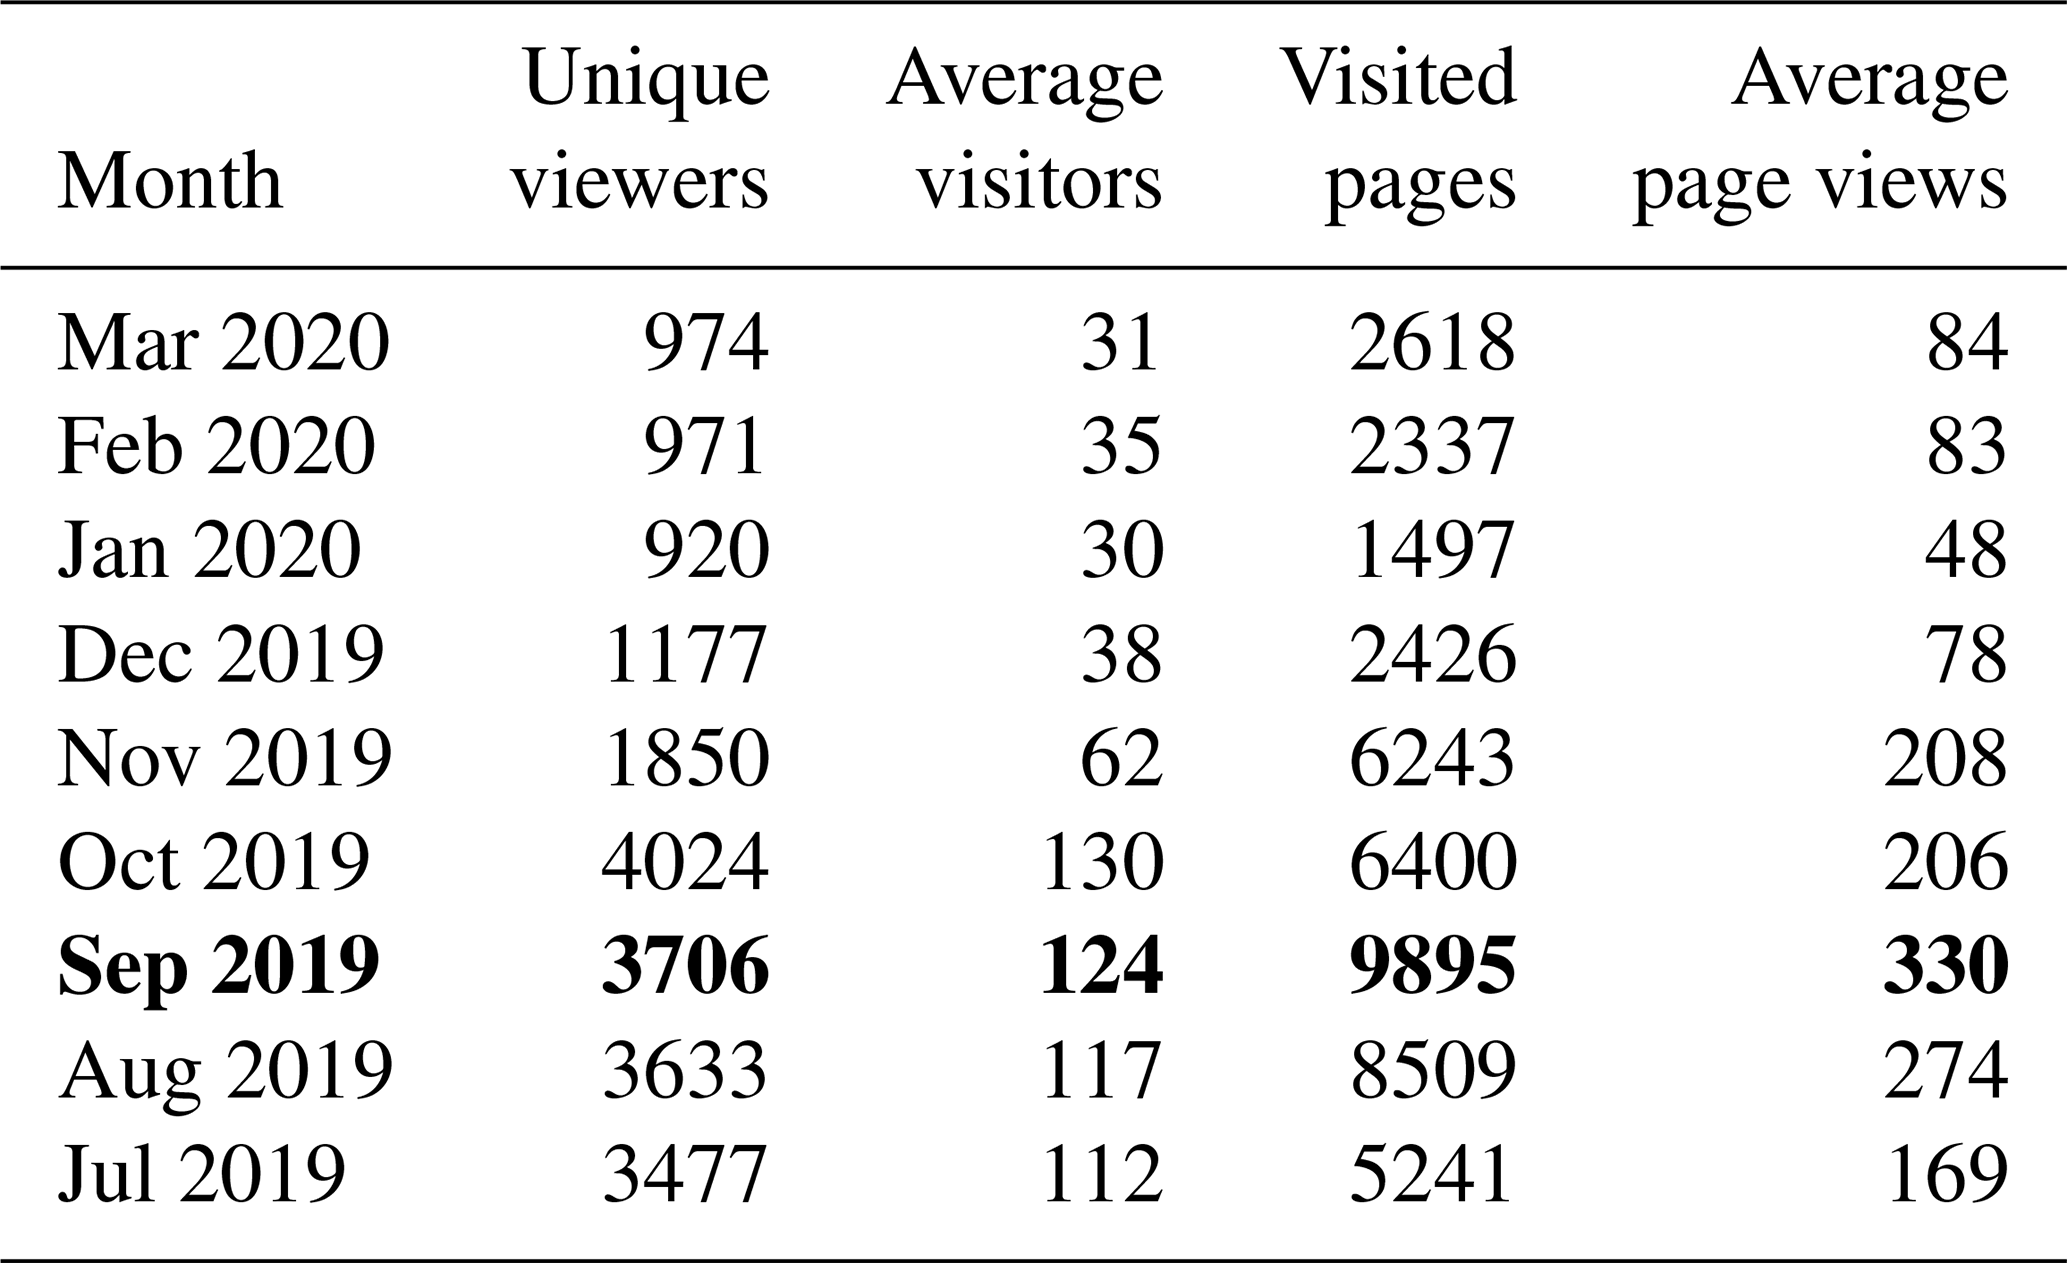
We have a discrete group on LinkedIn at https://www.linkedin.com/groups/8509853/ (last access: September 2020; 208 members) and a Facebook page at https://www.facebook.com/emusic.team/ (last access: September 2020) with more than 5000 subscribers. In addition, based on the statistics (see Table 3) of a post on the Earth and Art blog that was dedicated to the Vesuvius concert in September 2019 (the only post in September 2019), they seem to show an increase in the number of visitors with respect to the previous and subsequent months. The increase could be linked to the media coverage.
Table 3Statistics from the Earth and Art blog for the month of September 2019 when the Vesuvius concert took place. These values are indicated in bold to highlight the increased traffic to the blog (http://earthandart.altervista.org, last access: 4 November 2020).
As already said, we do not have a budget to run any promotional activity as is the norm for musical events. EMusic events are financed by sponsors, i.e. scientific or professional institutions, without any support from show business. Usually, the budget is used to pay the musicians who are professionals from the Italian jazz scene.
Nevertheless, if we want to move in the field of science education, an evaluation on how the method can help students to become interested in Earth sciences and how the EMusic can sensitize them to planet sustainability becomes essential.
For the time being, we can only suppose it. Eventually, as we have perceived during the musical events organized, EMusic can stimulate people to become interested in the functioning of the sophisticated equipment and the physics – beyond a complex method like TEM. At the same time, EMusic can stimulate people's curiosity on how rocks are characterized by different physical parameters (in this case resistivity) and how geoscientists exploit this feature to explore the subsurface.
The presence of musicians can stimulate studies of the deep relationship between frequency and musical notes, the use of the tempered scale, how a series of pitches can suggest a mood reflecting a specific formation and how the musicians face the improvisation rules.
Since we are convinced of the potentialities of the method from a science communication perspective, we expect to bring EMusic to secondary schools soon. At present, we are implementing the Georisonanze project. In this way, we hope to encourage students from scientific institutes to approach music and students from musical–artistic schools to understand the utility of STEM subjects. A preliminary description of how we intend to conduct the evaluation is given in the next paragraph.
6.2 Future plans
In the near future, we intend to stimulate the involvement of the scientific community in our project and implement our participation in specific musical events. We are planning on participating in science festivals, not only in Italy but also abroad. There is a growing interest in events that attract people of different ages, e.g. young students and families, to learning science in an enjoyable way. There are already studies on the positive impact of science festivals on the public understanding of science (Jensen and Buckley, 2012). We are also interested in participating in musical festivals such as those having experimental and more contemporary features, with a particular focus on the jazz avant-garde world. In this way, we can experiment with new perspectives.
We are also currently planning how to obtain feedback from the heterogeneous audience participating in our show. As a start, a questionnaire will most probably be put on the EMusic website. It will mainly investigate the level of appreciation and the attitude of those present towards scientific and environmental issues proposed during the events. Later, to encourage feedback, if we manage to receive a budget, we can also think about designing an application for users to keep them informed about the EMusic events and to download the questionnaires to be filled in.
A more articulate evaluation can be previewed for the project of Georisonanze, which has been conceived for the students of secondary schools. In this case, as it is not a spot event, we can investigate what students retained from the geological and musical knowledge transferred, not only through traditional front lessons but also through jazz musical sessions, where the basis will be the sonification process described in the present work. As for previous experiences with schools, including other forms of arts (narrative) already carried out at INGV (La Longa et al., 2013; Lanza et al., 2014; Lanza and D'Addezio, 2020), an input questionnaire will investigate the students' previous knowledge on geosciences and music, while a final questionnaire will assess the level of appreciation, the acquired skills and other items still to be discussed. In addition, concerning the evocative power of music, it will be interesting, at the end of the didactic modules, to propose an oral quiz session with the whole group to see if the students, through the sounds proposed by the musicians, are able to recognize the rocks and the nature of the soil.
Until now, EMusic has been experimented with in the form of live shows worldwide. When the audience were composed of scientists, students, geo-tourists, children and families, we perceived its potential to attract people's interest to science. A preliminary feedback received from the EMusic presence on the web encouraged us to assess the EMusic as a science communication tool to enable people to have contact with the geology of the Earth, spanning from natural risks (seismic, volcanic and geomorphological) to climatic changes, from pollution issues to landscape evolution. Music is certainly a unique medium for raising awareness of the most urgent topics that threaten the Earth. The peculiarity of the TEM methods at the basis of our sonification process has given us the opportunity to taste the predisposition of people to become interested in the investigative methods of Earth sciences – even the most sophisticated ones. The first positive feedback, in this sense, came from the musicians. But, on other occasions such as, for example, the Vesuvius concert, we have also found that ordinary people can be intrigued by scientific equipment and their use. Our next step will be to bring the project to schools, since we are convinced that coupling music with geosciences can emphasize the central role of STEM matters in our society and encourage people to appreciate the use of maths and physics in an artistic context.
The only data that are publicly available are from the Vesuvius concert, and they can be downloaded from https://drive.google.com/drive/folders/16bNUYvKP1-8A3a9ujZIfvE81UVQbyP2R?usp=sharing (last access: 2 November 2020; Menghini et al., 2020) All the other data are not available because they are related to current mining or hydrogeological–geological surveys.
AM conceived and designed the study, acquired the data, performed the analysis and interpretation of the data, drafted the paper and approved the final version for submission. SP was the artistic director of the EMusic live concert, musician and co-author of the EM data sonification method. VS acquired the EM data, analysed and interpreted the data and revised and, together with TL, reviewed the article critically for important intellectual content in the light of science communication.
The authors declare that they have no conflict of interest.
This article is part of the special issue “Five years of Earth sciences and art at the EGU (2015–2019)”. It is a result of the EGU General Assembly 2017, Vienna, Austria, 23–28 April 2017 and the EGU General Assembly 2018, Vienna, Austria, 8–13 April 2018.
We wish thank Domenico Sessa (from the association of geologists of Campania) for having supported the Vesuvius concert, Dora Apicella for the photo of the Vesuvius concert and Massimo Crescimbene (INGV) for the invitation to the INGV open day.
This paper was edited by Isaac Kerlow and reviewed by Bernardo Feldman and one anonymous referee.
Allgaier, J.: On the shoulders of YouTube: science in music videos, Sci. Com., 35–266, https://doi.org/10.1177/1075547012454949, 2012.
Auken, E., Jørgensen, F., and Sørensen, K.I.: Largescale TEM investigation for groundwater, Expl. Geophys., 33, 188–194, 2003.
Avanzo, S., De Mattia, F., Barbera, R., and La Rocca G.: Data sonification of volcano seismograms and Sound/Timbre reconstruction of ancient musical instruments with grid infrastructures, Proc. Comp. Sci., 1, 397–406, 2010.
Born, G. and Barry, A.: Art-science: From public understanding to public experiment, J. Cult. Econ., 3, 103–119, 2010.
Christiansen, A. V., Auken, E., and Soerensen, K.: The transient electromagnetic method, in: Groundwater geophysics, edited by: Kirsch, R., Springer, 179–225, 2006.
Civico, R., Sapia, V., Di Giulio, G., Villani, F., Pucci, S., Baccheschi, P., Amoroso, S., Cantore, L., Di Naccio, D., Hailemikael, S., Smedile, A., Vassallo, M., Marchetti, M., and Pantosti, S.: Geometry and evolution of a fault-controlled quaternary basin by means of TDEM and single-station ambient vibration surveys: The example of the 2009 L'Aquila earthquake area, J. Geophys. Res.-Solid Earth, 122, 2236–2259, https://doi.org/10.1002/2016JB013451, 2017.
Dell'Aversana, P., Gabbriellini, G., and Amendola A.: Sonification of geophysical data through time-frequency transforms, Geophys. Prosp., 65, 146–157, https://doi.org/10.1111/1365-2478.12402, 2016.
de Mora, L., Sellar, A. A., Yool, A., Palmieri, J., Smith, R. S., Kuhlbrodt, T., Parker, R. J., Walton, J., Blackford, J. C., and Jones, C. G.: Earth system music: music generated from the United Kingdom Earth System Model (UKESM1), Geosci. Commun., 3, 263–278, https://doi.org/10.5194/gc-3-263-2020, 2020.
Duncombe J.: Rock on with a group that makes music from geophysical data, Eos, 100, https://doi.org/10.1029/2019EO126807, 2019.
Fitterman, D. V. and Stewart, M. T.: Transient electromagnetic sounding for groundwater, Geophys., 51, 995–1005, 1986.
Harenberg, M. and Weissberg, D.: Vorläufige Vorläufer: Vordergründige Bezüge und hin tergründige Gegensaẗze zwischen Komposition und Sonifikation. Das geschulte Ohr. Eine Kulturgeschichte der Sonifikation, edited by: Schoon, A. and Volmar, A., Bielefeld, 207–222, 2012.
Hermann, T. and Ritter, H.: Listen to your Data: Model-Based Sonification for Data Analysis, in: Advances in intelligent computing and mulimedia systems, edited by: Syed, M. R., Int. Inst. for Advanced Studiesin System Research and Cybernetics, 1999.
Hilgren, B.: The music of science: Environmentalist data sonifications, interdisciplinary art, and the narrative of climate change, Master Thesis, College of Music, Florida State University, 2019.
Hughes, S.: What Gravitational Waves Sound Like, https://www.gw-openscience.org/audio/ (last access: 3 November 2020), 2016.
Jensen, E. and Buckley, N.: Why people attend science festivals: Interests, motivations and self-reported benefits of public engagement with research, Public Underst. Sci., 23–5, 557–573, https://doi.org/10.1177/0963662512458624, 2012.
Kramer, G., Walker, B., Bonebright, T., Cook, P., Flowers, J. H., Miner, N., and Neuhoff, J.: Sonification report: Status of the field and research agenda, Faculty Publications, Dept. of Psychology, University of Nebraska, 2010.
La Longa, F., Lanza, T., and Crescimbene, M.: Ecomuseum itineraries a path of rediscovery and enhancement of the territory, EGU 2013-3209, 2013.
Lanza, T., Crescimbene, M., La Longa, F., and D'Addezio, G.: Bringing earth into the scene of a primary school: a science theatre experience, Sci. Com., 36, 131–139, 2014.
Lanza, T. and D'Addezio, G.: La scienza, le favole e il racconto: primo approccio alla scrittura creativa negli studenti di scuola secondaria attraverso i progetti di Alternanza Scuola Lavoro 2017–2018, Miscellanea INGV, in press, 2020.
Menghini, A.: Canto Flegreo: Sounds from an active volcanic crater, FastTimes, 21, 39–42, 2016.
Menghini, A.: Jammin' with the Earth, Preview, AEGC2018 Conference Handbook, 35–38, 2018.
Menghini, A. and Pontani, S.: What is the sound of the Earth? First steps into EMusic, First Break, 34, 41–46, 2016.
Menghini, A. and Pontani, S.: Flying through an African greenstone belt by EMusic, EGU General Assembly, 23–28 April, Vienna, 2017.
Menghini, A., Pontani, S., Sapia, V., and Lanza, T.: EMusic – EM data repository, available at: https://drive.google.com/drive/folders/16bNUYvKP1-8A3a9ujZIfvE81UVQbyP2R?usp=sharing, last access: 2 November 2020.
Michael, A. J.: The music of earthquakes and Earthquake Quartet #1, Book chapter, Book, Konrad Smoleński's S.T.R.H., 2013.
Nabighian, M. N. and Macnae, J. C.: Time domain electromagnetic prospecting methods, in: Electromagnetic methods in applied geophysics, edited by: Society of exploration geophysicists, 427–479, 1991.
Quinton, M. A. P. and Benyon, D.: Sonifying the Solar System, Conference: The 22nd International Conference on Auditory Display, 2–8 July 2016, Canberra, Australia, https://doi.org/10.21785/icad2016.003, 2016.
Roger, D.: The Oxford Handbook of Computer Music, New York: Oxford University Press, 321, 2009.
Rumori, M. U.: Das Phänomen der Sonifikation zwischen Musikgeschichte, Medientechnik und Markt. Das geschulte Ohr: Eine Kulturge- schichte der Sonifikation, edited by: Schoon, A. and Volmar, A., Bielefeld, 223–242, 2012.
Sapia, V., Viezzoli, A., Jørgensen, F., Oldenborger, G. A., and Marchetti, M.: The impact on geological and hydrogeological mapping results of moving from ground to airborne TEM, J. Env. Eng. Geophys., 19, 53–66, 2014.
Sapia, V., Oldenborger, G. A., Jørgensen, F., Pugin, A. J. M., Marchetti, M., and Viezzoli, A.: 3D modeling of buried valley geology using airborne electromagnetic data, Interpr., 3, SAC9-SAC22, 2015a.
Sapia, V., Viezzoli, A., Menghini, A., Marchetti, M., and Chiappini, M.: The Italian reference site for TEM methods, Ann. Geophys., 58, G0548, https://doi.org/10.4401/ag-6805, 2015b.
Schoon, A. and Volmar, A. (Eds): Das geschulte Ohr. Eine Kulturgeschichte der Sonifikation. Sound Studies, vol. 4 Bielefeld, 2012.
Sterne, J. and Akiyama, M.: The recording that never wanted to be heard and other stories of sonification, The Oxford Handbook of Sound Studies, edited by: Pinch, T. and Bijsterveld, K., Oxford University Press, 544–560, 2012.
Supper, A.: Sublime frequencies: The construction of sublime listening experiences in the sonification of scientific data, Soc. Stud. Sci., 44, 34–58, https://doi.org/10.1177/0306312713496875, 2014.
Viezzoli, A., Jørgensen, F., and Sørensen, K.: Flawed processing of airborne EM data affecting hydrological interpretation: Groundwater, 51, 191–202, https://doi.org/10.1111/j.1745-6584.2012.00958.x, 2013.
Villani, F., Sapia, V., Baccheschi, P., Civico, R., Di Giulio, G., Vassallo, M., Marchetti, M., and Pantosti, D.: Geometry and structure of a fault-bounded extensional basin by integrating geophysical surveys and seismic anisotropy across the 30 October 2016 Mw 6.5 earthquake fault (central Italy): The Pian Grande di Castelluccio basin, Tectonics, 38, 26–48, https://doi.org/10.1029/2018TC005205, 2019.
Walker, B. N. and Nees, M. A.: The Theory of Sonification, in: The Sonification Handbook, edited by: Hermann, T., Hunt, A., and Neuhoff, J. G., 2, 9–39, Logos Publishing House, Berlin, Germany, 2011.
Watercutter, A.: “Nano Techno” is the best rap song about nanotech you'll hear all day, available at: http://www.wired.com/underwire/2011/09/nano-techno-rap/#more-78483 (last access: 2 November 2020), 2011.