the Creative Commons Attribution 4.0 License.
the Creative Commons Attribution 4.0 License.
Geo-locate project: a novel approach to resolving meteorological station location issues with the assistance of undergraduate students
Simon Noone
Alison Brody
Sasha Brown
Niamh Cantwell
Martha Coleman
Louise Sarsfield Collins
Caoilfhionn Darcy
Dick Dee
Seán Donegan
Rowan Fealy
Padraig Flattery
Rhonda McGovern
Caspar Menkman
Michael Murphy
Christopher Phillips
Martina Roche
Peter Thorne
The Global Land and Marine Observations Database aims to produce a comprehensive land-based meteorological data archive and inventory. This requires the compilation of available information on data from land-based meteorological stations from all known available in situ meteorological data repositories/sources at multiple timescales (e.g. sub-daily, daily, and monthly). During this process the service team members have identified that many of the data sources contain stations with incorrect location coordinates. These stations cannot be included in the processing to be served via the Copernicus Climate Change Service until the issues are satisfactorily resolved. Many of these stations are in regions of the world where a sparsity of climate data currently exists, such as Southeast Asia and South America. As such, resolving these issues would provide important additional climate data, but this is a very labour-intensive task. Therefore, we have developed the Geo-locate project – that enrols the help of undergraduate geography students at Maynooth University, Ireland – to resolve some of the land-based station geolocation issues. To date, we have run two Geo-locate projects: the first in the 2017/2018 academic year and the second in the 2018/2019 academic year. Both iterations have been very successful with 1926 of the 2168 total candidate stations ostensibly resolved, which equates to an 88 % success rate. At the same time, students have gained critical skills that helped to meet the expected pedagogical outcomes of the second-year curriculum, while producing a lasting scientific legacy. We asked the class of 2018/2019 to reflect critically upon the outcomes, and we present the results herein; these results provide important feedback on what students felt that they gained from their participation and how we may improve the experience and learning outcomes in future. We will be continuing to run Geo-locate projects over the next few years. We encourage other organizations to investigate the potential for engaging university students to help resolve similar data issues while enriching the student experience and aiding in the delivery of learning outcomes. This paper provides details of the project, and all supporting information such as project guidelines and templates to enable other organizations to instigate similar programmes.
- Article
(7357 KB) - Full-text XML
-
Supplement
(1506 KB) - BibTeX
- EndNote
The Copernicus Climate Change Service (C3S) Global Land and Marine Observations Database aims to produce a comprehensive land-based meteorological data archive and inventory spanning the entire history of instrumental observations. This requires the compilation of available land-based station meteorological data and information (metadata) from all known available in situ meteorological data repositories/sources at multiple timescales (e.g. sub-daily, daily, and monthly) (Thorne et al., 2018). Observations form the foundational basis for understanding how our climate has changed and continues to change. By collecting, documenting, and curating these sources in partnership with the National Oceanic and Atmospheric Administration's National Centers for Environmental Information (NOAA/NCEI) the long-term and fail-safe availability of these meteorological data sources can be assured for future generations.
This work is being carried out by the Irish Climate Analysis and Research UnitS (ICARUS), Maynooth University, Ireland (lead institute), under contract with C3S. The C3S aims to support adaptation and mitigation policies of the European Union by providing consistent and authoritative information about climate change (https://climate.copernicus.eu, last access: 7 November 2019). C3S is implemented by the European Centre for Medium-Range Weather Forecasts (ECMWF) on behalf of the European Commission to make climate data and information more easily available to society. To assist us in this task we have sub-contracted partners in the United Kingdom (UK) at the Met Office, the National Oceanographic Centre, and the Science and Technology Facilities Council. We are also working closely with NOAA/NCEI, who are based in the United States. Data sources for the database include major collections of historic weather data archived at NOAA/NCEI, as well as substantial holdings of meteorological in situ observations used for numerical weather prediction and climate reanalysis at ECMWF. Many additional sources of data from national weather service providers, atmospheric research institutions, and the multitude of historical data rescue activities taking place around the world will also be included.
Building the database requires the development of data source inventories, retrieving data from all available sources, converting the data to a common representation, merging them into harmonized records, and applying quality checks at all levels. Over time, the database will be continually updated with additional observations as they become available. Access to the database will be provided by C3S via an internet-based climate data store (CDS) (https://cds.climate.copernicus.eu, last access: 7 November 2019), which will also offer many other datasets and tools needed to enable the development of applications of the data for a variety of purposes.
However, while compiling these data inventories it has become clear that many data sources contain stations with demonstrably incorrect location coordinates. This is most obvious for those land-based stations which, when mapped, have coordinates that situate them over a water body. Until such issues are resolved, these stations cannot be included in the process to be served via the CDS. Critically, many of these issues are related to stations located in regions of the world where a sparsity of climate data currently exists, such as Southeast Asia and South America. Therefore, a goal of this classroom-based exercise was to resolve these station location issues so that these important stations can be included in the CDS.
Resolving data issues using a crowdsourced student approach
Once the questionable station location issues have been identified it can take a considerable amount of time and resources to resolve the correct geolocation. In most cases a lack of station metadata (historical station information) can hinder this task. Nevertheless, the process is relatively simple and repetitive in nature with the same sequential steps required to try to remedy the situation each time. The methods are inherently geospatially based. Taking advantage of the nature of the problem and noting the concurrent need to refresh and revamp our undergraduate programme to meet new stated educational curriculum expectations (Sect. 5), we implemented a pilot project, which was rolled out to undergraduate geography students. These students are in their second year of a 3-year degree at Maynooth University in Ireland, and this project forms part of the geographical research methods class which is a mandatory module. Previously, this class had considered a range of method-based problems, but these were based upon existing data and had no broader benefit beyond the educational outcomes for the students. The revamped citizen science-based approach was far better at meeting the stated target educational outcomes for the year as discussed further in Sect. 5 of this paper.
The concept of crowdsourcing or citizen science is not new, with many global projects recruiting millions of citizens between them to help with specific labour-intensive tasks. Many of these volunteers are non-scientists, yet with appropriate guidance and instruction they can help with tasks such as data transcription, data verification or categorization, as well as conducting analyses of all types of scientific data (Bonney et al., 2018). There have also been substantial efforts regarding climate data rescue, which involves the digitization and transcription of recorded instrumental observations and climate data that is at risk of being damaged or lost (World Meteorological Organization, 2016). For example, in the climate research sphere, OldWeather.org (https://www.oldweather.org, last access: 7 November 2019), IEDRO.org (http://www.iedro.org), the International Data Rescue (I-DARE) (https://idare-portal.org/, last access: 7 November 2019), and Weather Rescue (https://www.zooniverse.org/projects/edh/weather-rescue, last access: 7 November 2019) all have ongoing projects that successfully recruit help from citizens to rescue environmental and climate data. Important work to rescue historical climate data in regions such as Africa, Europe, and Australia has also been undertaken using citizen science and crowdsourcing (Ashcroft et al., 2016; Brönnimann et al., 2018; Jacobsen et al., 2018; Kaspar et al., 2015). Other projects such as the Cyclone Center (https://www.cyclonecenter.org/, last access: 7 November 2019) and the Climate CoLab (https://www.climatecolab.org/page/about, last access: 7 November 2019) engage the help of thousands of individuals to analyse and/or verify climate data. In addition, projects like climateprediction.net (http://www.climateprediction.net/getting-started/, last access: 7 November 2019) are successfully running climate modelling experiments using the combined power of the home computers of thousands of volunteers.
Crowdsourcing can also have explicit educational aims. For example, the Global Learning and Observations to Benefit the Environment (GLOBE) (https://www.globe.gov/about/overview, last access: 7 November 2019) platform is an international science and education programme that works with citizens, students, teachers, and scientists across the globe, helping them partake in data collection and the scientific process. This initiative allows the contributors to help the scientific community better understand the Earth system and global environment, while providing them with important insights into real-world research (Allan et al., 2011; Mitchell et al., 2017; Vitone et al., 2016).
Until recently there had been little effort to integrate such approaches explicitly into the tertiary education classroom. Such approaches have potential co-benefits in terms of educational outcomes but also allow a cohort of interested students to carry out activities with expert instruction and support. Maynooth University has undertaken the following two substantive efforts to integrate such approaches into the classroom and assess the results via its geography programme in recent years.
-
Ryan et al. (2018) showed that with careful guidance and planning a module for university students could be developed, where students could help with important data rescue tasks. The study developed an accredited assignment for final year geography undergraduate students at Maynooth University. The students were given the tools to successfully transcribe 1300 years of Irish daily precipitation records from scanned hard-copy sheets (Ryan et al., 2018). Students also provided feedback on the module, with more than 90 % of students providing a positive response on all aspects of the assignment. Since that publication a further 2 years of the assignment have been run, and across three cohorts of students in excess of 4000 station years of early daily Irish rainfall records from across the island of Ireland have been digitized in collaboration with the Irish Meteorological Service, Met Éireann.
-
Phillips et al. (2018) assessed whether citizen science projects could be used as coursework with real practical experiential-learning benefits, without affecting the citizen science project outcomes. Two groups of university students (from Maynooth University and the University of North Carolina Asheville) and citizen volunteers were compared and assessed on their participation in the Cyclone Center project using a skill score metric developed by Knapp et al. (2016). The results showed that there were no substantive differences in cyclone classification between credit-awarded and volunteer participants (Phillips et al., 2018). Interestingly, the study noted that students generally had a positive opinion of participating in a citizen science project and of completing such a nontraditional assignment.
Both studies noted that their work demonstrates the potential for future projects to be developed that engage university students in meaningful real-world research (Phillips et al., 2018; Ryan et al., 2018) which is the goal of this project. The remaining sections of this paper are structured as follows: Sect. 2 presents details regarding identifying the station location issues; Sect. 3 presents details regarding the Geo-locate project, which includes the workflow instructions given to students; Sect. 4 provides details regarding the results of the first 2 years of the Geo-locate project; Sect. 5 gives details regarding pedagogical aims of the geography department and the expected learning outcomes of the module, as well as details regarding what the students gained from doing the assignment. The same section also presents the results of a project feedback survey that students were asked to complete. In Sect. 6, we describe the ongoing work and future challenges with respect to stations location issues. Finally, Sect. 7 presents some final comments and concluding remarks.
To quantify the number of currently inventoried land-based stations that were potentially situated over a water body, mapping software tools were used. All of the station location points were first mapped according to the coordinates provided in each data source. Next, using the mapping tools, all station points were overlaid on a global country boundary shape file. Stations that did not lie within the shape file land boundaries were deemed to be situated in the ocean. Using this process, a total of 7975 stations with daily data and 9144 stations with monthly data have been identified in the sources inventoried to date as not being situated on land. These spurious station location cases arose from a broad range of primary data sources. They were next checked to see if they could be identified as actual buoys, platforms, or ships. If not, then they were extracted from the inventory for further consideration.
Figure 1 shows the stations with daily and monthly data that have been identified as having location issues. These stations are classified as land-based stations, but are located over a water body, with most stations lying just off the coast, which indicates a geo-coordinate precision issue. To give a sense of the scale of the location problems, Fig. 2 presents a histogram of the number of stations (with both daily and monthly data) and the distance from land in metres (m). Figure 2 also shows that 10 256 stations located in the ocean are within 1000 m of land, 1259 are within 4000 m, 876 are within 7000 m, 423 are within 10 000 m, 255 are within 13 000 m, 146 are within 16 000 m, and the balance of 66 stations are within 22 000 m. There were 2838 stations that could not be mapped due to missing latitude or longitude coordinates. The results in Fig. 2 show that most stations lie within 1000 m (1 km) of land, which suggests that they are either lighthouses, platforms, buoys, or that they are land stations with coordinate precision issues.
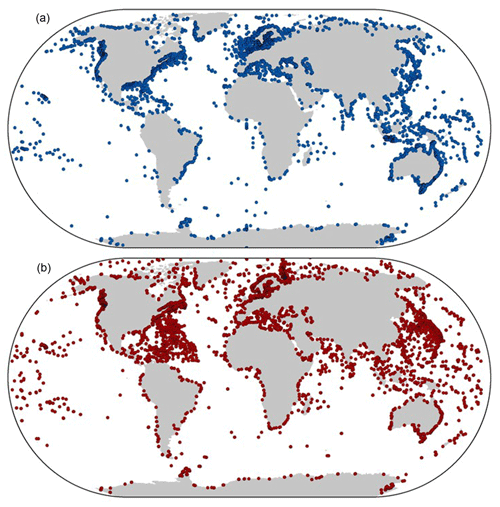
Figure 1Map location of the stations identified with location issues. Map (a) shows daily stations (blue dots) and map (b) shows monthly stations (red dots).
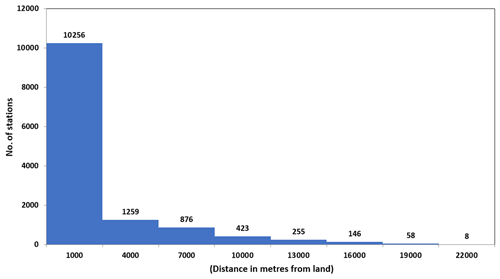
Figure 2Histogram of the number of stations in each bin based on the distance in metres of each station from land.
The stations with daily data are from 58 different data sources, whereas the stations with monthly data are from 41 different data sources (Table S1 in the Supplement). The majority of the daily station location issues were identified in two sources; NOAA/NCEI's Global Summary of the Day (GSOD) product (2506 stations) and the Global Historical Climate Network Daily (GHCND) dataset (1649 stations). The remaining 56 sources with daily data contain an average of 68 stations with the location issues per source ranging from 1 to 881 stations per source. At the monthly time step the UK Met Office data source has the most station location issues, with 2511 stations identified, and the Monthly Climatic Data for the World (MCDW) data source has the second most, with 844 station location issues identified. The remaining 39 monthly data sources contain an average of 148 stations per source ranging from 1 to 784 stations per source (Table S2 in the Supplement).
Another issue which has come to light involves station clustering along the prime meridian which suggests station geolocation issues. These stations were also extracted from the inventory but are not considered further here. Undoubtedly, there are additional station coordinate issues that lead to the incorrect placement of sites over land (as opposed to over water). Future checks are planned to use comparisons between target stations and apparent neighbouring stations or comparisons to reanalysis products to identify such cases, but this is outside the scope of the present analysis. Such comparisons should highlight stations that are grossly mislocated based upon both the phase and amplitude of annual cycles and synoptic features.
We developed the Geo-locate project so that we could enrol the help of second-year undergraduate geography students at Maynooth University to resolve some of the land-based station geolocation issues identified. The pilot first round of the Geo-locate project was run in the second semester of the 2017/2018 academic year. For this pilot we began with 880 daily resolution stations identified as having location issues. It was decided that three different students would attempt to resolve each station to try and attain triple verification of the revised location. We produced 88 excel sheets with 10 stations in each and divided the 264 students into three groups; each group of 88 was allocated the same 88 excel sheets with one sheet per student.
Each of the stations was supplied with the associated geographic coordinate information, which was known to be incorrect as it placed the station over water. All of the stations that the students worked with were reporting as land-based stations. These stations will, in general, be over water for some combination of resolvable issues. These could include imprecise geographic coordinate information, the incorrect conversion from degrees, minutes, and seconds to decimal degrees, e.g. dropped minus signs placing the station in the incorrect hemisphere (N–S or E–W), or, simply, missing coordinates.
Students were assigned with carrying out a sequential set of tasks to gather evidence to support the relocation of each of the stations and to provide all available evidence to support their conclusions as to why a station's coordinates should be as they indicated. They needed to employ a variety of research tools, including Google Earth, Google Maps, web searches, recourse to dedicated climate data information sources, and a variety of additional research tools and information to determine the improved location of their allocated stations.
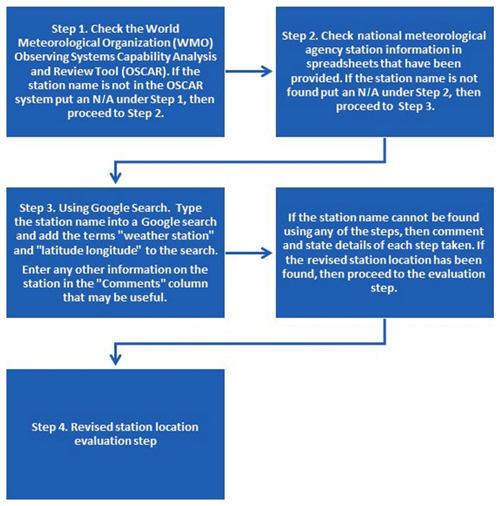
The students were provided with step-by-step instructions and guidance on how to best resolve the station location issues. A copy of the student handout sheet that describes the guidance and steps required to complete the assignment is available in the Supplement. Figure 3 shows a summary workflow of the guidance and steps that students were asked to follow. Initially, students were tasked with mapping the stations by importing the station data into Google Earth and visualizing the current station locations. For many of the existing station locations, students were able to determine/narrow down the research focus based on viewing the station locations relative to the surrounding land and the labelled features on the map which may correspond to the station name.
Step 1 involved students first checking the World Meteorological Organization (WMO) Observing Systems Capability Analysis and Review Tool (OSCAR) (https://oscar.wmo.int/surface//index.html#/, last access: 7 November 2019) to see if the station name existed in the database. The OSCAR database is the official metadata repository of the WMO Integrated Global Observing System (WIGOS) for all surface-based observing stations and platforms. For more information see https://www.wmo.int/pages/prog/www/wigos/index_en.html (last access: 7 November 2019). If the station name was not found in the OSCAR database, students were asked to enter the details of their search on their allocated student sheet and move on to the next step. Step 2 involved students checking to see if the station was contained in any of the national meteorological agency station information sheets that were provided. If the station was not in any of the information sheets, the students were again asked to comment and then move on to Step 3. In Step 3, it is suggested that students conduct a web search combining the station name plus some key terms such as “weather station” and “latitude longitude” to try and find any relevant information. If the station name cannot be found using any of the steps, then students were to comment that this station could not be found and record details regarding each step taken. If a revised station location was found, students were required to proceed to the evaluation step. As an extra step, students were required to try to verify the coordinates using alternative sources. For example, even if the WMO OSCAR database contained geographic coordinates for a station, students were asked to verify the coordinates provided by OSCAR by following the instructions in Step 2 (i.e. performing a Google search to locate a country's meteorological agency website and then looking for the station coordinates on the site or checking in one of the station information files that were provided). A snapshot of an example of a completed student sheet is given in the Supplement and shows the details of each step undertaken as well as the outcome.
During the project, teaching staff (consisting of faculty, postdocs, and postgraduate students) provided ongoing support to the second-year students including regular scheduled workshops and question and answer sessions via an online forum. We developed short video tutorials for each of the steps outlined above that students could access via an online e-learning environment. The overall aims and goals of the Global Land and Marine Observations Database activity were also delivered via an introductory lecture by the lead author of the present study. In addition, Dick Dee, the deputy head of the Copernicus Climate Change Service at the time, contributed an introductory video piece outlining the importance of the students' work. The video was shown to students during the introductory lecture to help motivate the students and make them aware of the wider importance of the project to the scientific community. A copy of the Dick Dee introductory video is available at https://doi.org/10.5446/41783.
The assignment deliverables and subsequent project marks (worth 50 % of the overall module) were based on the students completing the following:
-
A spreadsheet with the station list, original coordinates, and new, updated coordinates. The spreadsheet also required the student to detail how they obtained the updated coordinates and to add comments briefly outlining the sources for the new coordinate information and their justification. An example spreadsheet template is provided in the Supplement. Marks for the completed station .xls file were based on the number of stations completed with full details/comments/supporting information (35 %). However, students were not penalized marks if they were unable to find the correct location, so long as they provided full details of all of the steps conducted and included a full traceable account.
-
A group presentation detailing the research methodology that students undertook to identify and correct each station's geographic coordinates. The presentation should have contained an overview of the arguments to support the relocation of each station to its new location (15 %).
The Geo-locate project has now been run over the 2017/2018 and 2018/2019 academic years. The results are discussed in the following two subsections. Lessons learnt from the pilot project in 2017/2018 were applied in the following year, achieving both greater levels of output and an improved learning experience. In both years a substantial number of geolocation issues appear to have been resolved. The updated station locations from the Geo-locate project must be treated as approximations of the actual locations. Following the student assessment, the locations are now plausible enough that they can be used for certain applications. However, in the available archives, the true location of a station is often unknown owing to poor documentation and retention of metadata, so this is not too distinct from how other station locations from many sources must be treated. The updated locations and the metadata trail of the decisions made will be captured and used in the C3S Global Land and Marine Observations Database and at NOAA/NCEI.
4.1 Pilot project
During the pilot project students attempted to resolve location issues at 811 stations. There were some initial problems with the distribution of the station sheets to the students, so 69 stations were not attempted. In addition, not all of the 811 stations were attempted by three different students (triple verification). The results show that 79 stations (10 %) were attempted by one student, 310 stations (38 %) were attempted by two students, and 422 stations (52 %) were attempted by at least three students; of the latter 422 stations, 38 stations were attempted by four students.
The updated geo-coordinates for all stations with single attempts required further checks by a service team member as a matter of course. Due to a lack of consistency between independent student assessments many of the other updated station locations were also checked by a service team member. These additional checks involved using mapping tools to map the updated station locations to visually check the validity of the revision. In addition, the distance between updated coordinates and original coordinates was assessed. Any updated station location greater than approximately 33 km (0.3∘) from the original station location was also checked. Furthermore, Google Earth was used to zoom into the updated station location to verify the revision. The student comments were also read to make sure they made sense and that they had provided enough evidence to verify the updated location.
A service team member had to check and verify 249 station locations for the pilot project, and, as a result, only 77 station geo-coordinates had to be updated due to errors by students. In other words, less than 10 % of the 811 stations attempted by students had to be updated to the correct geo-coordinates by a service team member, which builds confidence in the efficacy of students to undertake the project. It is important to note that due to the information provided by the students these extra checks were much faster than trying to resolve the original station location issues from the beginning of the process. Upon completion of all of the extra checks, 794 station location issues were resolved (98 %) from the 811 stations attempted. By a reasonable estimate, getting these checks done from the beginning of the process by service team members would have taken in the order of 1–2 h per station, equating to 4–5 person months of effort. The old English proverb “many hands make light work” applies, in that by spreading the task across many individuals the workload on any one individual becomes much less onerous.
Many of the stations for the pilot project are situated in countries with sparse meteorological data coverage where the resolution of individual issues has the greatest value to climate service users. Solving geolocation issues in data-rich regions provides an incremental improvement, whereas in a data-sparse or data-void region this is a substantial advance. The 811 stations attempted in the pilot project derived from 11 data sources (original data provider) with a varying number of stations from each source and records at these stations spanning 1849–2017. Figure 4 shows a map of stations located in Java and parts of Indonesia that were identified as having geolocation issues – the blue dot represents the original locations and the red dot denotes the updated revised locations. Similar information is shown in Fig. 5 for Malaysia, Sumatra, Kalimantan, Sulawesi, and parts of the Philippines, Thailand, Vietnam, and Cambodia; Fig. 6 shows northern Australian stations; Fig. 7 shows stations located in Mexico.
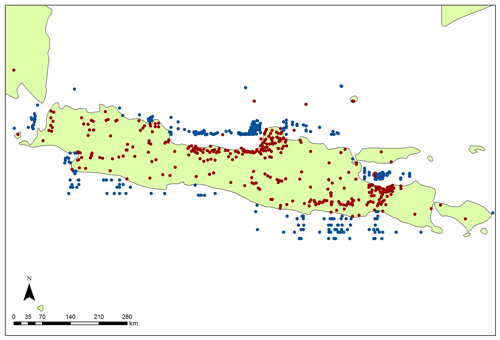
Figure 4Map of the original station location situated in the ocean (blue dots) and the updated station location (red dots) for Java and parts of Indonesia.
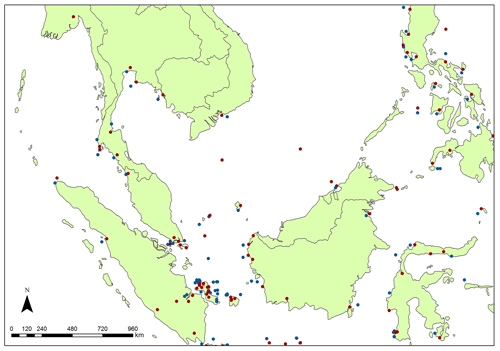
Figure 5Map of the original station location situated in the ocean (blue dots) and the updated station location (red dots) for Malaysia, Sumatra, Kalimantan, Sulawesi, and parts of the Philippines, Thailand, Vietnam, and Cambodia.
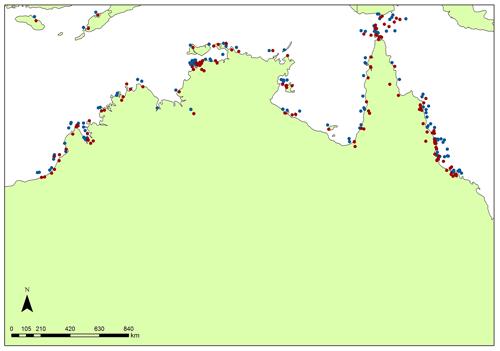
Figure 6Map of the original station location situated in the ocean (blue dots) and the updated station location (red dots) for northern Australia.
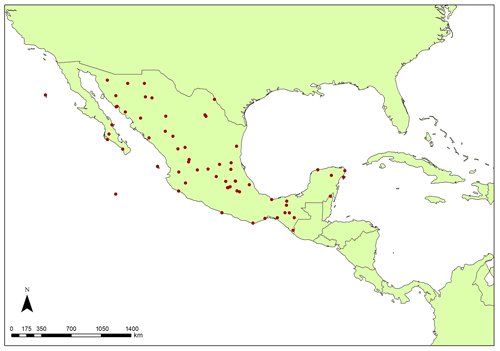
Figure 7Map of the updated station location (red dots) for Mexico. No original location coordinates were available.
The issue with many of these stations located in Australia and parts of Southeast Asia appears to have been the lack of precision in the original latitude/longitude coordinates, which resulted in many stations being incorrectly located off the coast. Other issues also existed such as the coordinates were not converted from the original degrees, minutes, and seconds to decimals correctly, or even not at all. Another common error was that the latitude was entered as longitude and vice versa. The stations located in Mexico had no original station coordinates, but when it was verified that the station names matched up with the city or town of the new location and that the new location made sense, they also were recoverable.
4.2 Results of round two of the Geo-locate project
Based on the what was learnt from the pilot module, it was decided that it would be acceptable for each station to be attempted by two different students as there is a requirement for extra checks by a service team member regardless (as outlined in Sect. 3.1). It was also decided that students should be given 15 stations per sheet in round two, which was an increase of 5 stations per sheet from the pilot project. In the second round of the project we were also able to supply more current global national meteorological service station information sheets. In providing more station information sheets we would expect that some of the station location issues will be resolved much more quickly as they contain correct land-based station location coordinates. It was also important to ensure that the station sheets were distributed correctly to the students so that each of the stations was attempted by two students. The sheets were compiled and distributed to the student groups using the same methods as the pilot scheme outlined in Sect. 2. We divided the total number students into two groups, and each group was allocated a duplicate set of excel sheets with one sheet per student.
For round two, 100 sheets containing 15 stations (1500 stations) with location issues were produced for students. The 1500 stations derived from 33 original sources with a global spatial extent and spanned from 1797 to 2017. There were 198 students registered for the module and 181 completed station sheets were returned, which related to 1357 stations. Of these there were 18 station sheets that could not be processed due to file corruption and/or not being correctly completed. The 163 completed station sheets were merged together, and stations were sorted by name and checked by a service team member to verify that the revised coordinates were correctly entered. The revised station locations were checked using the same pilot project methods described in Sect. 3.1. The results showed that there were 1222 stations attempted in round two of the project. There were 1170 stations (95 %) attempted by two students, 30 stations (2 %) had revised locations but had only been attempted by one student, and for 22 stations (2 %) location issues could not be resolved. Of the 1222 stations attempted, a total of 91 (7 %) were found to be marine stations such as lighthouses, buoys, or ships. A service team member had to conduct extra checks on 402 stations (33 %) due to a lack of consistency in the students' revised station location information. In total, round two of the Geo-locate project resolved 1132 unique land-based station location issues and verified that 91 stations were in fact marine-based stations.
Consistent with the pilot phase, the issues with the coordinates in round two appear to be mainly due to poor coordinate precision with most stations incorrectly located just off the coast. The coordinate precision issue meant that many of the stations which should have been located on small islands across Canada, Alaska, northern Europe, the United States, and Japan were incorrectly located in the ocean. In addition, station names were found to be incorrectly spelt, which was also rectified when identified and may aid subsequent station series merging activities. Figure 8 shows a map of stations located in their original incorrect locations (denoted by blue dots) and the revised location (denoted by red dots) for Japan. Figure 9 shows the original and revised locations of stations in northern Europe, and Fig. 10 shows the stations located in the eastern region of Canada. It must be noted that some of the stations in Canada and northern Europe were identified as actual buoys. Also, some stations in the Gulf of Mexico were identified as static marine platforms and others located around the coastline of different countries were identified as lighthouses.
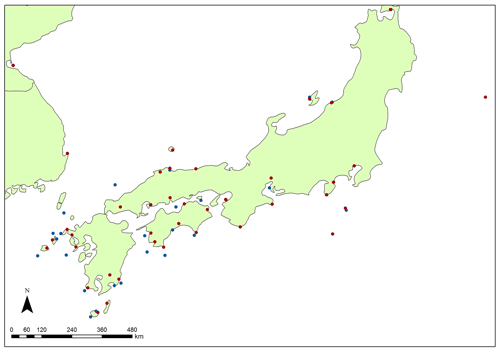
Figure 8Map of the original station location situated in the ocean (blue dots) and the updated station location (red dots) for Japan.
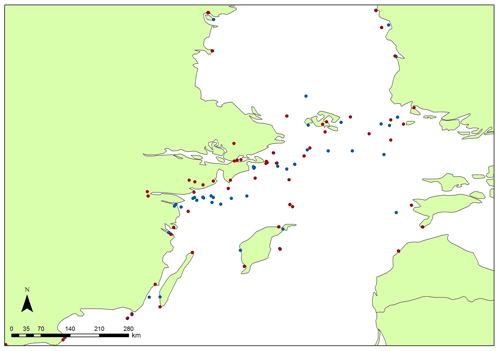
Figure 9Map of the original station location situated in the ocean (blue dots) and the updated station location (red dots) for parts of northern Europe.
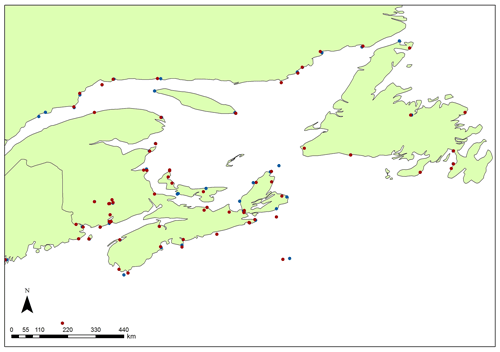
Figure 10Map of the original station location situated in the ocean (blue dots) and the updated station location (red dots) for eastern parts of Canada.
The second iteration was slightly more successful than the pilot project, with an increase in the number of station location errors being resolved by fewer students. In the pilot project the students resolved 794 station location issues with 264 participants. However, project two resolved 1132 land-based stations and 91 marine stations with 181 participants, which is 83 students fewer than the pilot project. In addition, it took service team members only 3 d to collate and check the revised stations in round two, whereas the pilot project stations took over a week to sort and check. The increased efficiency in round two may be due to students having access to more national meteorological agency station information sheets. In addition, many of the revised station locations had been verified by two students which made checking much faster. These results indicate that project two was more efficient as measured by scientific outputs.
The following statement is taken from the Department of Geography second-year student handbook and sets out the newly revised pedagogical aims of the department's teaching in that year of the programme which this assignment partially aimed to fulfil.
The focus of this second year of the Geography undergraduate programme is on Methods and the Systematic Branches of the Discipline. Students are introduced to different systematic branches of Geography and learn that within both human and physical Geography there have emerged distinctive sub-areas with their own concerns and trajectories. In parallel, year 2 foregrounds the teaching of basic research methods. Students learn to work as individuals and as part of teams, and in the laboratory and in the field, to identify, source, collect and analyse primary and secondary data, and to evaluate and present research results and findings. In addition, students are provided with the opportunity of applying the research skills acquired in year 2 through field work in Ireland and overseas. All students will also learn the basics of GIS (van Eggeraat, 2018).
The specific expected student learning outcomes of the second-year “Methods of Geographical Analysis” (GY202) module, of which the Geo-locate project was part, are as follows.
Upon successful completion of the module, students should be able to
-
develop further data collection, processing, computer, and presentation skills, based on work in first year and in GY201;
-
learn the skills required for work in second- and third-year geography;
-
develop group working and co-operation skills;
-
gain basic experience of research methodology, which is useful in many areas of employment;
-
apply theoretical learning in practical situations;
-
relate theoretical learning to a local environment.
The Geo-locate project was designed to meet the geography department pedagogical aims and the module student learning outcomes. In particular, the project encouraged students to use several research methods new to them, working both as an individual and as part of a team. In addition, students had to explore various online investigative skills to try and learn how to access, collect, compare, and present different sources of information and data to resolve the station location issues. The project was designed to help students develop reasoning skills and allow students to gain computer and presentation experience. Students also used geographical information systems (GIS) in the form of Google Earth mapping tools. Overall, the expectation was that the assignment should provide them with improved spatial awareness and a better understanding of potential issues with real-world data which they may well work with in their future careers. The Geo-locate project allowed the students to work with real data issues, be part of, and contribute to, a real-world climate data project. Thus, the Geo-locate project played a substantive role in delivering the second year and module-specific pedagogical outcomes.
Results of student feedback survey
A formal student feedback survey was also implemented in round two of the Geo-locate project to gain some more quantitative insights into what students thought of the assignment and to hear some suggestions on how we could improve the assignment. The survey was completely anonymous to ensure that the students could express their true opinions. A copy of the feedback survey sheet given to students is provided in the Supplement.
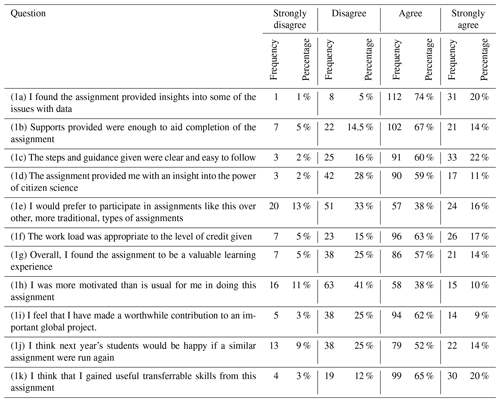
The student feedback survey was made available online and 152 students from the 2018–2019 student cohort participated in reviewing the second iteration of the project. Survey questions 1a to 1k asked the students to indicate the extent to which they agreed or disagreed with specific statements about the project. Table 1 presents each of the questions and the subsequent results. Overall positive responses were received from students as follows:
-
a total of 74 % of students agreed and 20 % strongly agreed that they had gained important insights into data issues, while only 5 % disagreed and fewer than 1 % of students strongly disagreed;
-
67 % agreed and 14 % strongly agreed that the supports in place were sufficient to aid them with completion of the assignment, whereas 14 % of students disagreed and only 5 % strongly disagreed;
-
60 % of students agreed and 22 % strongly agreed that the guidance given for the project was clear and easy to follow, whereas 16 % disagreed and only 2 % strongly disagreed;
-
59 % of students agreed and 11 % strongly agreed that they gained insight into citizen science, whereas 28 % of students disagreed and only 2 % strongly disagreed;
-
students were more divided on whether they would prefer further such assignments to more traditional assessment approaches with 38 % of students stating that they agreed and 16 % strongly agreeing, but 33% disagreeing and 13 % strongly disagreeing;
-
most students indicated that the work load was appropriate for the level of credit, with 63 % students agreeing and 17 % strongly agreeing while 15 % disagreed and only 5 % strongly disagreed;
-
57 % of students agreed and 14 % strongly agreed that the assignment was a valuable learning experience, although 25 % of students disagreed and a further 5 % strongly disagreed;
-
most students felt that they had made a worthwhile contribution to an important global project, with 62 % agreeing and 9 % strongly agreeing, while 25 % disagreed, 3 % strongly disagreed, and one student omitted to answer the question;
-
most students thought that subsequent cohorts of students would be happy doing a similar assignment with 52 % of students agreeing and 15 % strongly agreeing as opposed to 25 % who disagreed and 9 % that strongly disagreed;
-
most students felt like they gained some useful transferrable skills from the assignment as outlined in Sect. 5, with 65 % agreeing and 20 % strongly agreeing, while 13 % disagreed and only 3 % strongly disagreed;
-
fewer than 50 % of students were more motivated than usual in doing this assignment, with 38 % of students agreeing and 10 % strongly agreeing while 41 % of students disagreed and 11 % strongly disagreed.
The authors are not experts in designing surveys, and as such the wording of some of the survey questions may have influenced the students' responses. This wording will be reviewed in subsequent surveys. For example, fewer than 50 % of students felt that they were more motivated than usual doing this assignment. This response is somewhat contrary to previous research (Ryan et al., 2018) and is somewhat contradictory to the balance of evidence arising from the other survey responses which are generally positive. However, one can also interpret this result as not being overly negative as it suggests that students were no less motivated than usual doing the assignment. The wording of this question may have confused students, and we will consider changing the wording in future to remove any ambiguity in interpretation.
Table 1Results of the survey questions (1a–1k) that asked the students to indicate the extent to which they agree or disagree with specific statements. The frequency of responses and the percentage of the total responses to each question are presented (152 students participated in the survey).
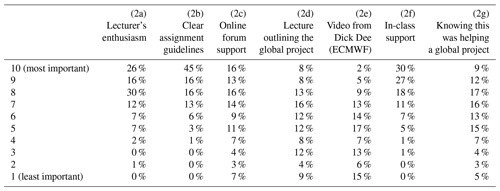
Question 2 (a–g) of the survey asked students to give a score from 1–10 to a list of items, indicating how important each item was in enabling them to successfully complete the assignment. (1 being important and 10 being very important.) There were 152 students that responded to question 2 (a–g). Table 2 presents all of the responses to the question as a percentage of the total responses. The following are ordered by what the student's perceived to be of most importance based on their responses:
-
The students felt that the clear assignment guidelines were the most important aspect with over 96 % of the responses between 6 and 10 and over 77 % of responses between 8 and 10.
-
The in-class support ranked second with respect to importance with 93 % of responses between 6 and 10 and 75 % of responses between 8 and 10.
-
Most students felt that the lecturer's enthusiasm was third most important and enabled them to successfully complete the assignment. Over 91 % of the student responses were between 6 and 10 and over 72 % of the responses were between 8 and 10 for this aspect.
-
Online support for students was the next most important with 68 % of responses between 6 and 10 and 45 % of responses between 8 and 10.
-
The fact that students knew that they were contributing to a real-world global project ranked as important, with over 67 % of responses between 6–10 and over 38 % of responses between 8 and 10.
-
The introductory video from Dick Dee of the ECMWF was the sixth most important with 43 % of responses between 6 and 10 and 16 % of responses between 8 and 10.
Question 3 of the survey asked students to indicate three aspects of this assignment that worked well, and 130 students responded. The results were analysed, and some common themes were identified. Over 70 students stated that the support and guidance that was provided to aid them in completing the assignment worked well. In addition, 51 students stated that they had gained some useful research methods and transferable skills from doing this assignment. The students also felt that working in teams was very useful and shared the workload, with 32 students making this statement. However, only 20 students stated that the time given to complete the assignment was adequate.
Table 2Results of question 2 (a–g) of the survey which asked students to give a score from (1–10) to a list of items, indicating how important each item was in enabling them to successfully complete the assignment. The table shows the percentage of the 152 responses to each question. (1 being least important and 10 being most important.)
Question 4 of the survey asked students to indicate three aspects of this assignment that could be improved, and 115 students responded. Again, some common themes were extracted from the responses. Although 4 weeks were allocated to complete the task, 34 students felt that there was not enough time, felt a bit under pressure, and suggested a reduction in the number of stations given to each individual to resolve. There were 29 students who mentioned that they would like clearer guidance and instructions on how to use the online resources such as the OSCAR/Surface web tool. There were 26 students who felt that more station list resources and potential online sources to find the stations should be made available to them. In addition, nearly 10 % of students said that clear instructions on what to do when a station could not be found should be outlined in the handouts.
The final question of the survey asked students to add any other thoughts/comments they had about the continuous assessment. Only 37 out of the 152 students responded to this question. There were 21 students who responded with negative comments and 12 with positive comments towards the assignment, the remaining 4 student comments were general. Some of negative comments stated that the assignment was too stressful, time consuming, difficult, boring, frustrating, and that not enough support was provided. Examples of some of the positive comments were that the assignment was enjoyable, extremely beneficial, rewarding, and real. Interestingly, these results show that a minority of students did not enjoy this assignment and decided to express this in the open-ended question rather than respond negatively to questions 1 and 2. However, despite this, the overall evidence presented in this section indicates that the project was well received by the students with most of them engaging fully in the process.
We have shown how second-year undergraduate students in the Maynooth University Geography department can help to rectify geolocation issues in global meteorological database holdings in a transparent manner while gaining valuable skills. Each iteration to date has been improved by reflecting critically upon the delivery and outcomes of the prior year(s). The problem set is well-suited to our second-year methods class, a compulsory module within the honours component of the degree. As resources permit, we aim to expand the exercise to provide an enriched learning experience as well as improved outcomes.
There is no shortage of further work. Currently as part of the C3S Global Land and Marine Observations Database we have inventoried 23 619 sub-daily stations derived from 51 sources, 173 782 daily stations from 137 sources, and 85 186 monthly stations from 55 sources. In addition, new sources of data are being acquired all the time which means that the potential issues with resolving station locations may be an ongoing challenge. For example, we are working closely with the C3S Data Rescue Service to ensure that all rescued climate data is deposited via the new data discovery and deposition web-based service which we are developing (Noone et al., 2019). Work is also ongoing in collaboration with the European Environmental Agency (EEA) in its capacity as the Copernicus in situ lead, and with ECMWF in its capacity as the entrusted entity for C3S. Additional data inputs for the database may also be secured based on the recently enacted EEA–EUMETNET (EUMETNET is a grouping of 31 European National Meteorological Services) agreement on data sharing. We have identified several thousand stations across the existing secured sources that require checking and it is all but certain that newly acquired sources will also contain geolocation issues. Therefore, there is likely to be no issue with running the Geo-locate assignment for years to come.
In terms of varying the nature of the problem set provided, as alluded to in the introduction, as well as stations incorrectly located over water which are easy to identify, if not to rectify, many could be incorrectly located on land. To identify such land-based locational outliers, we plan to develop a suite of data quality control checking tools. For example, pairwise homogeneity assessment could be used to identify any irregularities in data when compared with data from other stations within a given distance of each other (Dunn et al., 2014; Durre et al., 2008; Menne et al., 2012). This process will be automated as much as possible but there will be a need for visual checks. Stations identified via these approaches could constitute an additional valuable source of data for future iterations of the Geo-locate project providing a greater variety of issues for students and additional tools such as data comparison tools which may enable a more nuanced assessment in future as well as improving learning outcomes for the students.
A further innovation under active consideration could arise from the use of reanalysis data. Reanalysis provides datasets at regular intervals over long periods of time for climate monitoring and research (e.g. Dee et al., 2011) that are produced via data assimilation using a frozen version of a given forecast system. The C3S reanalysis data contains estimates of atmospheric variables such as air temperature, pressure, and wind at varying altitudes. Reanalysis also contains surface variables such as rainfall, soil moisture content, and sea-surface temperature. ECMWF reanalysis products provide estimates for all locations on Earth, and ERA5 will shortly extend back to 1950 (https://www.ecmwf.int/en/research/climate-reanalysis, last access: 7 November 2019). Longer-term reanalysis products now extend back over in excess of 150 years (Slivinski et al., 2019). To address the location issues over land, and also to confirm the relocation of stations currently located in the oceans, in future project iterations we are actively working with the reanalysis groups to investigate the potential to compare the station data with the reanalysis data at the same location or plausible alternative locations provided by the students to identify likely differences due to incorrect station locations. This shall require the development of underlying software and a web-based interface to enable the analysis but would add considerable flexibility and data analysis aspects to future assignments, enriching the learning outcomes.
There is also the potential to further extend the analysis of the data records. The second-year methods class runs throughout the academic year. The Geo-locate project has now been moved up to the first semester in the expectation that, in future years, students might be able to follow through in later assignments in the year which may also touch upon more human geography methodological aspects in addition. Examples could include, but are not limited to
-
an analysis of the station geophysical measurement series to consider climatology and climate trends in diverse regions of the world and identify potential data issues;
-
exploration of contemporary news archives to validate apparent extremes and place their societal and environmental impacts in context;
-
building station metadata histories via web-based searches
There are undoubtedly further opportunities that will arise over coming years.
The Geo-locate project which worked with second-year undergraduate geography students has been successful both in terms of educational outcomes and resulting geolocation issues resolution, with 1926 land-based stations with location issues in the original sources ostensibly resolved. In addition, the students identified 91 marine stations. This is a significant result as these stations can now be included in the inventory to be assessed for inclusion in the Copernicus climate data store (CDS). Such a result would have taken many person months, if not person years, of service team members' effort to achieve and would not have benefitted from multiple independent assessments. Many of these stations are situated in regions where there are sparse observations, and the inclusion of these stations in the CDS will allow for a more robust climate assessment in the future. An updated list of all of these stations will be made available through the service as metadata, which will also include all of the student comments and notes.
The results of the student feedback survey are generally positive and indicate that most students gained some of the useful transferrable skills outlined in Sect. 5 and felt like they were involved in a meaningful real-world project. In addition, the students generally felt that the support and guidance given were sufficient in helping them complete this assignment. We will be reading over all of the students' comments and suggestions (positive and negative) and will continue to evolve the project to ensure optimal educational outcomes. Based upon the successful educational outcomes and data problem resolutions attained in the first two rounds of the Geo-locate project, we aim to continue the project for many years to come. Finally, we would encourage other organizations to investigate the potential for engaging university students to help resolve similar data issues. Likewise, students can aid with other projects where labour-intensive tasks exist, and they can gain useful research skills and have the opportunity to work with real data.
The data for this paper were meteorological station metadata (station location errors) from multiple data sources. The Geo-locate project aimed to resolve some of these station location issues so that the data for these stations can be processed and included in the Copernicus C3S311a Lot 2 Global Land and Marine Observations Database to be served through the Copernicus Climate Data Store (https://cds.climate.copernicus.eu/\#!/home, last access: 7 November 2019). The completed student station sheets and revised station locations are available on request from the lead author: simon.noone@mu.ie.
Dick Dee, the then deputy head of the Copernicus Climate Change Service, contributed this introductory video piece outlining to students the importance of the Geo-locate project (Dee, 2018, https://doi.org/10.5446/41783).
The supplement related to this article is available online at: https://doi.org/10.5194/gc-2-157-2019-supplement.
SN prepared the manuscript with contributions from all the co-authors. DD contributed the video supplement. SN and PT were responsible for conceptualizing the Geo-locate project. SN, PT, MR, and RF all contributed to the development of the Geo-locate project for the students. SN was responsible for preparing and analysing the survey results. AB, SB, NC, MC, LSC, CD, SD, PF, RM, CM, MM, CP, and MR all taught the module and provided supports to the students throughout the Geo-locate project.
The authors declare that they have no conflict of interest.
This project could not have been completed without the help of the geography undergraduate students. The students who participated are listed in alphabetical order in the Supplement.
This paper was edited by Chris King and reviewed by two anonymous referees.
Allan, R., Brohan, P., Compo, G. P., Stone, R., Luterbacher, J., and Brönnimann, S.: The International Atmospheric Circulation Reconstructions over the Earth (ACRE) initiative, B. Am. Meteorol. Soc., 92, 1421–1425, https://doi.org/10.1175/2011BAMS3218.1, 2011.
Ashcroft, L., Allan, R., Bridgman, H., Gergis, J., Pudmenzky, C., and Thornton, K.: Current climate data rescue activities in Australia, Adv. Atmos. Sci., 33, 1323–1324, https://doi.org/10.1007/s00376-016-6189-5, 2016.
Bonney, R., Shirk, J. L., Phillips, T. B., Wiggins, A., Ballard, H. L., Miller-Rushing, A. J., and Parrish, J. K.: Next Steps for Citizen Science, 2018, available at: http://science.sciencemag.org/content/sci/343/6178/1436.full.pdf, last access: 29 August 2018.
Brönnimann, S., Brugnara, Y., Allan, R. J., Brunet, M., Compo, G. P., Crouthamel, R. I., Jones, P. J., Jourdain, S., Luterbacher, J., Seigmund, P., Valente, M. A., and Wilkinson, C. W.: A roadmap to climate data rescue services, Geosci. Data J., 5, 28–39, https://doi.org/10.1002/gdj3.56, 2018.
Dee, D.: Introduction to the Geo-locate project, TIB, https://doi.org/10.5446/41783, 2018.
Dee, D. P., Uppala, S. M., Simmons, A. J., Berrisford, P., Poli, P., Kobayashi, S., Andrae, U., Balmaseda, M. A., Balsamo, G., Bauer, P., Bechtold, P., Beljaars, A. C., van de Berg, L., Bidlot, J., Bormann, N., Delsol, C., Dragani, R., Fuentes, M., Geer, A. J., Haimberger, L., Healy, S. B., Hersbach, H., Hólm, E. V., Isaksen, L., Kållberg, P., Köhler, M., Matricardi, M., McNally, A. P., Monge-Sanz, B. M., Morcrette, J., Park, B., Peubey, C., de Rosnay, P., Tavolato, C., Thépaut, J., and Vitart, F.: The ERA-Interim reanalysis: configuration and performance of the data assimilation system, Q. J. Roy. Meteor. Soc., 137, 553–597, https://doi.org/10.1002/qj.828, 2011.
Dunn, R. J. H., Willett, K. M., Morice, C. P., and Parker, D. E.: Pairwise homogeneity assessment of HadISD, Clim. Past, 10, 1501–1522, https://doi.org/10.5194/cp-10-1501-2014, 2014.
Durre, I., Menne, M. J., and Vose, R. S.: Strategies for evaluating quality assurance procedures, J. Appl. Meteorol. Clim., 47, 1785–1791, 2008.
Jacobsen, K., Van Hirtum, L., Amara, M., Beeckman, H., Meeus, S., Vandelook, F., Stoffelen, P., Verbeeck, H., and Hutkens, K.: Climate data rescue from the Belgian colonial archives: helping to close the data-gap over Central Africa, Early Instrumental Meteorological Series conference and workshop, 18–21 June 2018, Bern, Switzerland, 2018.
Kaspar, F., Tinz, B., Mächel, H., and Gates, L.: Data rescue of national and international meteorological observations at Deutscher Wetterdienst, Adv. Sci. Res., 12, 57–61, https://doi.org/10.5194/asr-12-57-2015, 2015.
Knapp, K. R., Matthews, J. L., Kossin, J. P., and Hennon, C. C.: Identification of Tropical Cyclone Storm Types Using Crowdsourcing, Mon. Weather Rev., 144, 3783–3798, https://doi.org/10.1175/MWR-D-16-0022.1, 2016.
Menne, M. J., Durre, I., Vose, R. S., Gleason, B. E., and Houston, T. G.: An Overview of the Global Historical Climatology Network-Daily Database, J. Atmos. Ocean. Tech., 29, 897–910, https://doi.org/10.1175/JTECH-D-11-00103.1, 2012.
Mitchell, N., Triska, M., Liberatore, A., Ashcroft, L., Weatherill, R., and Longnecker, N.: Benefits and challenges of incorporating citizen science into university education, PLOS ONE, 12, e0186285, https://doi.org/10.1371/journal.pone.0186285, 2017.
Noone, S., Berry, D., Dunn, R., Perez-Gonzalez, I., Kettle, A., Menne, M., Stephens, A., Thorne, P., Tucker, W., Voces, C., and Willet, K.: Call for data contributions: A truly integrated global collection of historical surface meteorological observations, in preparation, 2019.
Phillips, C., Walsh, D., O'Regan, K., Strong, K., Hennon, C., Knapp, K., Murphy, C., and Thorne, P. W.: Assessing Citizen Science Participation Skill for Altruism or University Course Credit: A Case Study Analysis Using Cyclone Center, Citizen Science: Theory and Practice, 3, 6, https://doi.org/10.5334/cstp.111, 2018.
Ryan, C., Duffy, C., Broderick, C., Thorne, P. W., Curley, M., Walsh, S., Daly, C., Treanor, M., and Murphy, C.: Integrating data rescue into the classroom, B. Am. Meteorol. Soc., 99, 1757–1764, https://doi.org/10.1175/BAMS-D-17-0147.1, 2018.
Slivinski, L. C., Compo, G. P., Whitaker, J. S., Sardeshmukh, P. D., Giese, B. S., McColl, C., Allan, R., Yin, X., Vose, R., Titchner, H., Kennedy, J., Spencer, L. J., Ashcroft, L., Brönnimann, S., Brunet, M., Camuffo, D., Cornes, R., Cram, T. A., Crouthamel, R., Domínguez‐Castro, F., Freeman, J. E., Gergis, J., Hawkins, E., Jones, P. D., Jourdain, S., Kaplan, A., Kubota, H., Le Blancq, F., Lee, T., Lorrey, A., Luterbacher ,J., Maugeri, M., Mock, C. J., Moore, G. W. K., Przybylak, R., Pudmenzky, C., Reason, C., Slonosky, V. C., Smith, C. A., Tinz, B., Trewin, B., Valente, M. A., Wang, X. L., Wilkinson, C., Kevin Wood, K., and Wyszyński, P.: Towards a more reliable historical reanalysis: Improvements for version 3 of the Twentieth Century Reanalysis system, Q. J. Roy. Meteor. Soc., https://doi.org/10.1002/qj.3598, online first, 2019.
Thorne, P. W., Allan, R., Ashcroft, L., Brohan, P., Dunn, R., Menne, M., Pearce, P., Picas, J., Willett, K., Benoy, M., Bronnimann, S., Canziani, P., Coll, J., Crouthamel, R., Compo, G., Cuppett, D., Curley, M., Duffy, C., Gillespie, I., Guijarro, J., Jourdain, S., Kent, E., Kubota, H., Legg, T., Li, Q., Matsumoto, J., Murphy, C., Rayner, N., Rennie, J., Rustemeier, E., Slivinski, L., Slonosky, V., Squintu, A., Tinz, B., Valente, M., Walsh, S., Wang, X., Westcott, N., Wood, K., Woodruff, S., and Worley, S.: Towards an integrated set of surface meteorological observations for climate science and applications, B. Am. Meteorol. Soc., 98, 2689–2702, https://doi.org/10.1175/BAMS-D-16-0165.1, 2018.
van Eggeraat, C.: Second Year Geography 2018/19 handbook, available at: https://www.maynoothuniversity.ie/sites/default/files/assets/document/2nd year guide 18-19_0.pdf (last access: 7 November 2019), 2018.
Vitone, T., Stofer, K. A., Steininger, M. S., Hulcr, J., Dunn, R., and Lucky, A.: School of ants goes to college: Integrating citizen science into the general education classroom increases engagement with science, J. Sci. Commun., 15, 1–24, 2016.
World Meteorological Organization: Guidelines on Best Practices for Climate Data Rescue, WMO-No. 1182, WMO, Geneva, available at: https://library.wmo.int/doc_num.php?explnum_id=3318 (last access: 7 November 2019), 2016.
- Abstract
- Introduction
- Ascertaining the magnitude of the station geolocation issues
- Working with geography students at Maynooth University
- Results of the pilot Geo-locate project
- Pedagogical aims and learning outcomes as well as student experience and feedback
- Discussion and future plans
- Conclusions
- Data availability
- Video supplement
- Author contributions
- Competing interests
- Acknowledgements
- Review statement
- References
- Supplement


