the Creative Commons Attribution 4.0 License.
the Creative Commons Attribution 4.0 License.
 | 08 Jan 2026
How do we make a scan of Earth's oceanic crust?
Simon Besançon
Souradeep Mahato
David Hautemayou
Ted Luc
Like computed tomography (CT) scans used in medicine to look inside human bodies, marine seismologists conduct controlled-source experiments to understand the characteristics of the oceanic lithosphere (rigid outer Earth's layer) that covers > 70 % of the surface of our planet. While at sea aboard a research vessel, using the air compressed in an array of stainless-steel cylinders, we produce small earthquakes in the form of air bubbles that propagate through the water, Earth's crust, and mantle and return to be recorded by the instruments we place in the water column or on the seafloor. Although the technique was developed in the 1950s and has been extensively used by academia and industry for decades, it has remained obscured, primarily because it is conducted offshore, out of sight. To expose the less-known technique and to showcase associated career paths, we designed a hands-on model that encourages interaction. Together with the model, we present fundamental Earth processes and the methods we use to explore them, followed by video materials we recorded at sea while collecting the data. Furthermore, to quantitatively evaluate our effort, we constructed age-adapted control quizzes completed by the participants before and after the workshop. These quizzes were designed to assess the student's understanding of the concepts, providing a clear measure of the workshop's effectiveness. We have conducted the workshop package at several outreach events. Without any exception, the results of the quizzes show that students of ages 9–18 years improved their overall knowledge covered by the experiment. This result is a signal that supports the effectiveness of “learning by doing” science in a playful, interactive way.
- Article
(9187 KB) - Full-text XML
-
Supplement
(359 KB) - BibTeX
- EndNote


Seismologists record different types of seismic waves that propagate through the Earth's interior to understand its structure. For instance, by observing several records of an earthquake that struck a Croatian town ∼ 40 km from Zagreb on 8 October 1909, Andrija Mohorovičić noticed consistent, prominent blips originating at a depth of ∼ 50 km kilometers (Mohorovičić, 1910). They were explained by the strong contrast in density between the crust and mantle, now known as the Mohorovičić discontinuity or Moho for short. Similarly, a few decades later, Inge Lehman, a Danish seismologist, by observing anomalous arrivals in the recorded seismic signal at the remote stations in Siberia and their mysterious difference in travel time, discovered that the Earth's core has two distinct parts: an inner, solid core and an outer, liquid core (Lehmann, 1987). In addition to revealing the structure of the Earth, these bursts of energy represent one of the most prominent natural hazards, unfortunately, many with casualties, especially when associated with large tsunami waves (e.g., Sumatra Earthquake in 2004), extensive fires (San Francisco in the USA, 1906) and even bringing humanity at the edge of a nuclear disaster (Tōhoku Earthquake in Japan, 2011). As most of those prominent earthquakes occur along the plate boundaries that are dominantly covered by the ocean (Fig. 1), a number of instruments have been placed at its bottom for prolonged monitoring of Earth' seismic activity to provide the answer to the question of our time when and where will the next big one occur?
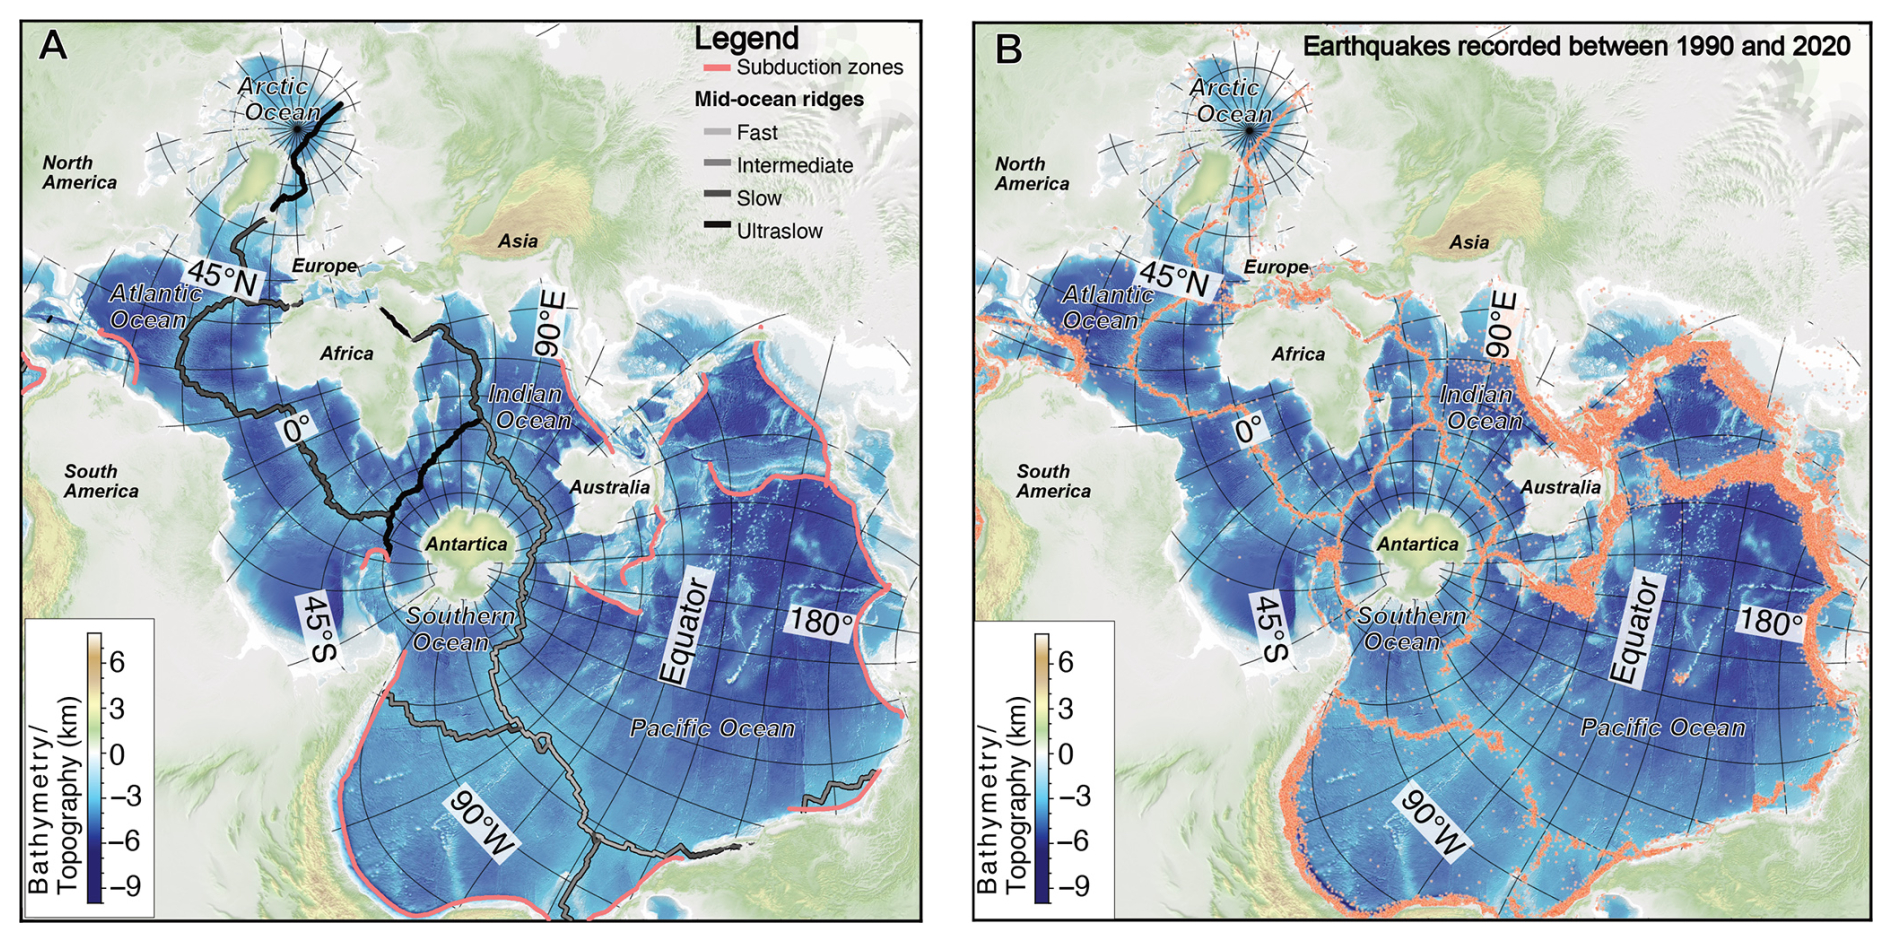
Figure 1Spilhaus global projection map offering a different view of the Earth's surface centered at Antarctica. With this projection we want to provide another view of our Blue Planet that places the ocean at is center. In panel (A), we outline plate boundaries. The subduction zones (locations where oceanic plate is sliding under the continental) and mid-ocean ridges (locations where two plates are separating) are outlined and defined in Legend; the shades of gray color represent the variation of full spreading rate along mid-ocean ridges (in millimeters per year). Based on the spreading rate we can distinguish the following categories: fast spreading with the spreading rate > 80 mm yr−1, intermediate ones with spreading rate between 40 and 80 mm yr−1, slow-spreading centers with the rate varying from 20–40 mm yr−1 and ultraslow where the plates are separating at the rate < 20 mm yr−1. In panel (B), we show the distribution of earthquakes which are predominantly occurring along the plate boundaries outlined in panel (A). The earthquakes are spanning the period from 1990 to 2020 (U.S. Geological Survey, 2022) and are indicated in pink dots. The maps are modified from Chen et al. (2023).
In parallel with learning about the deep Earth's interior and hazard mitigation, to extract more detailed information about the Earth's outer shell, i.e., the crust and upper mantle, a new branch of seismic techniques that uses man-made, tiny earthquakes (controlled source or active seismology) has emerged (e.g., Dragoset, 2005). The first application was reserved exclusively for land surveying, mainly for mineral, oil, and gas exploitation. To produce these artificial tremors, dynamite explosions were used as the primary source of energy. In 1935, Maurice Ewing, the pioneering US marine geophysicist, with colleagues, started a new era in earth exploration of the subsurface by conducting TNT explosions in marine settings (Ewing and Press, 1955). This technique, initially used to image the thickness of ocean sediments, revealed a three-layer structure of the oceanic crust and quickly became the dominant tool in exploring the seafloor subsurface. It has been evolving ever since, with dangerous dynamite being replaced by air bubbles. Theoretical calculations showed that although the mean pressure produced by air bubbles is ∼ 8 % of that of the signal produced by dynamite, for most of the surveys the former signal is more coherent (Staples et al., 1999). In addition, it is less dangerous for the source operation team aboard the vessel and less harmful for the ocean fauna.
As the controlled-source surveys are conducted offshore, aboard research vessels, the method has remained obscure and unknown outside of geophysical circles. To shed light and introduce this technique to new generations, we designed a model that depicts marine, controlled-source seismic data collection. Moreover, with this model, we aim to showcase the interdisciplinary context of the field, encompassing electrical and mechanical engineering, robotics, mathematics, physics, and, in recent years, artificial intelligence, while also highlighting its adventurous side of joining sea-going expeditions, open to everyone. We want to mention that for designing the model we obtained an EGU Public Engagement Grant in 2022.
Communicating science to and engaging with the public are essential for establishing the link between science and society, making the research process more transparent and trustworthy, and the results more impactful and relatable to the public (e.g., Boon et al., 2022; Stilgoe et al., 2014; Thomas and Durand, 1987). However, it is not always clear what the best practices are for implementing this, i.e., what distinguishes high- from low-quality engagement/communication, with the latter carrying the risk of provoking a counter-effect (Jensen and Holliman, 2015; Reincke et al., 2020). Typically, the success of an outreach session would be only qualitatively expressed through an instantaneous reaction (aka “wow effect”), informal feedback (verbal or nonverbal) from the audience right after the event, and/or a personal feeling. Rarely are outreach events designed to include quantitative evaluation. One of the most complete guidelines for evaluating outreach activities is offered by IMPACTLAB (Land-Zastra et al., 2023), which outlines ten different approaches. Here, we adopt the entry/exit quizzes, a subgroup of the “Surveys Method”. According to the guide, this strategy is recommended for assessing “detailed quantitative measure of acquired knowledge and understanding” by the audience.
2.1 How does controlled-source seismic work at sea?
Researchers typically employ two primary types of controlled-seismic experiments: multichannel seismic (MCS) and wide-angle reflection-refraction (WAR) seismic (Fig. 2). The primary difference lies in the type of receiver used to record the seismic waves. Whilst the former uses a > 3–15 km long cable (i.e., streamer) with densely populated recorders (a few to tens of meters spacing) towed behind the ship at ∼ 10 m below the sea surface, the latter uses ocean bottom seismometers (OBS) that are deployed on the seafloor at a few to tens of kilometers spacing. Typically, we would use MCS surveys to obtain high-resolution images (metric scales) of the subseafloor within a localized survey area. In contrast, WAR seismic would be used for more regional scanning of the subsurface at a somewhat lower resolution, ranging from several tens to hundreds of meters. The model we designed depicts the WAR seismic survey on which we will focus in the following sections.
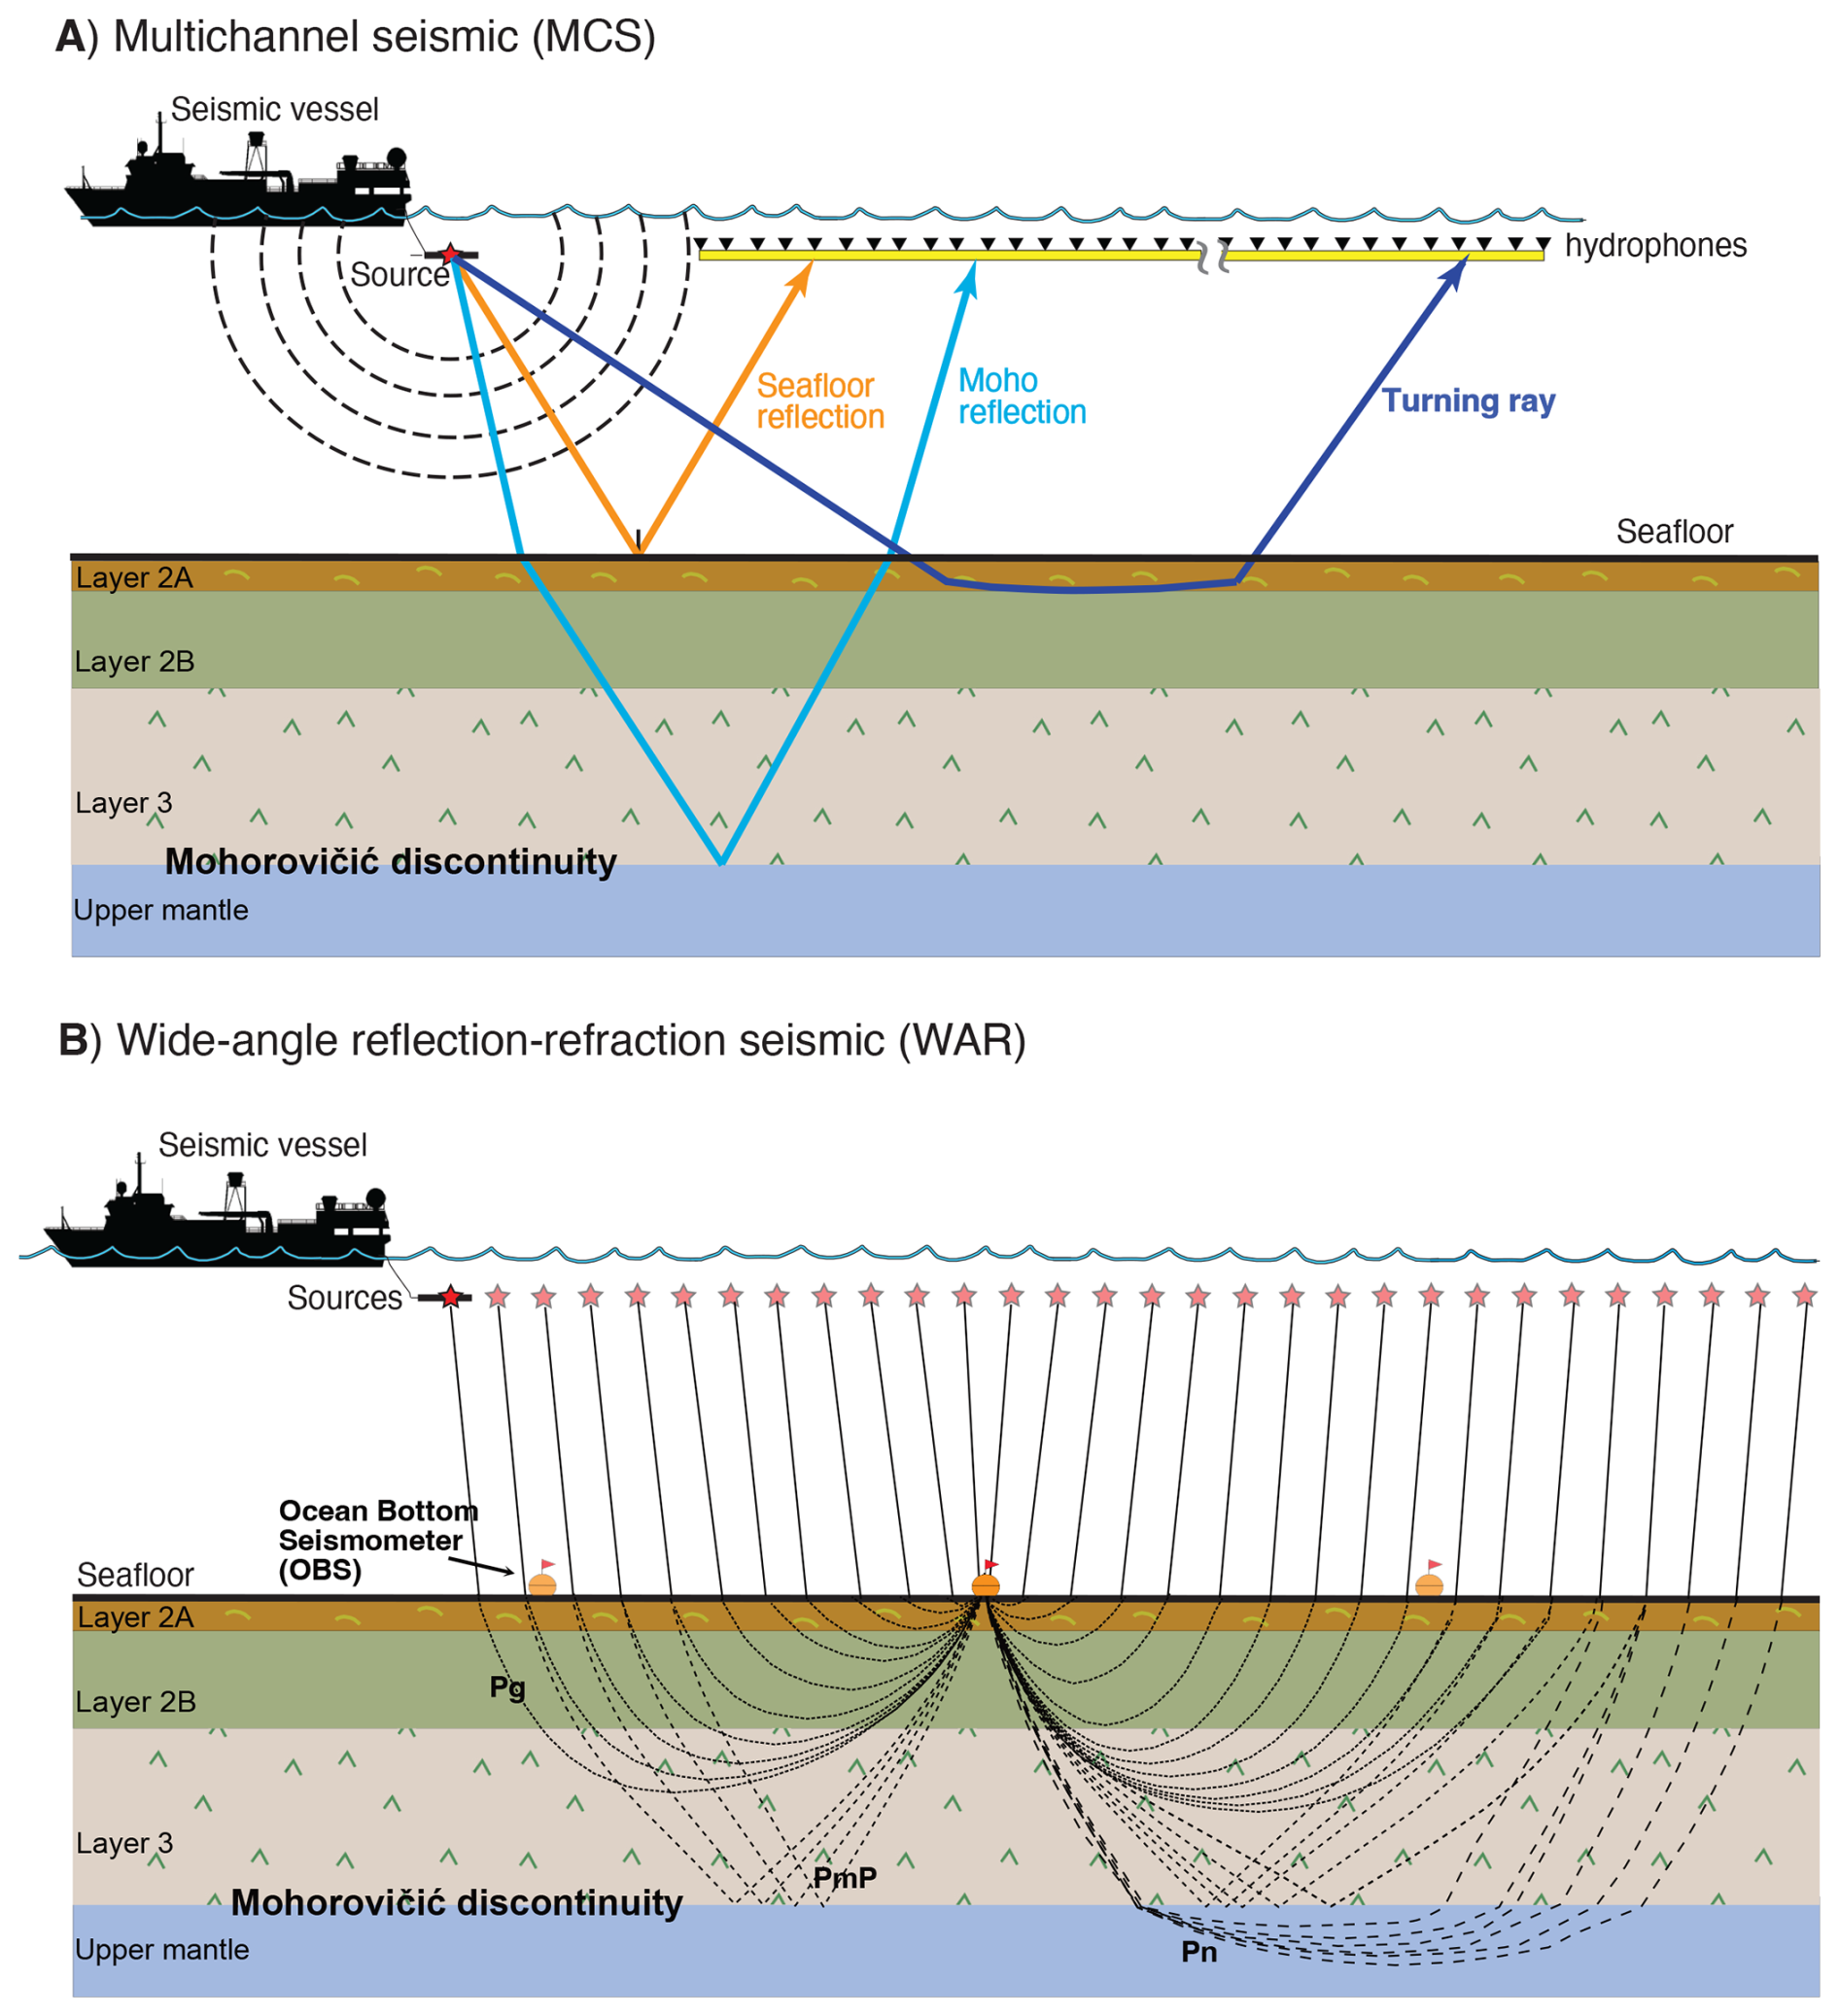
Figure 2Illustration of (A) Multichannel seismic (MCS) and (B) Wide-angle reflection-refraction seismic techniques.
2.1.1 Ocean Bottom Seismometers (OBS)
The Ocean Bottom Seismometers (sometimes referred to Ocean Bottom Seismographs) or OBS for short exist in different forms and shapes depending on the laboratory in which they were designed. In this experiment we use the model of an OBS known as CUBI for Compact Underwater Bottom Instrument (Fig. 3). We need to mention that this model is preferentially used for recording the earthquakes, but we decided to use it here as it is the model that was developed and constructed at Institut de Physique de Globe de Paris – IPGP (where all the members of our team worked at the time of the model build up). The real dimensions of the instrument are cm3; its dry weight is about 35 kg without the weight (which adds ∼ 15 kg). In the water without weight, it has negative buoyancy (−3 kg), which is obtained using well designed floating components (Fig. 3C). The maximum water depth at which this instrument can be deployed is 6 km below sea surface and its autonomy is guaranteed for four months using batteries that are cased in a glass sphere, which isolates the electronic components from contact with water and high pressures. The CUBI contains 2 sensors: a hydrophone (pressure sensor), and three-component sensor that measures vertical and horizontal displacements.
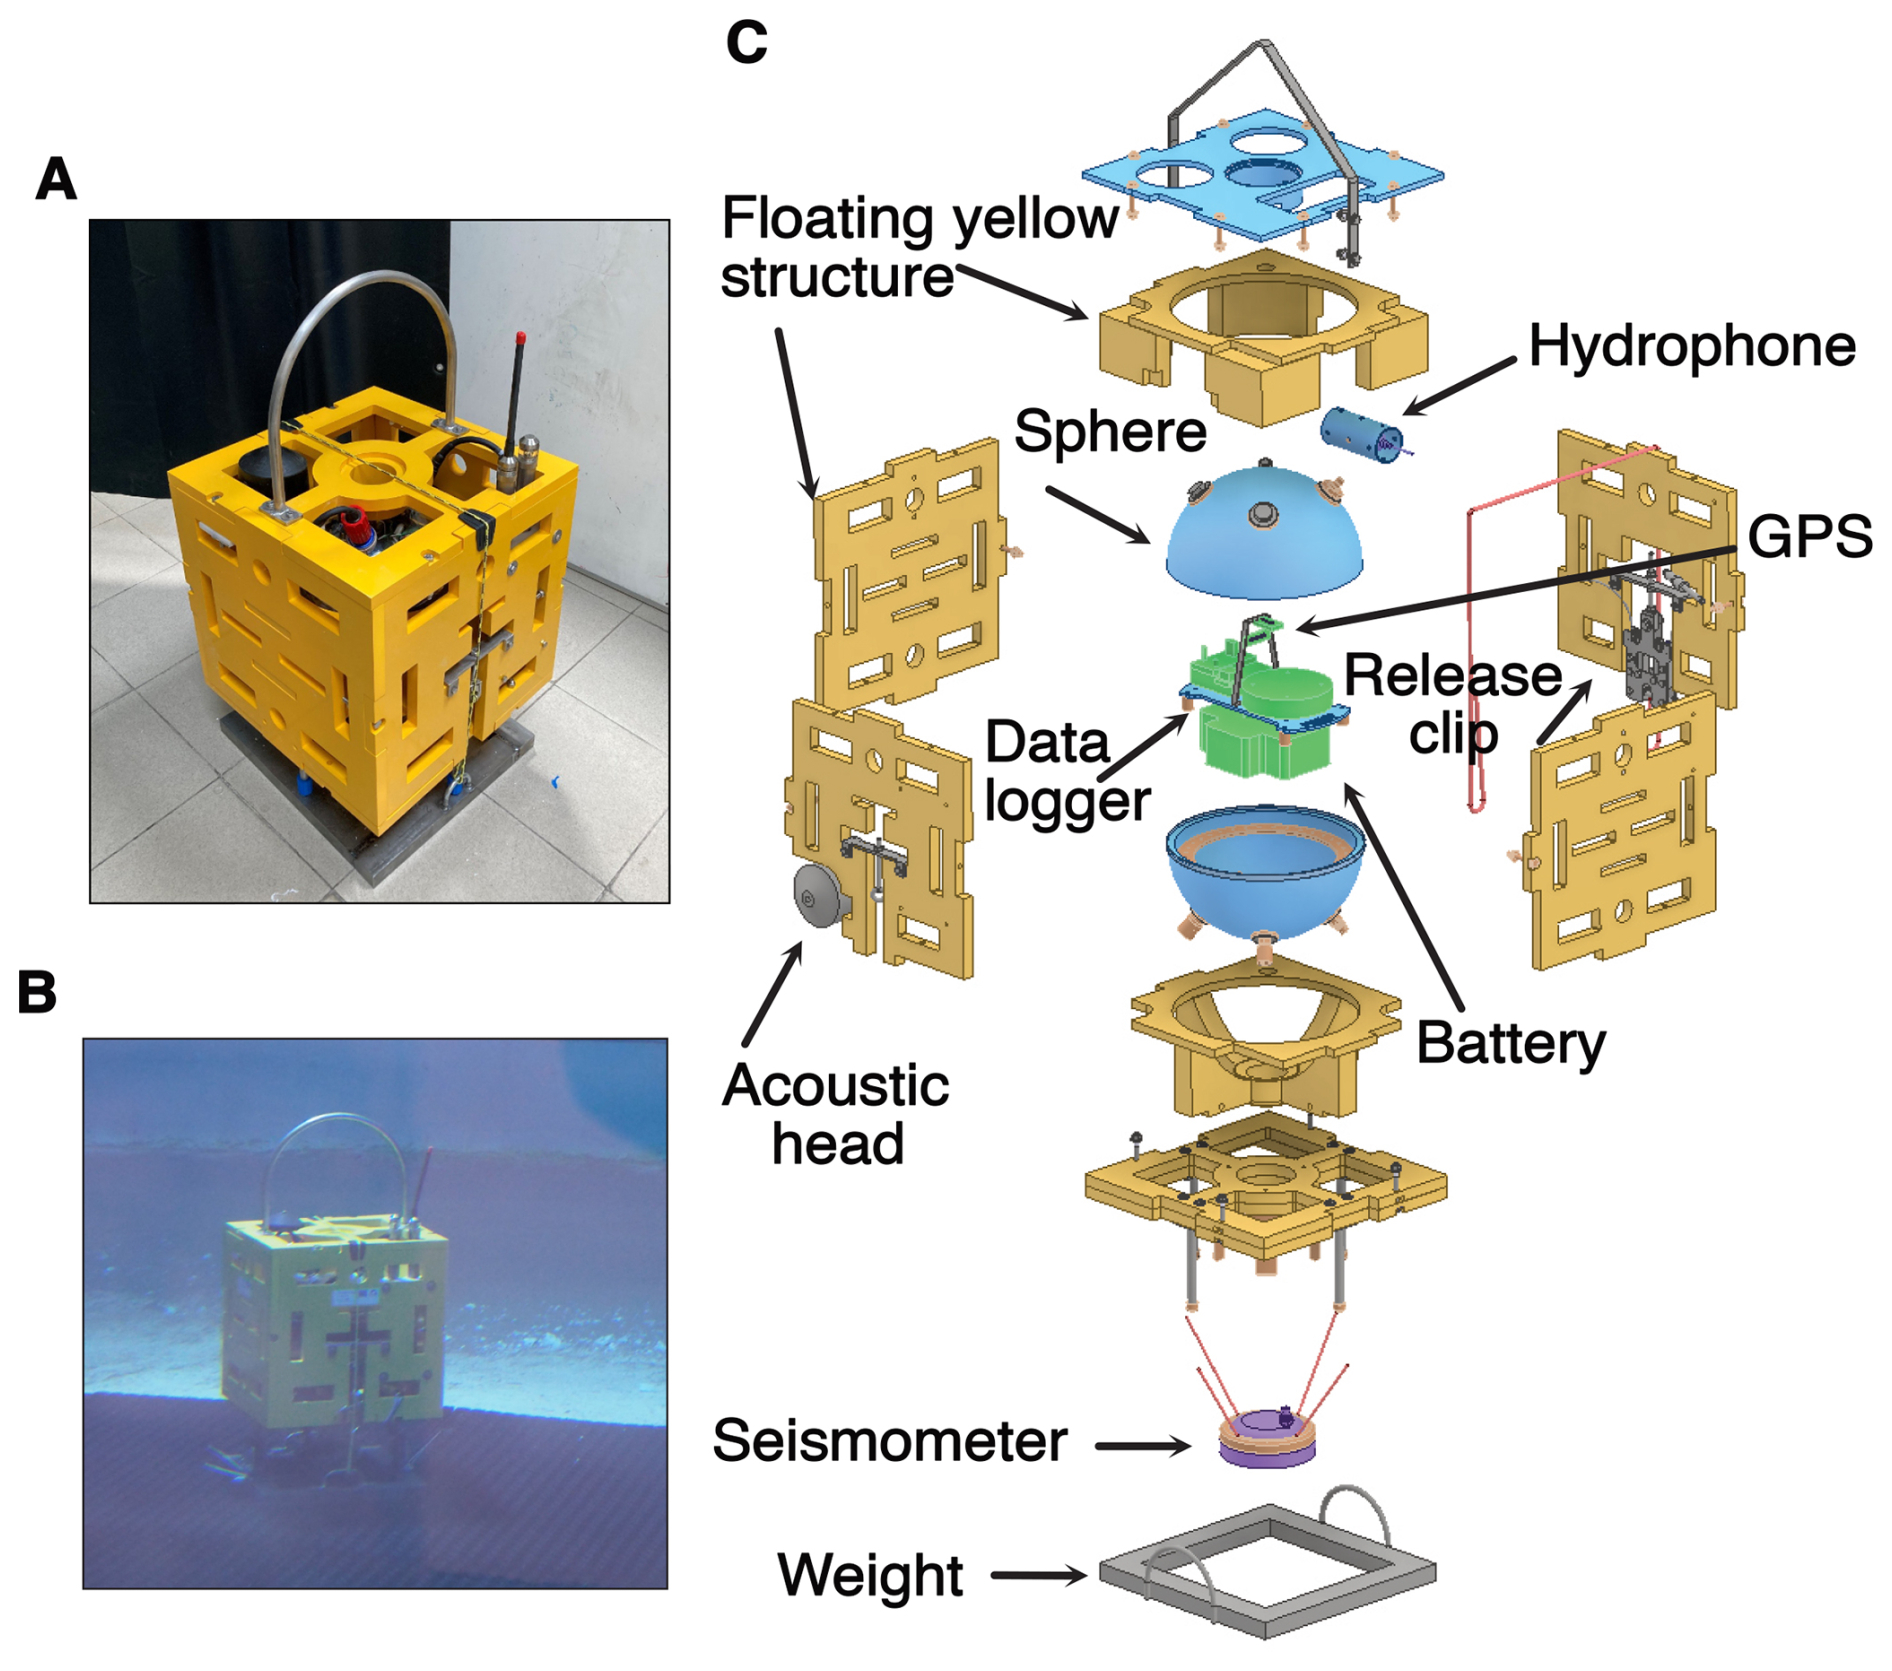
Figure 3CUBI (A) in the lab, (B) under the water and (C) schematic representation of the instrument's main elements.
2.1.2 Seismic source
To produce a quake at sea, instead of dynamite, nowadays, we use compressed air, which is pumped into airguns i.e., stainless-steel cylinders with chambers of different volumes (Fig. 4A–C) organized in several arrays. The total volume of the source can vary depending on the objective of the survey; typically, new generations of sources used in WAR seismic are ∼ 5000 in3 (or 82 L). The position of each airgun within the array, as well as its volume is carefully designed to provide signals, which when superimposed result in the sharpest possible signal that propagates through the water and subsurface. An example of the compressed air released from gun-array under the water is shown in Fig. 4D.
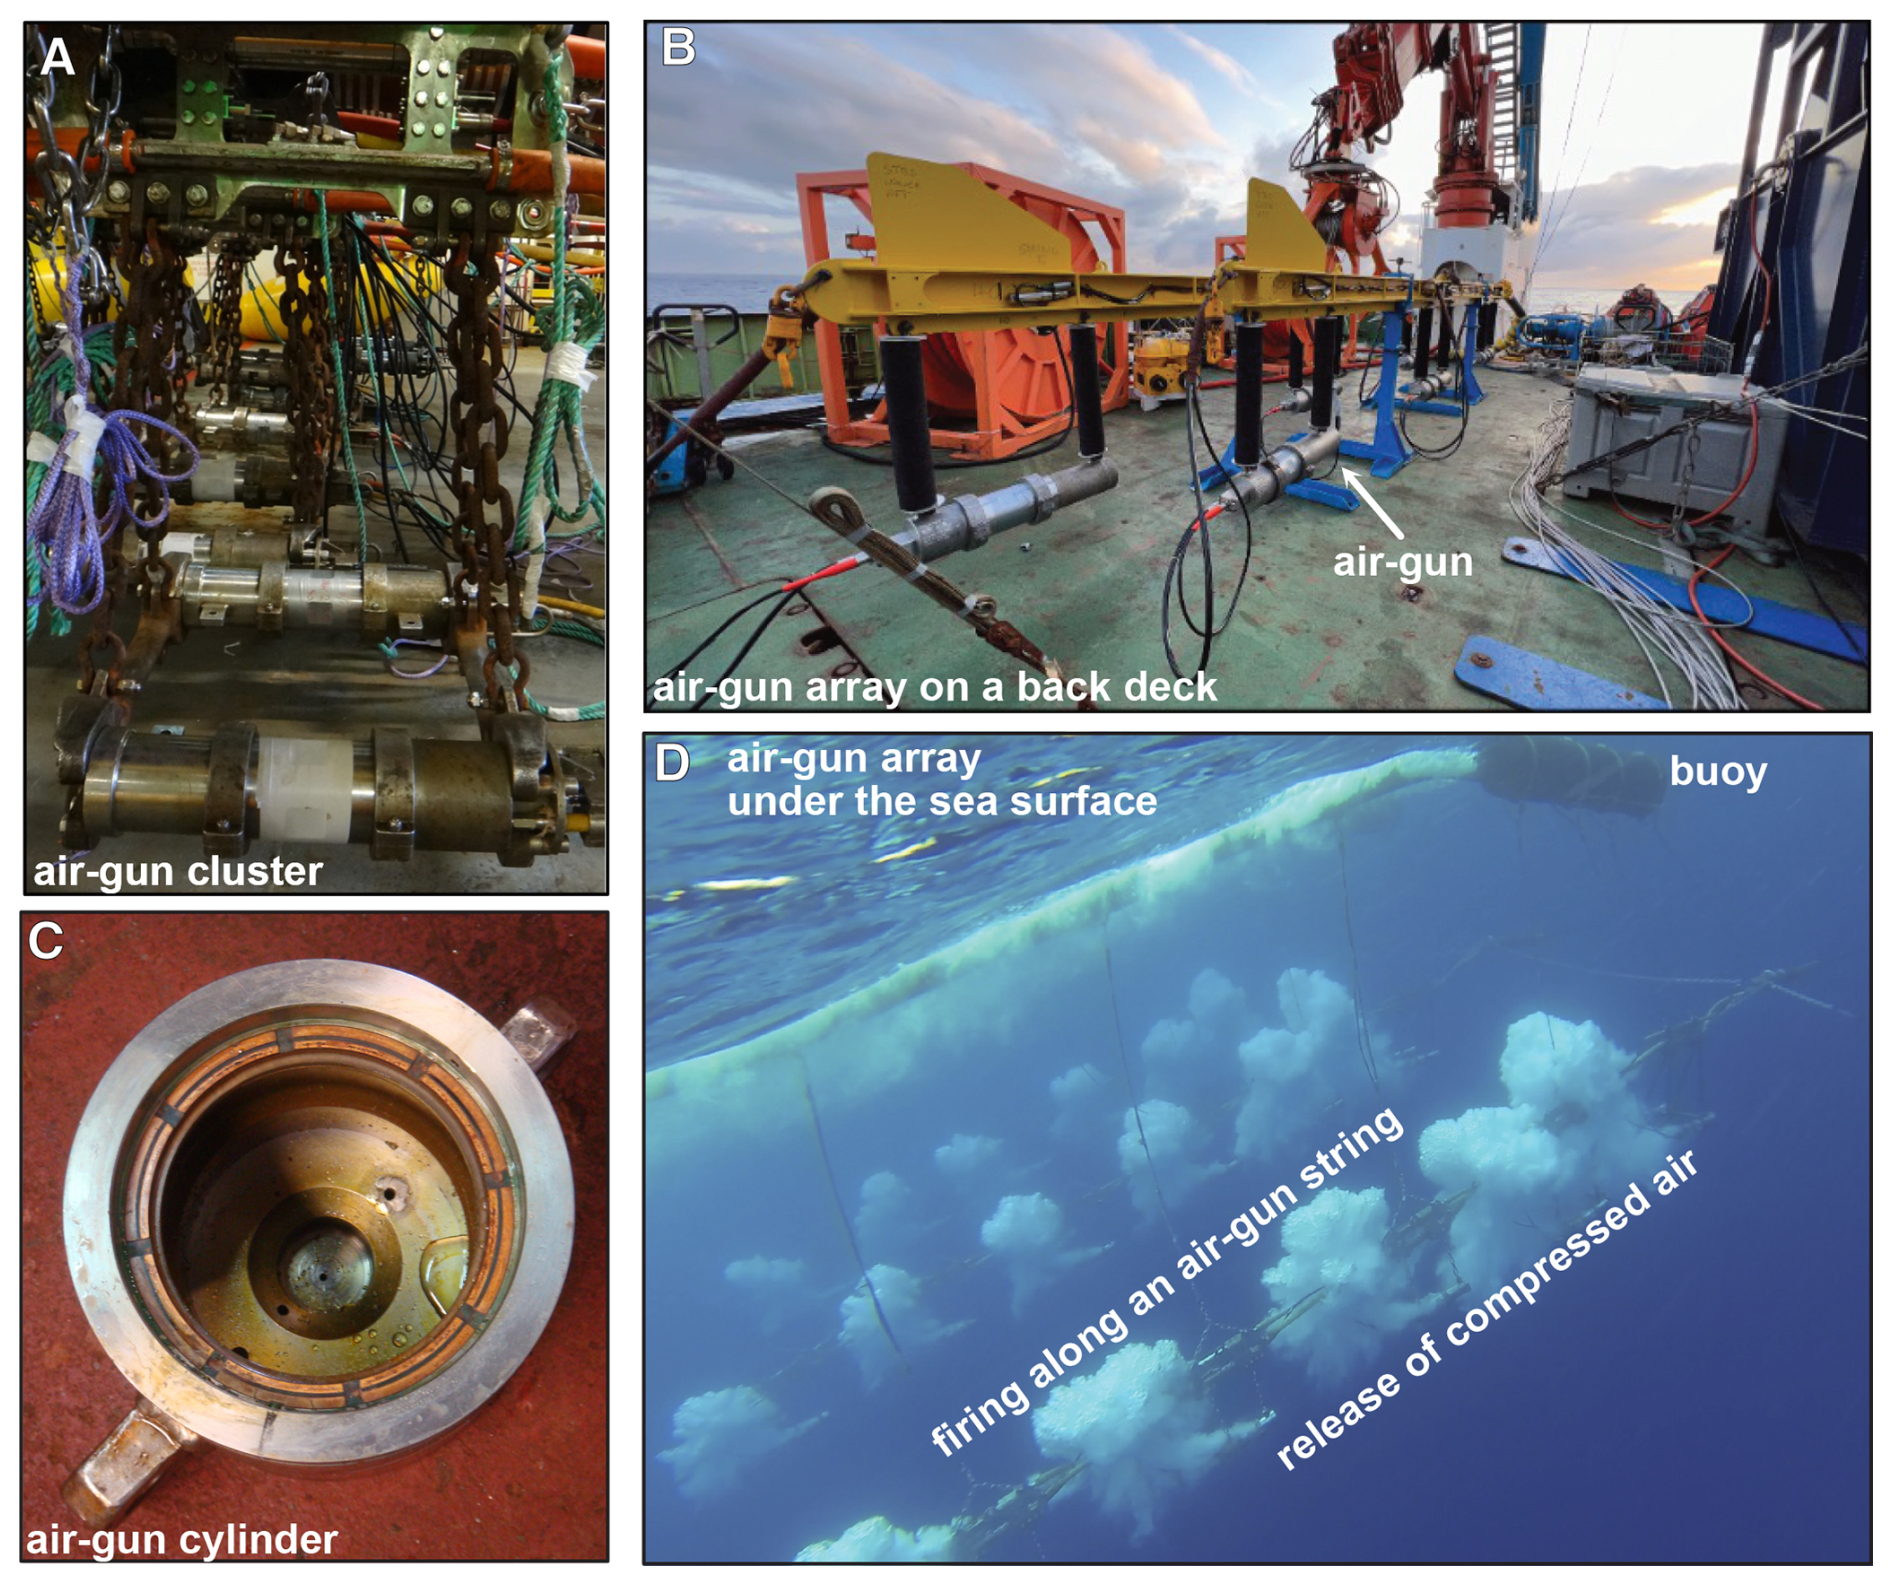
Figure 4Examples of (A) airgun cluster (aboard M/V Western Trident in 2015), (B) Air-gun array (aboard RRS James Cook in 2022) and (C) air-gun cylinder in the laboratory (aboard R/V Marcus G. Langseth in 2012). In panel (D) we show a snapshot of airgun firing under the water.
2.2 Building the model
As in all recipes, we first provide the main ingredients that constitute our model followed by detailed description of the role of each element and how the experiment is conducted. The schematic of the conceptual model and the final model are presented in Figs. 5 and 6.
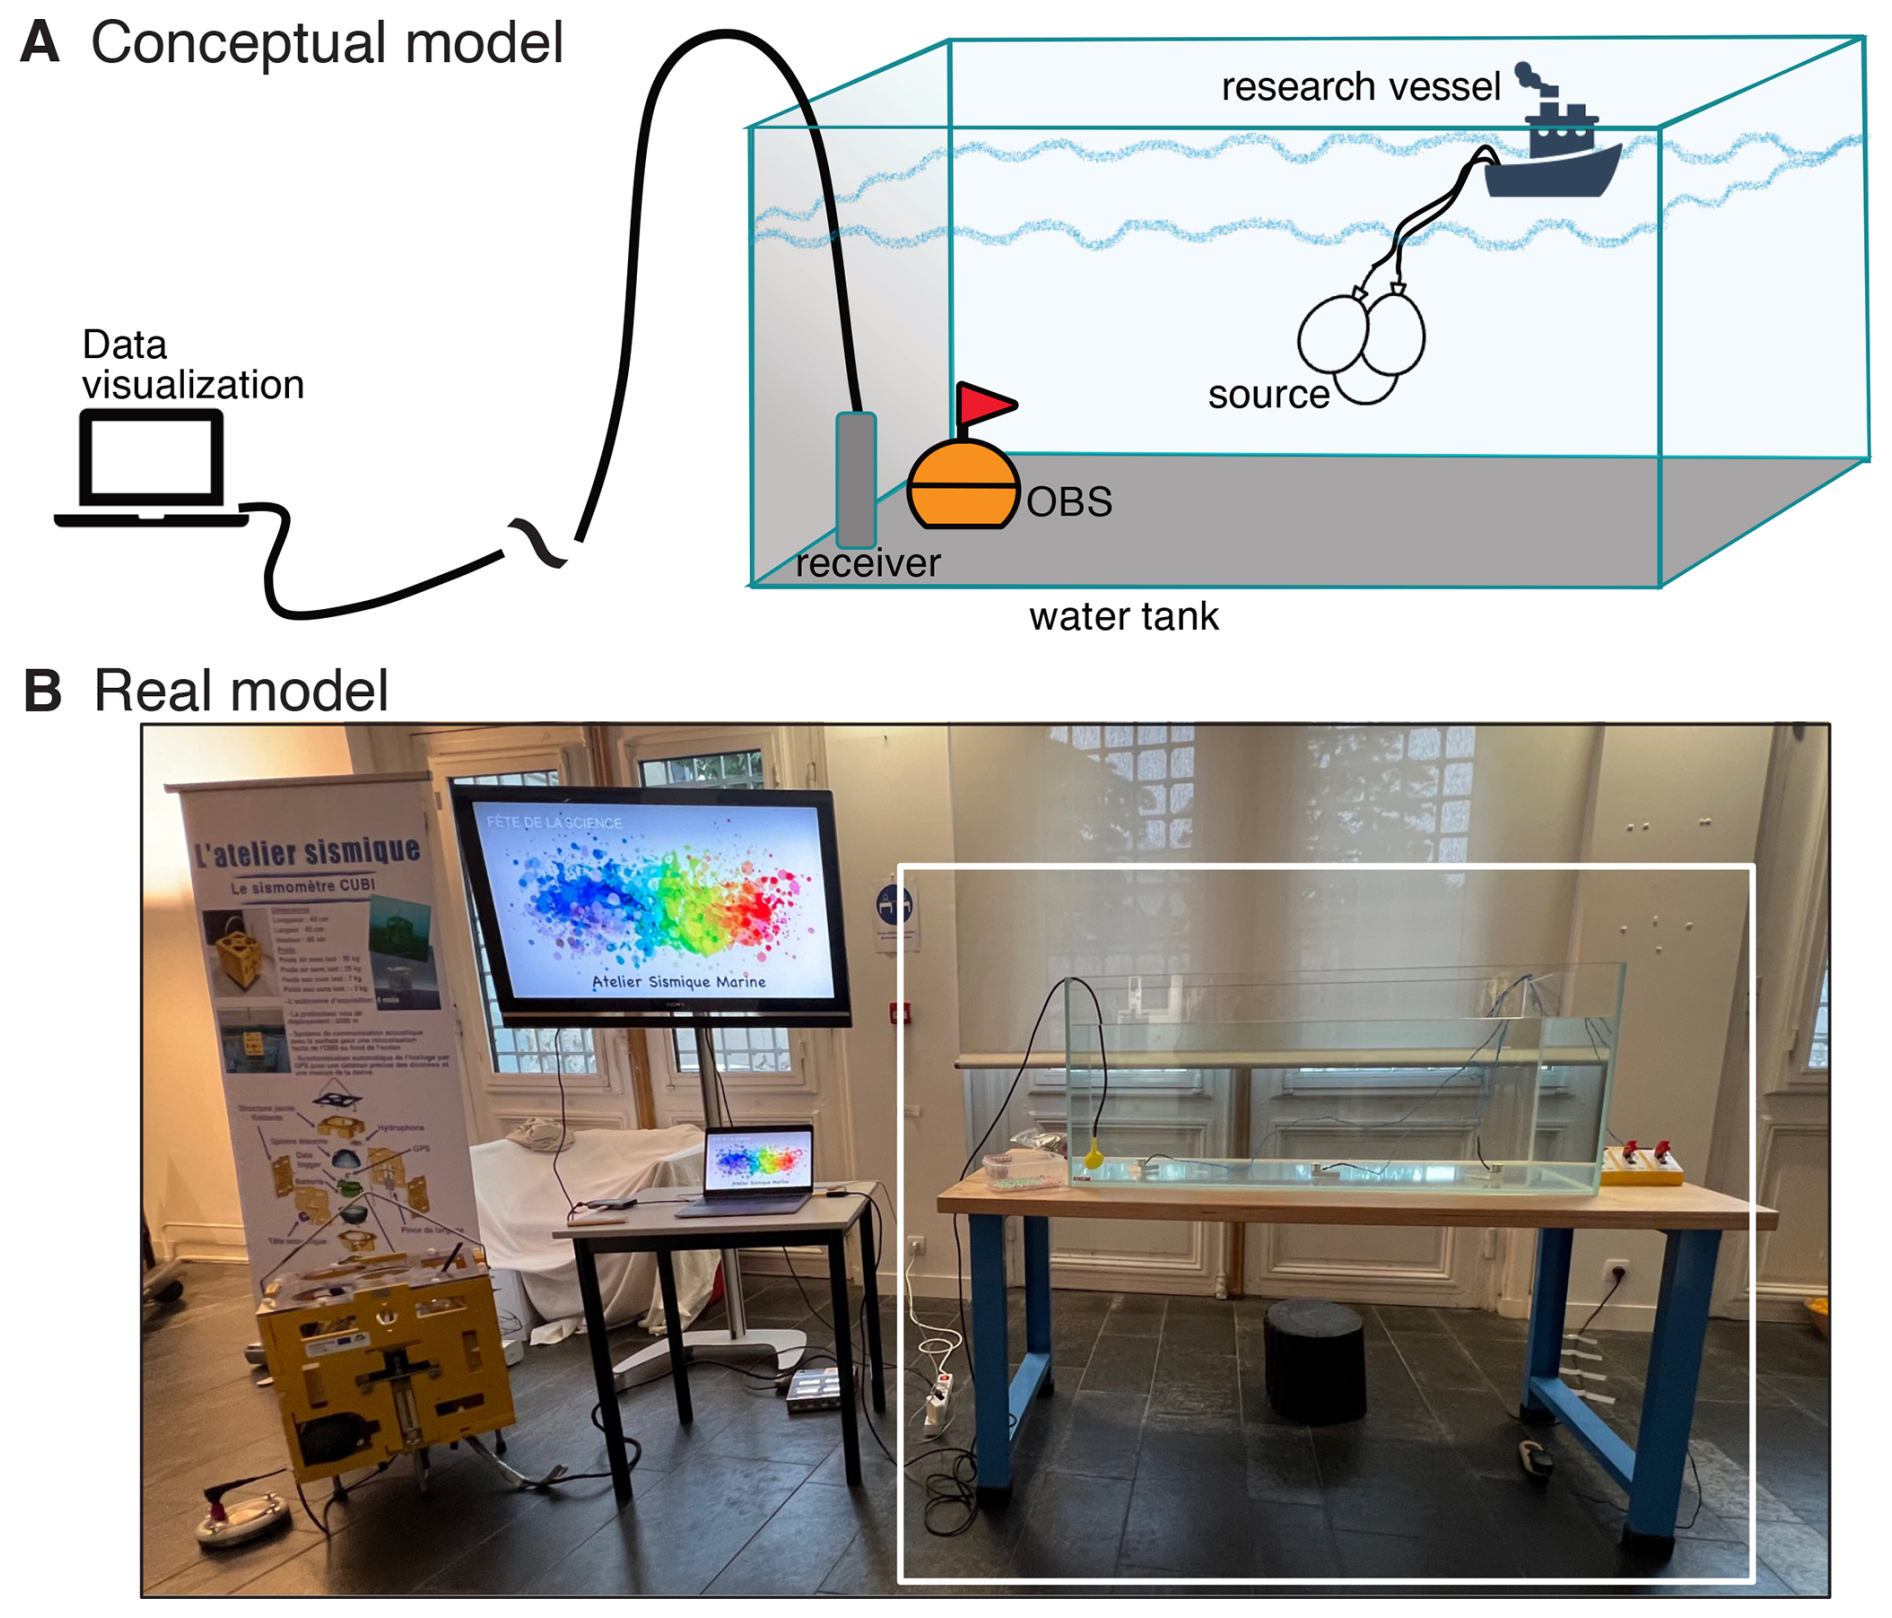
Figure 5Schematic (A) and real (B) representation of the experiment. The white box in panel (B) marks the part of the experiment explained in detail in Fig. 6.
The main elements of the model:
-
300 L water tank
-
floating ship from LEGO CITY collection
-
3-D printed CUBI models
-
electromagnetic box with 3 electromagnets and 3-D printed control box
-
balloons
-
pins for perforating balloons
-
hydrophone
-
laptop
-
software for displaying the recorded signal
-
large TV screen
-
whale model (from the same LEGO City set as the ship)
-
remotely controlled submarine toy
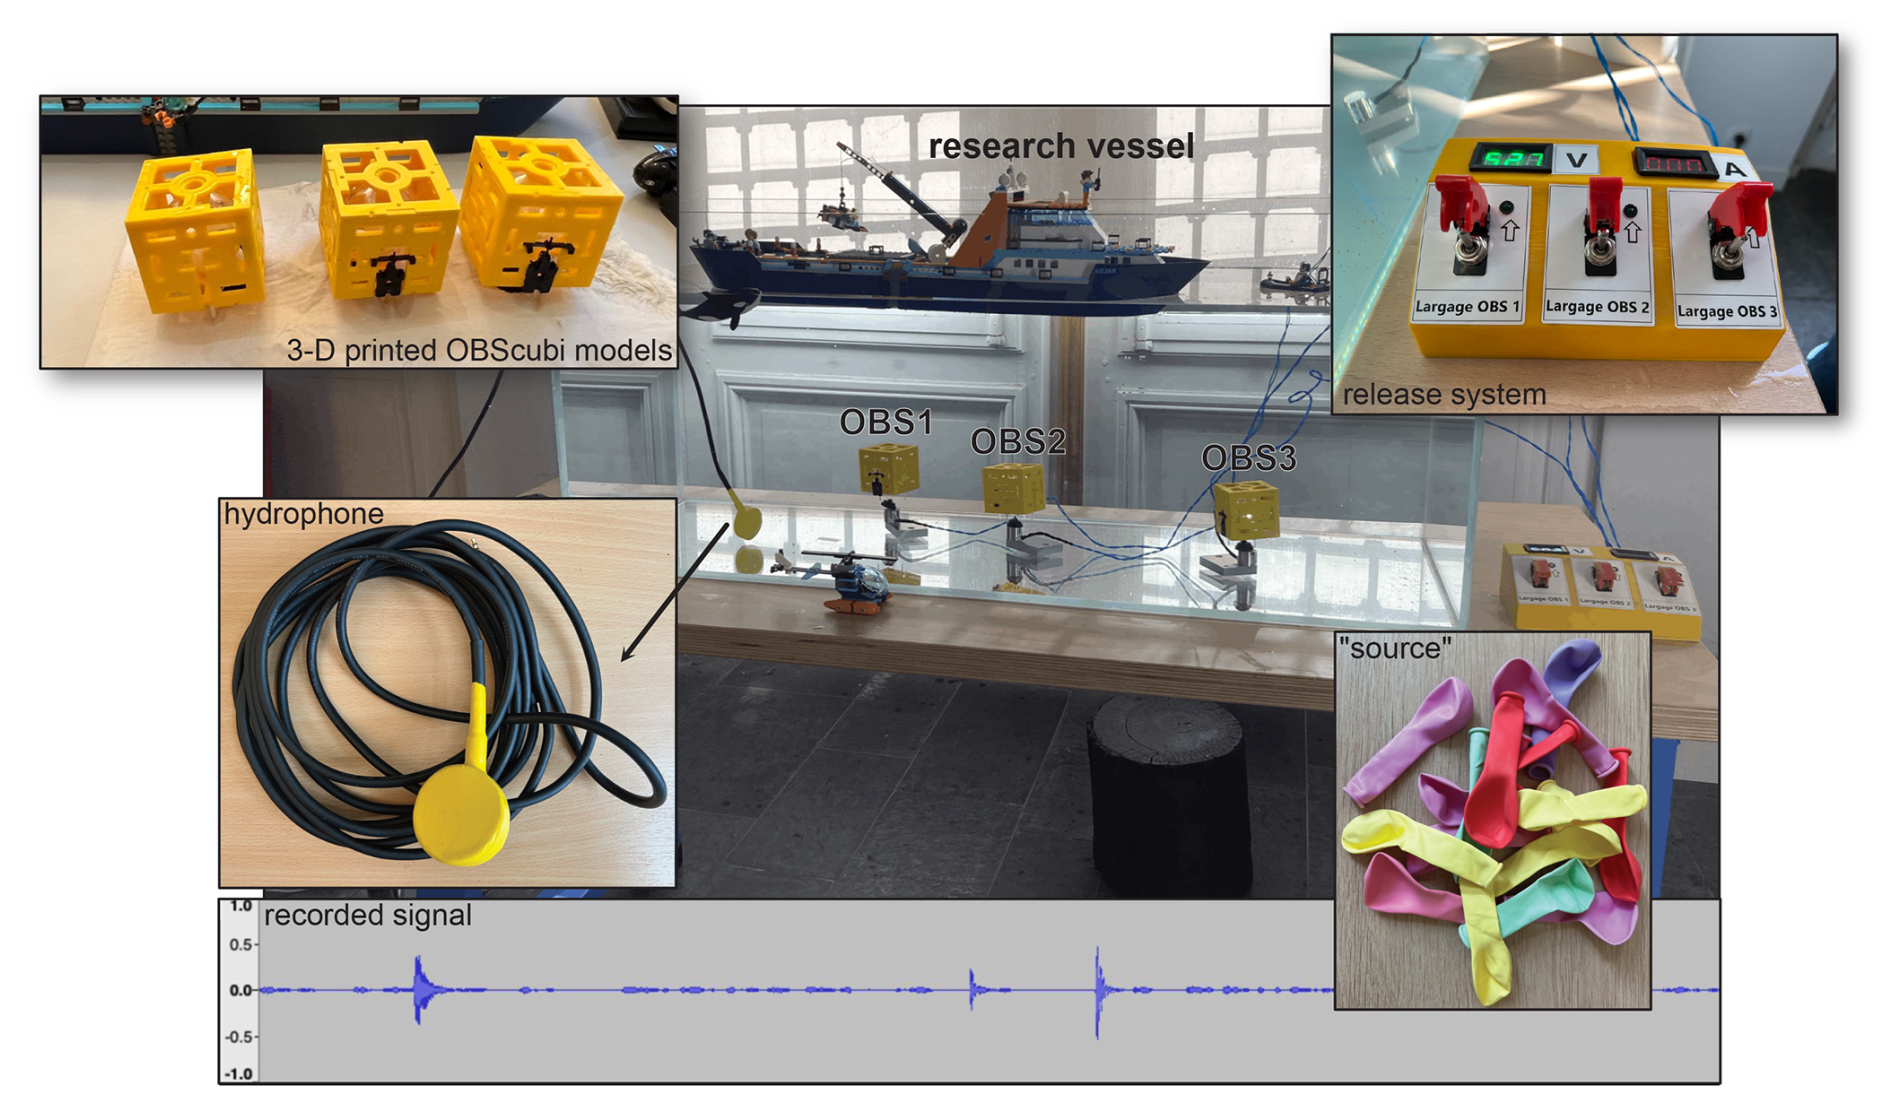
For presenting the main principles of a WAR seismic survey, two components are essential: the simulation of the source and its recording (Fig. 6). To effectively mimic the explosion of compressed air under the ocean surface (as described in Sect. 2.1.2), we use a small balloon; an inflated balloon is submerged into a large water tank and perforated to release an air bubble that propagates through the water. Thus, the released signal, splashing the water within and often around the tank (which is usually followed by the awe of the experiment participants), is then recorded on a hydrophone. For this purpose, we used a water-proof piezoelectric microphone, which detects different types of vibrations. The hydrophone is connected to a laptop with software that displays the vibrations – we used either Audacity (an open-source digital audio editor) or a MATLAB function. We must emphasize that with this model setup, we do not intend to record a real seismic signal that can be further analyzed; instead, we want to demonstrate the central concept.
To depict all phases of seismic data collection and make the model more engaging, we add a research vessel, here it is a floating ship model from the LEGO City collection (Fig. 6). In addition, we include three 3-D printed models of CUBI (scale 1:7) and an in-house developed device. At sea the OBSs are deployed from the surface and sunk to the seafloor thanks to an attached weight (Fig. 3C). After a period of seismic data recording, they are recovered by sending an acoustic command that triggers the release of the weight. Freed from the weight, each OBS rises back to the surface due to its built-in buoyancy. To simulate this mechanism in the experiment, we designed simplified OBS models. Each model consists of a 3D-printed frame holding a sealed plastic ball filled with air, providing buoyancy. Beneath the frame, a 3D-printed dummy sensor is attached, weighted with an encased metal nut.
At the bottom of the tank, three electromagnets are installed, with their power cables routed outside the tank to a control box. The control box is straightforward, consisting of three ON/OFF switches that independently power each electromagnet. At the beginning of the experiment, the magnets are switched ON. The three OBS models are then lowered by hand, one by one, until the nut contacts the magnet, effectively “anchoring” them to the seafloor. To recover the OBS, the procedure simply involves switching OFF the electromagnetic current. Once released, each OBS floats back to the surface autonomously, mimicking the real-world recovery process.
There are many examples of playful ways that our colleagues worldwide have designed to showcase research in Geology, primarily targeting younger audiences, to present the field as a potential career path. For instance, every Fall, the Lamont-Doherty Earth Observatory from Columbia Climate School in the USA opens its doors to engage with the public through a wide range of ateliers, including exposition of deep-sea cores, trying on immersing survival suits, and the creation of volcanic eruptions through reaction of liquid nitrogen and water (link from the 2024 program is available at https://openhouse.ldeo.columbia.edu/content/exhibits, last access: 6 January 2026). Most of these ateliers are focused on a specific object (e.g., rock sample) or replicating specific natural process. In France, the beginning of October is reserved for the Fête de la Science (FDS), an outreach event held nationwide. Traditionally, at our home institute (IPGP), this event is held every other year, with colleagues presenting inventive experiments and materials collected during expeditions across seven continents and five oceans. Some of the topics include talks on lost meteorites, the observation of the oldest ecosystems under the microscope, and a 360° view of Titan and Mars, to name a few (link to the latest FDS edition at IPGP can be followed at https://www.ipgp.fr/actus-et-agenda/actualites/fete-de-la-science-2024-a-lipgp/, last access: 6 January 2026).
In Marine Geosciences, we typically use visual aids to depict the work we conduct at sea, which are ideal for presenting the processes and research activities we perform in the water column. For example, the videos recorded using submarine vehicles to collect rock samples are very effective in depicting the activity. However, visual materials fall short when it comes to explaining indirect marine techniques, such as controlled-source seismic (Sect. 2.1); seismic data collection requires propagation of waves in the water column and subsurface, which are not visible in videos, which poses a challenge when doing science communication.
Therefore, in addition to the video material and photos we collected at sea, here, we present a novel marine seismic model to bring the data collection offshore closer to the young audience. Our approach is novel not only because we build a playful model, but also because, for the first time, we provide insights into the efficacy of the “learning by doing” approach in explaining complex scientific concepts to primary and secondary school students. In fact, although many different experiments are conducted to promote science, we often lack a clear understanding of how impactful these activities are on students retention of newly acquired facts and actual learning. To the best of our knowledge, no follow-up quantitative evaluation has ever been published in the domain of Marine Geosciences and hence no results are available. With this experiment, we provide an approximate measure of the effect of our outreach activity through entry/exit quizzes, detailed in Sect. 3.1. In addition, by combining the presentation, video material, and hands-on experience in simulating data collection, we aim to highlight the field's interdisciplinary and transdisciplinary aspects. Throughout the experiment, we emphasize the contributions of each discipline involved. For instance, besides the evident role of geophysicists, who typically lead surveys, we also discuss the instruments built by engineers with different backgrounds (electrical, mechanical, and computer engineers), without whom the seagoing experiment would not be possible. Note that our team includes researchers and engineers with different field of expertise and career stages, and competent to answer questions about the aspect of the presented professional paths. Another example is the participation of biologists, which is highlighted by introducing a whale model and explaining the importance of environment protection.
Furthermore, we state that the photographs and video materials we present are often taken and compiled by professionals who sometimes join our adventures. Moreover, we discuss life at sea and mention less evident but critical roles and contribution of professionals: chefs who prepare meals for the crew, doctors on board, technicians, and professional sailors and captains. In addition to depicting wide range of professions involved in marine experiments, highlighting these roles underscores that every successful survey relies on teamwork, aiming to inspire participants to value collaboration.
3.1 Constructing the quizzes
The experiment is accompanied by quizzes tailored to participant's age from 9 to 18. The quizzes are divided into three groups based on the age of the participants: Quiz 1 for 9–12 years, Quiz 2 for 13–15 years and Quiz 3 for the group > 15 years. The complete sets of quizzes in English are provided in the Supplement; as we performed the events in France and Austria, the quizzes were also translated into French and German.
Each quiz group is composed of 5 questions that are either multiple choice or true/false. One example of the quiz question prepared for the age range 9–12 is:
-
A marine geologist can discover clues about the formation of the Earth's crust by studying _________ (more answers are possible). The offered options are:
- (a)
waves,
- (b)
marine animals
- (d)
rocks
- (e)
ocean currents.
Another example of the quiz questions for the age 13–15 years is:
-
What is the temperature of the deep ocean?
with the offered responses:
- (a)
0–3 °C
- (b)
23–25 °C
- (c)
0–10 °C.
The topics covered in the questions are all addressed during the presentation and experiment; therefore, no answer key was provided to participants after they completed the exit quiz. Although great care was taken in constructing the questions, which were adapted to the school program and age, and colleagues and collaborators reviewed the quizzes, it is essential to mention that they did not undergo an official quality control process.
The results of the quizzes are summarized in Sect. 4 and are used exclusively to evaluate the effectiveness of the activity, not the initial knowledge of the participants. As we wanted to keep the quizzes anonymous and also emphasize the importance of working in a team, the results provided the overall performance of a group of students (i.e., they represent group scores).
3.2 Conducting the experiment and quizzes
At the beginning of each session the participants were asked to complete the entry quiz, which typically takes no longer than 5 min. As soon as the quizzes are turned in, we start with the session. As every sea-going research expedition begins long before we board the research vessel, our marine adventure in the lab also starts with the presentation of fundamental concepts behind plate tectonics and its exploration beneath the ocean using seismic waves, with special emphasis on the content covered in the quizzes. The explorers, equipped with the basic knowledge, are then split into four teams: (1) principal investigators (PIs), (2) team in charge of the seismic source, (3) instrument team, and (4) signal imagery team. Typically, we have about 10–12 participants per session. To determine the roles in the experiment, we conduct a small poll so that each participant selects a note with a number that is linked to a specific position in the experiment. The experiment starts with the two PI(s) placing the LEGO ship in the tank filled with water. The next step is to deploy the OBS, which is done by three members of the instrument (OBS) team. Once the instruments are deployed, the source team (up to four members) starts blowing up the balloons that they submerge in the water and then explode using a pin. The released signal is recorded, and the imagery team (up to three members) signals the timing of the shot, observing it on a large screen. To explain the impact of controlled sources on the sea dwellers, we would occasionally interrupt the “shooting” procedure by inserting a whale model from the LEGO City set. Therefore, one of the seismic source team members must be on watch and signal a pause in operation until the whale leaves the survey area (here, the water tank), which is precisely the role of mammal observers when we collect controlled source seismic data at sea. As mentioned in the Introduction section, the harmful effects of seismic activity were significantly reduced by introducing the system of air guns instead of dynamite; however, the hazard to marine life is still present. To reduce it, protocols for obtaining permits for seismic activities in particular areas are put in place, and the presence of a mammal observer team has become indispensable for every controlled-source seismic survey.
The final step of the experiment involves recovering the OBSs that were released by cutting the electromagnetic current. The end of the expedition is announced by the PIs, who drive a small submarine to check that none of the instruments had remained on the seafloor. The whole procedure is recorded and provided in Video supplement. For the events conducted at IPGP, after completing the simulation of a marine seismic experiment, participants had the opportunity to learn more about the CUBI instrument and its main components from the OBS team of engineers. By completing all the proposed modules (introductory lecture, conducting the simulation, and examining the instrument closely), the participants were exposed to different aspects of professions involved in marine seismic. After completing the experiment, the participants were kindly asked to repeat the quiz.
Here we describe the observations and results of the experiment conducted during three events. The first opportunity to present the experiment was during the Fête de la Science (Open House event in France) at the IPGP in early October 2024. The second session was organized with 32 high-school students who were invited to IPGP in December 2024. Finally, the third time, we conducted the experiment at the University of Vienna as part of Planet Earth Day in late April 2025. In Fig. 7, we show the scores of the quizzes for all the tested groups.
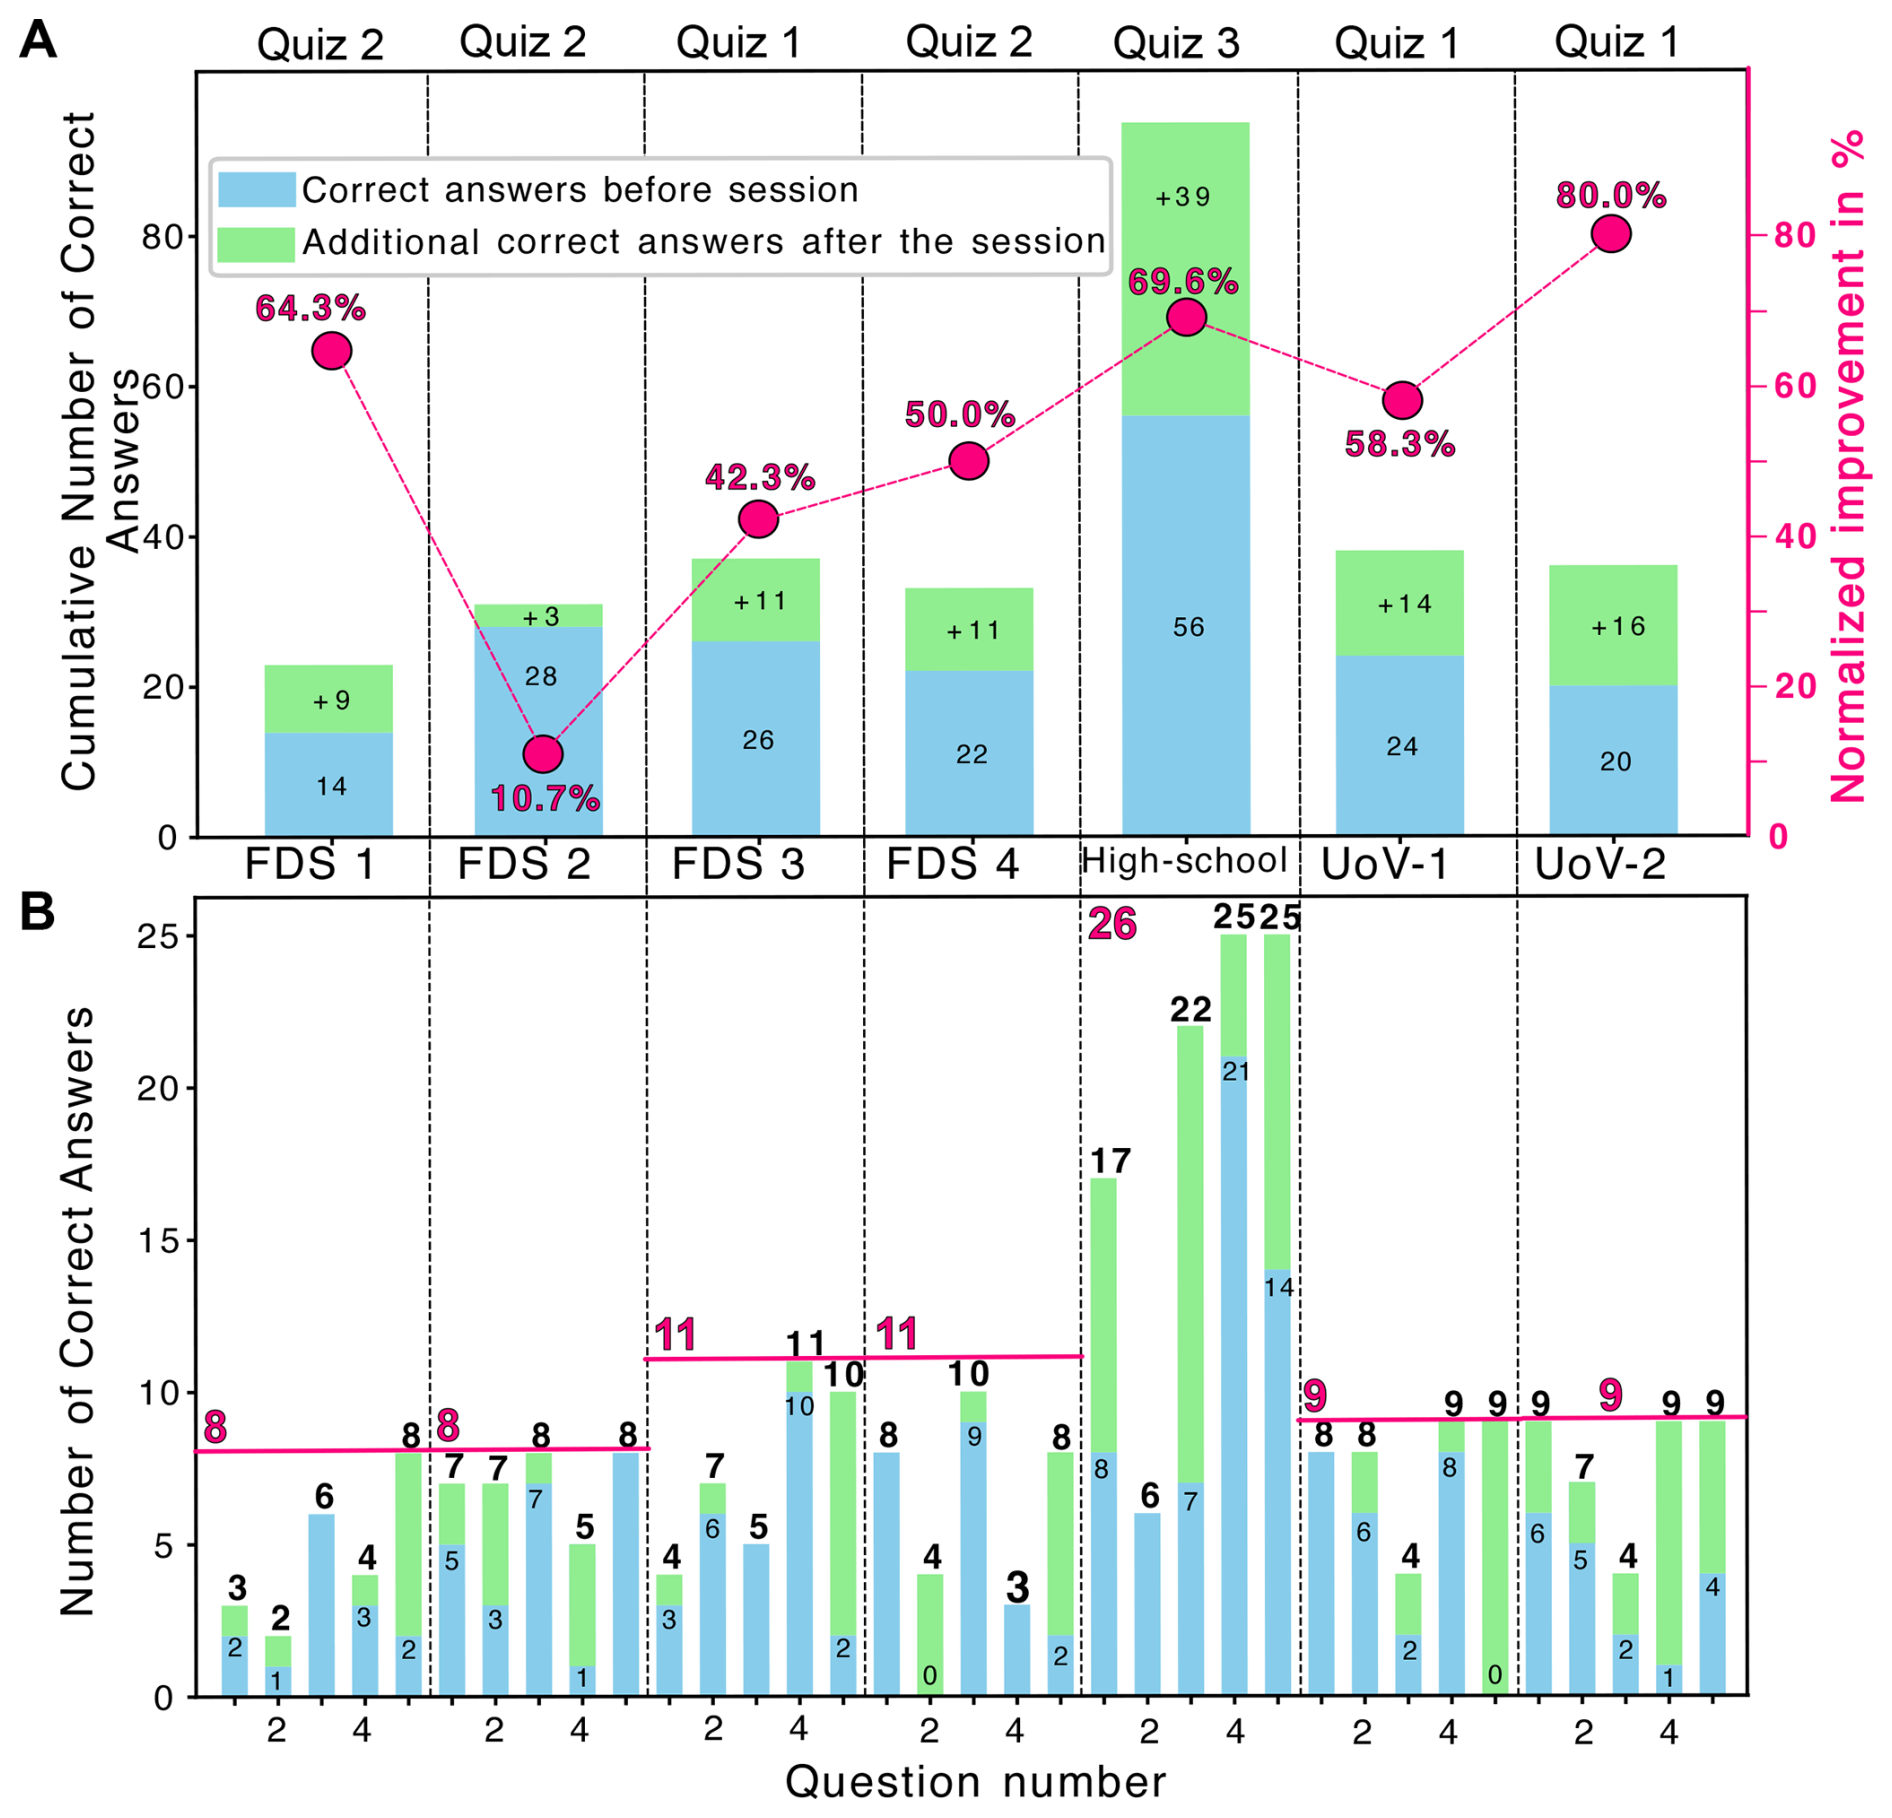
Figure 7Analyses of the quiz results: the number of correctly answered questions before (blue) and the improvement after (green) the session. (A) Cumulative result of correctly answered questions before and after the atelier for each group with the observed improvement expressed in percent with respect to the total number of participants for each individual group, indicated by circles and numbers in magenta; (B) results for each question within the particular group. The FDS 1–4 represent the results from the group of pupils who attended Fête de la Science (FDS) at IPGP; the “High-school” group represents the results of all high-school participants, and the UoV 1–2 shows the results from the event conducted at the University of Vienna. The bold number at the top indicates the total number of correctly answered questions after the session. The total number of participants is indicated by solid line and number in magenta. The specific group of the quiz (provided in the Supplement) taken by the participants is indicated on the top of panel (A).
Here, we would like to mention the observation that was common for all three experiments. Namely, for the pins used to perforate balloons we intentionally selected two colors of the pin heads, pink and pastel blue. An interesting tendency was that while female participants did not seem to pay much attention to the pin color, male participants were dominantly selecting the pastel blue ones. This observation matches the results of a study conducted by Jonauskaite et al. (2019), which shows that boys predominantly chose blue as their favorite color, which also seems to be liked by girls. In the following sections we describe each of the events and provide the results of the conducted quizzes.
4.1 Fête de la Science (FDS) at the Institut de Physique du Globe the Paris (IPGP)
The FDS 2024 event was named “Océan de savoirs” (Ocean of Knowledge), and therefore, it was the ideal time for the inauguration of our model. Typically, the IPGP communication team organizes visits for primary school students from several schools across the Paris area over two working days (Thursday and Friday); the event is also open to the public on the weekend. Here, we focus on the experience of working with school groups, as the experiment was conducted in its entirety (Sect. 3.2), including quizzes, which are challenging to conduct with the public.
Over those two days, our atelier was attended by four groups of primary school students. Quiz 2 was distributed to FDS 1 and 2, which both had 8 participants, and to FDS 4 with 11 participants. The youngest group, FDS 3, had 11 participants and was given Quiz 1. The analyses of the quizzes clearly show that for the three groups (FDS 1, 3, and 4), the overall number of correct answers increased by about 50 % after the experiment (Fig. 7A), demonstrating the positive impact of the activity. The improvement of the FDS 2 group was much lower (only ∼ 10 %), which at first may seem surprising. However, if we consider that this group initially provided the overall highest score before the experiment (28 correct answers out of 36 questions total), there was much smaller room for improvement, i.e., if the group answered all questions correctly their improvement would have been less than 25 %. Upon examining the analyses of each question, it is noteworthy that some questions proved more challenging than others. For instance, for Quiz 2 (Supplement), question 4 regarding seismic waves was correctly answered by only ∼ 50 % of participants even after the session. This suggests that, despite being covered in elementary physics and explained during the experiment, the concept of wave propagation is not fully grasped by most students who participated. To address this gap in understanding, we consider including simplified simulations of the wave propagation during the introduction session. However, we need to mention that the duration of our experiment is relatively short (30–45 min per session), which does not allow to go in greater detail in explaining complex concepts. Another interesting observation from the same age groups comes from the analyses of the question regarding the temperature of the deep ocean (Quiz 2, question 5). About 75 % of the participants from FDS 1 and FDS 4 provided an incorrect answer before the atelier; however, after the atelier, the situation was reversed, and 90 %–100 % of the participants gave the correct answer. The complete analysis of the quiz outcome, broken down to each question, is provided in Fig. 7B.
4.2 Experience with high-school students at IPGP
This event was organized in collaboration with two physics professors from a high school located on the outskirts of Paris. In early December, 26 high school students participated in the activity, which included all the modules described in Sect. 3.2, followed by a specifically designed quiz aligned with their physics class curriculum, as confirmed by their professors (Supplement – quiz for ages > 15). Thirty-two students attended the entire session, but six of them declined to take the quiz. To make the experiment efficient, the students were split into three groups, each with 10 students. As they came from the same school, followed the same curriculum in physics, and spanned the same age, we opted to present their results as a single group. Overall, we see an important improvement (∼ 70 %) in providing correct answers following the experiment.
The main struggle was the second question regarding the types of seismic waves (see Quiz 3), which only 6 participants answered correctly. No improvement was seen after the experiment (Fig. 7B). Based on the limited interaction with the students (we do not know the specifics of their background and concepts covered in the classroom) and the fact that this particular set of quiz questions was conducted only once does not allow us to provide further insights regarding the possible reasons; we can only speculate that the concept is not covered by elementary physics thought in school and for the most of the students it was the first time they heard about it. Following this experience, the challenge for us in the future will be to work more closely with high-school professors and dedicate time during the atelier to explain the less-known concepts. In contrast, questions 4 and 5, which their professors identified as challenging, after the atelier were answered correctly by almost all participants (25 out of 26).
4.3 Planet Earth Day at the University of Vienna
Through close collaboration between the University of Vienna (UV) and the European Geosciences Union (EGU), we were invited to participate in the Planet Earth Day at the UV with our experiment, with some modifications. The introductory presentation was conducted in German, led by two master's students from the UV, and the quizzes were translated into German. Due to logistical issues, the water tank was reduced to 150 L, which also required the use of a smaller ship model. It is also important to mention that the event was open to the public, requiring registration, with four proposed sessions adapted to specific age ranges. The results of the quizzes are only available for the two groups, UoV 1 and UoV 2, who completed the Quiz 1 set. Unfortunately, the entry and exit quizzes from the other two groups were mixed up, and therefore, it was not possible to analyze them.
The results from the two groups show a significant improvement of ∼ 60 %–80 % after experimentation. However, it is worth noting that most of the participants were accompanied by a parent/guardian, which may have influenced the results.
Comparing the responses to individual questions from the FDS 3 participants at the Fête de la Science event with the answers from UoV 1 and 2 reveals both interesting similarities and differences. Unlike the FDS3 group, participants at the University of Vienna did not struggle with the definition of geology (question 1, Quiz 1; Supplement). However, they did exhibit similar difficulties with question 3, a multiple-choice question that may have been confusing for the youngest participants. Another possible explanation for the lower score (only < 50 % participants answered correctly after the session) was that the answer was not explicitly provided during the presentation but was expected to be deduced from the whole activity, which may be challenging at an early age.
In recent years, Europe has seen an increase in excellent events organized to promote research, such as European Researchers' Night, national-level Open House events (e.g., Fête de la Science in France), and Pint of Science, to name a few. The common objective of these events is to develop interest, foremost among young audience, in science (e.g., Strick and Helfferich, 2023). However, little is known about the impact these events have had on the participants and how effective they have been in communicating science to the general public. Some commonly known topics are proven to be very successful in public engagement activities; for instance, ateliers related to climate change or space exploration, have developed efficient ways to evaluate their impact that is often published (e.g., Moser, 2009, 2016; Smith et al., 2014; Vergunst et al., 2025). However, for Marine Geosciences, the landscape is quite different. Even though there are exceptional materials produced by scientists and artists (e.g., Project Seafloor Futures; Mae Lubetkin, 2024), they remain relatively unknown even among researchers in the field. As no adequate study has been conducted, we can speculate that one of the main reasons is that none of the work and experience is shared through publications, which, in turn, requires an evaluation component that is typically unavailable. Given the particular nature of the technique, we wanted to expose, we opted for a hands-on approach combined with video materials; in addition, for the first time, we designed and applied an evaluation tool focused on the quantitative assessment of knowledge transfer.
As we continue to participate in many outreach events across Europe, the feedback we receive from participants, especially the youngest ones and their teachers/guardians, is highly positive. As an anecdote, several primary school students participating during the FDS event at IPGP, provided grades for the experiment in their final quiz, and the notes ranged from 18 to 19 out of 20. Although the quizzes were not designed to test the initial knowledge of the participants, it is interesting to note that marine geosciences and associated processes, in particular, the concept related to seismic wave propagation are not well-known, as they are not covered by the core curriculum typically taught in primary and secondary school education. However, the results of the quizzes are encouraging and show that “learning by doing” is effective in helping students discover this lesser-known world, and we hope that some of the participants will develop a certain level of passion for marine sciences.
In designing the experiment, we primarily rely on our experience participating in the open house events. In fact, our prototype model (conducted for the first time by M. Marjanović in 2017 at FDS – IPGP), involved only a small plexiglass water tank (∼ 30 L). For this initial model, the focus was on showing how the source works, therefore in addition to the tank it also included the underwater balloon explosion. The water was splashing everywhere, which was fun, but the personal sentiment was that the audience did not seem to receive the main message about seismic data collection. Several years of thinking and building the right team, as well as obtaining funding through EGU led to the model we have today.
Although the current model represents a significant improvement, one limitation is that we have only one hydrophone to record the shot, but we have three OBS models at the bottom of the tank, which sometimes leads to confusions. In addition, the hydrophone-microphone is often more sensitive to the movement of the participants than to the actual balloon' explosion. Currently, we are considering replacing it with piezoelectric sensors, placed close to each of the OBS models. In the future, we plan to upgrade the experiment to use sonar for simulating collection of bathymetry data. In addition, as the next stage of our project, we plan to properly film the experiment and make the material available online in multiple languages to reach students internationally. In parallel, we will also work on improving the quizzes by collaborating more closely with schoolteachers to adapt them to the school curriculum. In addition, we will eliminate multiple-choice questions as they pose problems at the evaluation stage (currently, the answer is considered correct if at least two correct answers are selected). Finally, we will be updating our presentation with the latest video material as we continue to collect it while at sea.
No primary data sets were used in producing this article.
The presented video depicts the experiment. It was recorded during one of the test sessions conducted by S. Besançon and available at: https://sdrive.cnrs.fr/s/33SgMcHtpwWRKYe (Marjanovic, 2026).
The supplement related to this article is available online at https://doi.org/10.5194/gc-9-21-2026-supplement.
MM conceived the project; MM, SB applied for the funding and built the model; SM conducted analyses of the quizzes' results; MM, SB, SM, DH, TL conducted the experiments; MM wrote the initial draft of the manuscript with input from all co-authors.
The contact author has declared that none of the authors has any competing interests.
For conducting of the quizzes, we closely followed the “Ethical Guidelines for Educational Research” published by the British Educational Research Association. Before the quizzes, we explained the process to the guardians (teachers and/or parents) and obtained their consent. All quizzes were anonymous, and the results do not reveal any personal details of the participants. Students had the right to withdraw from the quiz at any stage.
Publisher's note: Copernicus Publications remains neutral with regard to jurisdictional claims made in the text, published maps, institutional affiliations, or any other geographical representation in this paper. The authors bear the ultimate responsibility for providing appropriate place names. Views expressed in the text are those of the authors and do not necessarily reflect the views of the publisher.
We would like to thank the European Geoscience Union (EGU) and the Institut de Physique du Globe (IPGP) for the financial support of the model and for their assistance in organizing the events. In particular, we want to thank Emmelyne Mitard (now at INSU-CNRS), Pierre-Olivier Foucault (IPGP), Antoine Roux (now at INSU-CNRS), and Christina Orieschnig (EGU). We are also grateful to the colleagues from Vienna University, Heidi Wienhäupl and Nils Bezwoda, for preparing the materials we needed to conduct the experiment; we especially thank Xenia Hauser and David Fischer (UV), who conducted the event in German during the Planet Day event at the University of Vienna. We also thank the high school (led by Chloé Lardy), as well as all the participants in the experiment. To build the LEGO ship, we had great help from Elodie Lebas, Antoine Demont and Jean-Guillaume Feignon. We are grateful to Samuel Howell (JPSL), who provided invaluable advice for the experiment's conception. Finally we want to acknowledge the contribution of the reviewers Sima Mousavi and Maya Pincus, as well as the editor Louise Arnal, whose comments improved the manuscript.
This research has been supported by the European Geosciences Union (EGU Public Engagement Award in 2023).
This paper was edited by Sam Illingworth and reviewed by Sima Mousavi and Maya Pincus.
Boon, W., de Haan, J., Duisterwinkel, C., Gould, L., Janssen, W., Jongsma, K., Milota, M., Radstake, M., Stevens, S., Strick, M., Swinkels, M., van Mil, M., van Sebille, E., Wanders, N., and Yerkes, M. A.: Meaningful public engagement in the context of open science: reflections from early and mid-career academics, Research for All, 6, 23, https://doi.org/10.14324/RFA.06.1.23, 2022.
Chen, J., Zhang, T., Tominaga, M., Escartin, J., and Kang, R.: Ocean Sciences with the Spilhaus Projection: A Seamless Ocean Map for Spatial Data Recognition, Sci. Data, 10, 410, https://doi.org/10.1038/s41597-023-02309-6, 2023.
Dragoset, B.: A historical reflection on reflections, The Leading Edge, 24, s46–s70, https://doi.org/10.1190/1.2112392, 2005.
Ewing, M. and Press, F.: Seismic measurements in ocean basins, Journal of Marine Research, 14, https://elischolar.library.yale.edu/journal_of_marine research/853 (last access: 6 January 2026), 1955.
Jensen, E. and Holliman, R.: Norms and values in UK science engagement practice, International Journal of Science Education, Part B: Communication and public engagement, 6, 68–88, https://doi.org/10.1080/21548455.2014.995743, 2015.
Jonauskaite, D., Dael, N., Chèvre, L. Althaus, B., Tremea, A., Charalambides, L., and Mohr, C.: Pink for Girls, Red for Boys, and Blue for Both Genders: Colour Preferences in Children and Adults, Sex Roles, 80, 630–642, https://doi.org/10.1007/s11199-018-0955-z, 2019.
Land-Zandstra, A. M., Strick, M., Peeters, W., and De Jong, P.: Het meten van impact van wetenschapscommunicatie: Eindrapport IMPACTLAB, Zenodo [data set], https://doi.org/10.5281/zenodo.7884384, 2023 (version in English is available online: https://impactlab.sites.uu.nl/en/, last access: 6 January 2026).
Lehmann, I.: Seismology in the days of old, Eos, 68, 33–35, 1987.
Lubetkin, M.: Seafloor Futures Ocean-Archive.org Digital Residency 2023–2024, https://garden.ocean-archive.org/seafloor-futures/ (last access: 6 January 2026), 2024.
Marjanovic, M.: Movie_M-Marjanovic.mov, sDrive [video], https://sdrive.cnrs.fr/s/33SgMcHtpwWRKYe, last access: 6 January 2026.
Mohorovičić, A.: Potres od 8. X 1909/Das Beben vom 8. X 1909, Godišnje izvješće zagrebačkog meteorološkog opservatorija za godinu 1909, Zagreb, 1–56, https://hrcak.srce.hr/20133 (last access: 6 January 2026), 1910.
Moser, S. C.: Communicating climate change: history, challenges, process and future directions, WIREs Clim. Change, 1, 31–53, https://doi.org/10.1002/wcc.11, 2009.
Moser, S. C.: Reflections on climate change communication research and practice in the second decade of the 21st century: what more is there to say?, WIREs Climate Change, 7, 345–369, https://doi.org/10.1002/wcc.403, 2016.
Reincke, C. M., Bredenoord, A. L., and Van Mil, M. H.: From deficit to dialogue in science communication, EMBO Reports, 21, 1–4, https://doi.org/10.15252/embr.202051278, 2020.
Smith, D. A., Peticolas, L., Schwerin, T., Shipp, S., and Manning, J. G.: Science and Science Education Go Hand-in-Hand: The Impact of the NASA Science Mission Directorate Education and Public Outreach Program, Ensuring STEM Literacy: a National Conference on STEM Education and Public Outreach ASP Conference Series, 483, eISBN: 978-1-58381-851-0, 2014.
Strick, M. and Helfferich, S.: Active ingredients of science communication impact: a quantitative study at a science festival, J. Sci. Commun., 22, N01, https://doi.org/10.22323/2.22020801, 2023.
Staples, R. K., Hobbs, R. W., and White, R. S.: A comparison between airguns and explosives as wide-angle seismic sources, Geophysical Prospecting, 47, 313–339, https://doi.org/10.1046/j.1365-2478.1999.00134.x, 1999.
Thomas, G. and Durant, J.: Why should we promote the public understanding of science?, in: Scientific Literacy Papers, edited by: Shortland, M., Oxford, Rewley House, 1–14, https://ocw.mit.edu/courses/sts-014-principles-and-practice-of-science-communication-spring- 2006/9a2dfa5e9d69b2c0bd06b38606827f1c_durant_promote.pdf (last access: 6 January 2026), 1987.
U.S. Geological Survey: Earthquake Lists, Maps, and Statistics, 2022.
Vergunst, N., Varol, T., and van Sebille, E.: Designing and evaluating a public engagement activity about sea level rise, Geosci. Commun., 8, 67–80, https://doi.org/10.5194/gc-8-67-2025, 2025.