the Creative Commons Attribution 4.0 License.
the Creative Commons Attribution 4.0 License.
 | 10 Oct 2024
Earth science for all? The economic barrier to European geoscience conferences
Francyne Bochi do Amarante
Mauricio Barcelos Haag
Scientific meetings are vital for research development and networking. However, these events often reflect unconscious biases and barriers to diversity, particularly affecting marginalized groups. The future success of the geosciences depends on diversity, which enhances problem-solving and innovation through varied perspectives. This study examines the attendance diversity at the European Geosciences Union (EGU) General Assembly from 2005 to 2024, focusing on the impact of economic factors, distance, and population size on participation. Using publicly available data from the World Bank and the EGU, this study finds that gross national income (GNI) is the primary determinant of attendance, especially post-COVID. Distance also influences attendance but to a lesser extent, while population size shows a weak correlation. To improve diversity in academic conferences, we suggest facilitating donations, offering affordable accommodations, establishing additional travel funds, and rotating the conference location. Our actions must go beyond the EGU General Assembly and other geoscience conferences, as these actions can also help dismantle barriers to inclusivity in other areas of our community. By addressing these financial and systemic barriers, geoscience conferences can become more inclusive, benefiting the entire scientific community.
- Article
(2218 KB) - Full-text XML
-
Supplement
(306 KB) - BibTeX
- EndNote


Academic conferences are crucial for researchers for promoting their work, establishing new connections and collaborations through networking, and being informed of up-to-date research that is taking place across the globe. Such events are also places where the identities of scientists are constructed and scientists are perceived within their community, often inadvertently reinforcing unconscious biases. Scientific conferences tend to reproduce barriers to diversity in the geosciences, meaning that there is an underrepresentation of people from marginalized groups (i.e., communities excluded or disadvantaged due to systemic discrimination based on identity factors like race, gender, or socioeconomic status) and citizens from low- and middle-income countries (LMICs; King et al., 2018; Talavera-Soza, 2023), who are therefore more likely to face barriers to their career progress.
Diversity is essential to the future success of geoscience. As a community, we tackle complex global problems that transcend artificial geographical boundaries imposed by historical biases (Raja et al., 2022). Some of these problems, such as natural resource depletion, disaster risk reduction, and climate change, are urgent, and failure to tackle them will have dramatic negative consequences (Rogers et al., 2022). Addressing these subjects requires scholars with diverse backgrounds, including a representative mixture of cultures and ethnicities. Different perspectives and life experiences lead to unique questions and approaches to problem-solving and inspire more creative alternatives to relevant challenges, ultimately leading to higher levels of scientific innovation (Medin and Lee, 2012; Hong and Page, 2004).
Within this context, scientific meetings play an important role in bringing together and promoting knowledge exchange among scholars from diverse backgrounds. However, how diverse are geosciences meetings? Here, we probe attendance figures for Europe's largest geosciences meeting, the European Geosciences Union (EGU) General Assembly, held in Vienna (Austria) since 2005. We selected the EGU because it integrates all geosciences subjects and ranks among the biggest international conferences in the world, with participants from over 110 countries. Using publicly available historical data (EGU, 2024a), we highlight the persistence of economic factors as the primary control for conference attendance (Fig. 1). From our perspective of participating in the 2024 EGU General Assembly, we note that, while the theme of equality, diversity, and inclusion (EDI) is significantly featured in the conference program, the actual diversity observed falls short of ideal standards.
We examine geographical diversity and representation at the EGU General Assembly (hereafter referred to as the EGU meeting, assembly, or conference), one of the largest geosciences meetings in the world. For each country, we analyze attendance figures from 2005 to 2024 relative to three variables: (i) distance to the event, (ii) gross national income (GNI) per capita, and (iii) population size. We chose distance to assess whether geography was the principal driver of attendance variability and GNI in order to assess the impact of income on participation. Given the lack of precise demographic data on the number of geoscientists per country, we use population as a proxy assuming the number of geoscientists per capita is the same. All demographics are publicly available and derived from the World Bank and the EGU's website (EGU, 2024a – see the Supplement). We favor these metrics because they are simple and not co-dependent or derived from each other (e.g., the human development index and Henley passport index, which derive from a series of political and economic factors). Because the selected metrics vary over several orders of magnitude, we calculate the Spearman rank correlation coefficient (ρ) rather than a linear regression to examine their relative impact on the EGU's conference participation.
Additionally, to avoid post-COVID biases in travel patterns and truthfully represent historical attendance trends, we exemplify these relationships using data from the last pre-COVID edition of the EGU's meeting (2019). In addition to correlation coefficients, we compute income-independent overrepresentation and underrepresentation by dividing the normalized attendance by the product of population and distance to the conference.
3.1 Gross national income over time
Over the years, the EGU assembly's attendance has exhibited a strong correlation with GNI as illustrated in Fig. 1, where the correlation coefficient (ρ) typically exceeds 0.6. Notably, these correlation values have consistently been significant at the 99 % confidence level (they are between 10−8 and 10−13, below the minimum value for the y axis in Fig. 1b), demonstrating remarkable stability throughout the EGU meeting's history. This strong relationship between attendance and income is only disrupted by countries with large populations, such as China and India (Fig. 2b). In other words, these countries exhibit higher-than-expected participation based on their GNI values. While there was a decreasing trend in the correlation between attendance and GNI from the inception of the EGU assembly (2005) to 2015, from the latter half of the 2010s (2015 until 2024) there was a reversal of this trend, with a notable increase in the correlation between attendees and GNI. Post-COVID metrics (2022 to 2024) reveal the strongest correlation ever recorded, with ρ exceeding 0.8. In the virtual versions of the event (held from 2020 onwards), this correlation between attendance and GNI is less strong (ρ<0.6; Fig. 1a).
3.2 Distance to conference site over time
The impact of distance to the conference site on attendance emerges as a secondary factor, with low correlation coefficients typically hovering around 0.35 (Fig. 1). Although this correlation is relatively weak, it remains stable and statistically significant at the 99 % confidence level over the years. Despite its independent influence, distance often interacts with GNI as a combined socioeconomic limiting factor, since individuals from more distant countries have higher travel expenses. This pattern is disrupted by distant wealthy countries, such as Australia, Japan, and New Zealand, which have all maintained robust participation throughout the EGU assembly's history (Fig. 2a). In virtual versions of the event, distance shows the weakest correlation with attendance (Fig. 1a, ρ<0.4).
3.3 Population over time
In contrast to gross national income, the total population of a country typically shows a poor correlation with attendance for the majority of the EGU assembly's history, with ρ values consistently below 0.3 from 2005 to 2017 (Fig. 1). Despite that, there has been a steady increase in the correlation coefficient for population until 2018, with 2015 marking the first instance of statistical significance at the 99 % confidence interval. This is particularly noticeable when examining the change in attendance figures for populous countries such as India, China, and Indonesia during a 10-year pre-COVID period (2009–2019; Fig. 2). Nonetheless, post-COVID figures for 2022 to 2024 indicate a significant drawback in this correlation, as evidenced by ρ below 0.2, representing the lowest value ever recorded in the EGU assembly's history. In the virtual versions of the assembly, held between 2020 and 2024, the population shows a stronger correlation (ρ∼0.4) when compared with the in-person format of the event (ρ<0.2).

Figure 1Correlation between EGU General Assembly participants and distance to the conference, total population, and GNI per capita. (a) Spearman's rank correlation coefficient (ρ) and (b) its respective significance (p values): whenever a p value is not visible, this indicates that the p value is less than 10−5 (p values for the GNI correlation are between 10−8 and 10−13).
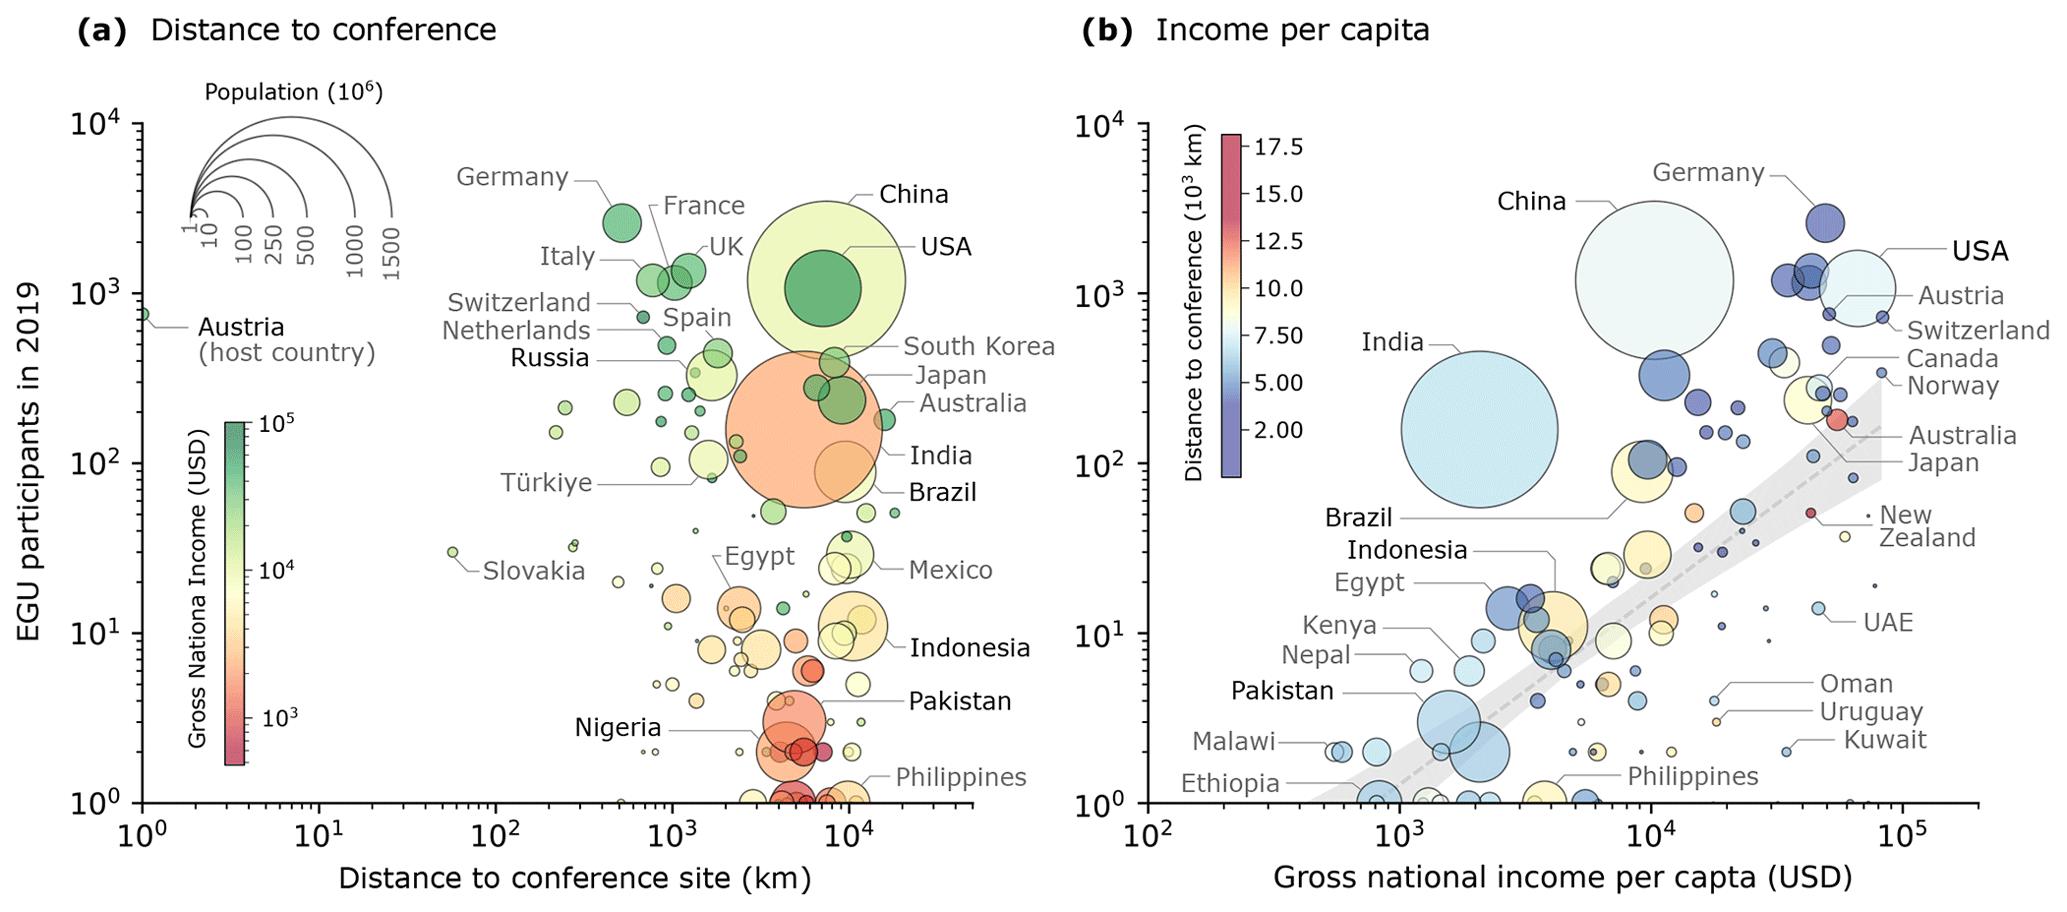
Figure 2EGU General Assembly attendance for the last pre-COVID meeting in 2019. (a) Participation vs. distance to the conference. (b) Attendance vs. gross national income per capita. Gray-shaded regions in panel (b) denote 95 % confidence intervals for a best-fit power-law regression of the data.
Based on the variables investigated here, our results indicate that attendance at the EGU's General Assembly is primarily and consistently controlled by income metrics (GNI), with the strongest correlation ever recorded in the past 3 years (Fig. 1, 2022–2024). Distance to the conference site also influences attendance, albeit with a weaker correlation. In contrast, a country's total population has historically shown a poor correlation with attendance (Figs. 1 and 2).
When comparing countries with similar populations and distances to the conference site, it becomes evident that income stands out as the main influencing factor in attendance (Fig. 2a). Nations with similar distances to the conference tend to exhibit higher participation rates with increasing GNI (Fig. 2a). Examples include, from lower to higher GNI, Pakistan, South Korea, and the USA. This pattern is disrupted by populous countries such as India and China. Similarly, a trend is observed among countries with comparable populations. For instance, Ethiopia and the Philippines have significantly fewer participants compared to Japan (Fig. 2b). In this context, our compilation reveals that attendance is dictated by a power-law relationship with income, with wealthier nations having 2 to 3 orders of magnitude more participants than poorer countries (Fig. 2b).
Under an income-independent participation scenario, participation would depend on distance and population. To identify the impact of income, the map in Fig. 3 shows the relative representation of each country at the EGU assembly of 2019 after normalizing for distance and population. Notably, countries in Europe, northern North America, and Oceania (the “Global North”) exhibit the highest representation. Not coincidentally, these are the countries with the highest GNI per capita values (Fig. 2b; World Bank, 2024). Conversely, numerous countries in Latin America, Africa, and Asia are moderately to highly underrepresented in the conference. Based on correlation metrics (Fig. 1) and attendance plots (Fig. 2a), the distance from the conference venue can be ruled out as the primary reason for representativity. From a global perspective (Fig. 3), curves of equidistance reveal that countries located at comparable distances from Austria present varying levels of representation. For instance, despite all being approximately 7500 km away, India and nations in central Africa are notably underrepresented, while Canada stands out as overrepresented in conference attendance (Fig. 3). Additionally, Australia, despite being one of the most distant countries from Austria, maintains a high level of representation at the event (Figs. 2b and 3).

Figure 3Representation attendance map for the EGU General Assembly 2019 corrected for both distance and population. Dashed lines represent the distance to the EGU's conference site in Vienna, Austria.
Ultimately, attendance at the in-person EGU assembly is largely controlled by income. With registration fees ranging from EUR 525 to 765 for non-students in 2024, the economic burden varies significantly across countries. For instance, in our home country Brazil, registration costs can amount to nearly 3 times the monthly minimum income, or about half the monthly income of a full professor (World Salaries, 2024). In African nations like Angola, Nigeria, and the Democratic Republic of Congo, fees can exceed 10 times the monthly minimum income, or roughly 2 to 3 times the monthly income of a full professor (World Salaries, 2024). In contrast, in Canada, the fees equate to roughly half of the monthly minimum income, or about one-tenth of the monthly income of a full professor (World Salaries, 2024). In addition, travel expenses are generally much higher than registration fees, which are only a fraction of the total cost. Additional expenses, including transportation, accommodation, and meals priced in the local currency (Euros), significantly add to the overall financial commitment of participation.
Another significant barrier to in-person attendance by researchers from LMICs, countries with less political stability, and nations facing geopolitical tensions is the challenge of obtaining a visa to enter Austria. The process is often both costly and time-consuming, often requiring extensive paperwork, letters of support, and sometimes in-person appointments, which may involve travel costs. Scientists from countries like Iran, Afghanistan, Yemen, and Bangladesh frequently face more stringent visa requirements and higher rejection rates compared to those from countries like Canada, Australia, or Japan (Passport Index, 2024). To address this issue, the EGU has implemented measures to support visa applications by providing detailed invitation letters (EGU, 2024a).
It is clear that the European Geosciences Union (EGU) acknowledges the importance of diversity and is actively working towards a more equitable future. In 2018, the EGU Council established an equality, diversity, and inclusion (EDI) committee to raise awareness and promote EDI initiatives (EGU, 2024b). Similar efforts have been observed in other geoscience conferences and societies. For instance, the American Geophysical Union Meeting, the world's largest geoscience conference, also adopted the Diversity and Inclusion Strategic Plan in 2018 (AGU, 2024). The Geological Society of London recently established the new Equity, Diversity, Inclusion and Accessibility Committee in 2024 (Geological Society of London, 2024).
Additionally, after the COVID-19 pandemic in 2020, the EGU introduced a virtual version of the meeting. This version offers lower fees and free enrollment for (i) undergraduate or Master's students and (ii) low- and lower- to middle-income countries. These initiatives are readily observed in correlation metrics for the virtual version of the EGU assembly, which show record-breaking increased ranked correlation (ρ) for population and decreased ρ for GNI and distance (Fig. 1a). Clearly, the virtual event increased accessibility and diversity by reducing the cost. However, in our and others' personal experience, the virtual event shows limited engagement and interaction with presentations and reduced networking opportunities between attendees. Furthermore, the EGU offers financial assistance to encourage participation in the in-person event. The Roland Shlich travel support includes a waiver of registration fees, reimbursement of the abstract processing charges, and travel expenditure aid of up to EUR 300. Even though this initiative is commendable and impactful, the overall cost of attending remains prohibitive for scholars from low-income countries.
To increase diversity at events like the EGU assembly and other geoscience events, we must alleviate financial barriers for attendees from lower-income countries. Here we explore some possibilities for achieving that goal. Firstly, establish a dedicated travel fund aimed at supporting attendees from lower-income countries and underrepresented regions (Fig. 3). This fund could help cover visa costs and offset exchange rate disparities. It could be financed through donations from attendees, companies, universities, and patrons. Secondly, consider rotating the conference's host country within Europe, making it more accessible to participants from various regions. Besides changing the distance to other countries outside of Europe, costs of accommodation and meals vary significantly across European countries (ranging from approximately EUR 36 to 136 per day; Price of Travel, 2024). Lastly, facilitate affordable accommodation options for scholars from lower-income countries through partnerships with hotels, hostels, or university housing.
Our discussion around increasing diversity and representation cannot be limited to the EGU General Assembly or geoscience conferences in general; rather, it must extend to acknowledging how conference attendance perpetuates barriers to inclusivity within our community. The attendance patterns of the EGU assembly highlight the prevalence of Global North countries, which reflects the historical dominance of these societies in shaping the field of geosciences until the present.
Ethnic and cultural underrepresentation not only hinders the career advancement of marginalized groups but also underscores the persistent dominance of the Global North in many scientific fields, including the geosciences (Rogers et al., 2022; Raja et al., 2022). Academic neocolonialism is not only reflected in conference participation patterns, but also extends to the selective prestige accorded to universities and journals and the imposition of curricula, educational systems, languages, and epistemologies on formerly colonized societies (Nagtegaal and de Bruin, 1994; Rogers et al., 2022).
To promote equal research opportunities and equitable conference attendance, structural changes are necessary. We need to recognize and praise the true achievements and potential of scholars from outside the Global North. North–south scientific collaborations must become more symmetrical and be founded on mutual respect, ensuring that knowledge production is collaborative rather than extractive (Jeffery, 2013; North et al., 2020; Rogers et al., 2022; Garland et al., 2024). Funding disparities ought to be tackled by the development of multi-partner and multinational co-funded research projects (Jeffery, 2013). Biases inherent in the peer-review process of both papers and grant applications must be acknowledged and addressed (Rogers et al., 2022). Geoscience conferences need to be accessible to all, allowing scholars from underrepresented regions to share their research and perspectives and to expand their networking opportunities. By recognizing and valuing the contributions of scientists from diverse backgrounds, we can move towards a more inclusive and equitable scientific community.
All data are publicly available and are also available from the authors upon request.
The supplement related to this article is available online at: https://doi.org/10.5194/gc-7-245-2024-supplement.
FBdA: conceptualization, formal analysis, investigation, project administration, visualization, writing – original draft preparation. MBH: conceptualization, data curation, formal analysis, investigation, methodology, visualization, writing – original draft preparation.
The contact author has declared that neither of the authors has any competing interests.
This article was produced by the authors on a voluntary basis and received no funding from external sources or grants. Since the work did not involve any people and did not include personal information, it did not require an ethical review.
Publisher's note: Copernicus Publications remains neutral with regard to jurisdictional claims made in the text, published maps, institutional affiliations, or any other geographical representation in this paper. While Copernicus Publications makes every effort to include appropriate place names, the final responsibility lies with the authors.
We gratefully acknowledge Christopher Jackson and the anonymous reviewer for their constructive insights, together with Shahzad Gani for his editorial handling.
This paper was edited by Shahzad Gani and Sam Illingworth and reviewed by Christopher Jackson and one anonymous referee.
American Geophysical Union (AGU): Diversity, Equity, and Inclusion at AGU, https://www.agu.org/learn-about-agu/about-agu/diversity-and-inclusion (last access: 22 March 2024), 2024.
European Geosciences Union (EGU): List of General Assemblies, https://www.egu.eu/meetings/general-assembly/meetings/ (last access: 19 March 2024), 2024a.
European Geosciences Union (EGU): Structure Equality, Diversity, and Inclusion Committee, https://www.egu.eu/structure/committees-and-working-groups/edi/ (last access: 22 March 2024), 2024b.
Garland, R. M., Altieri, K. E., Dawidowski, L., Gallardo, L., Mbandi, A., Rojas, N. Y., and Touré, N. E.: Opinion: Strengthening research in the Global South – atmospheric science opportunities in South America and Africa, Atmos. Chem. Phys., 24, 5757–5764, https://doi.org/10.5194/acp-24-5757-2024, 2024.
Geological Society of London: Our new Equity, Diversity, Inclusion and Accessibility Committee, https://www.geolsoc.org.uk/About/Diversity/EDIA-Committee (last access: 13 August 2024), 2024.
Hong, L. and Page, S. E.: Groups of diverse problem solvers can outperform groups of high-ability problem solvers, P. Natl. Acad. Sci. USA, 101, 16385–16389, https://doi.org/10.1073/pnas.0403723101, 2004.
Jeffery, R.: Authorship in multi-disciplinary, multi-national North-South research projects: issues of equity, capacity and accountability, Compare, 44, 208–229, https://doi.org/10.1080/03057925.2013.829300, 2013.
King, L., MacKenzie, L., Tadaki, M., Cannon, S., McFarlane, K., Reid, D., and Koppes, M.: Diversity in geoscience: Participation, behaviour, and the division of scientific labour at a Canadian geoscience conference, FACETS, 3, 415–440, https://doi.org/10.1139/facets-2017-0111, 2018.
Medin, D. L. and Lee, C. D.: Diversity makes better science, Association for Psychological Science, https://www.psychologicalscience.org/observer/diversity-makes-better-science (last access: 22 March 2024), 2012.
Nagtegaal, L. W. and de Bruin, R. E.: The French connection and other neo-colonial patterns in the global network of science, Res. Evaluat., 4, 119–127, https://doi.org/10.1093/rev/4.2.119, 1994.
North, M. A., Hastie, W. W., and Hoyer, L.: Out of Africa: The underrepresentation of African authors in high-impact geoscience literature, Earth-Sci. Rev., 208, 103262, https://doi.org/10.1016/j.earscirev.2020.103262, 2020.
Passport index: Welcoming Countries Rank, https://www.passportindex.org/ (last access: 20 August 2024), 2024.
Price of Travel: 54 European cities by price: Europe Backpacker Index for 2024, https://www.priceoftravel.com/ (last access: 13 August 2024), 2024.
Raja, N. B., Dunne, E. M., Matiwane, A., Khan, T. M., Nätscher, P. S., Ghilardi, A. M., and Chattopadhyay, D.: Colonial history and global economics distort our understanding of deep-time biodiversity, Nat. Ecol. Evol., 6, 145–154, https://doi.org/10.1038/s41559-021-01608-8, 2022.
Rogers, S. L., Lau, L., Dowey, N., Sheikh, H., and Williams, R.: Geology uprooted! Decolonising the curriculum for geologists, Geosci. Commun., 5, 189–204, https://doi.org/10.5194/gc-5-189-2022, 2022.
Talavera-Soza, S.: Citizenship a determining factor in a geoscientist's career, Nat. Geosci., 16, 550–551, https://doi.org/10.1038/s41561-023-01221-3, 2023.
World Bank: GNI per capita, PPP (current international $), https://data.worldbank.org/indicator/NY.GNP.PCAP.CD (last access: 20 March 2024), 2024.
World Salaries: Average salaries of University Professors, https://worldsalaries.com/ (last access: 13 August 2024), 2024.