the Creative Commons Attribution 4.0 License.
the Creative Commons Attribution 4.0 License.
 | 17 Jul 2024
Air pollution walk as an impact education tool for air quality sensitization: a pilot from an Indian megacity
Debabrata Bej
Sandip Sankar Ghosh
Srijan Haldar
Arindam Roy
Air pollution has become a serious matter of concern in the global south, and a significant amount of funding has been used to create awareness of air pollution. The conventional method of sensitization relies on workshops where slide-based presentations, images, plots and graphs are shown to participants. However, sensitization about air quality using such an audio-visual format might not be sufficient to create adequate impact. Here, in this study, we propose a new sensitization technique, the pollution walk, where participants and a subject matter expert will walk through different urban micro-environments with a live air quality monitor. A pilot involving three such pollution walks with 24 participants was conducted in a South Asian megacity, and pre- and post-walk surveys were conducted. The results indicate a greater sense of understanding among the participants, and the multi-disciplinary nature of the air pollution problem has been communicated well. To understand the long-term impact, a survey after 1 year was conducted which clearly indicates high levels of awareness and behavioural changes among the participants.
- Article
(2320 KB) - Full-text XML
-
Supplement
(632 KB) - BibTeX
- EndNote


The IQAIR Report (2020) showed that 37 of the 40 most polluted cities on the globe are from South Asia, and the national ranking shows that India (Rank 5) is leading in terms of poor air quality; 33 % of global deaths due to air pollution occur in South Asian countries, and air pollution contributes to approximately 11 % of all these deaths. The global burden of disease study shows that 1.24 million deaths in India were attributed to air pollution in 2017, and both indoor (0.48 million deaths) and outdoor (0.68 million deaths) sources contributed significantly (Balakrishnan et al., 2019). Overall, the air quality over Indian cities has a significant health impact on citizens (Guttikunda and Goel, 2013; Gargava and Rajagopalan, 2015). Among air pollutants, PM2.5, or particulate matter with a diameter of less than 2.5 µm, is considered the dominating air pollutant due to its immense health impact (Balakrishnan et al., 2019). Generated via a combustion process, these tiny particles can enter into human lungs and increase the risk of lung cancer, chronic obstructive pulmonary disease and asthma (Apte et al., 2018: Bu et al., 2021). PM2.5 exposure is decreasing global life expectancy by 1 year, and for polluted regions over Asia, it can decrease life expectancy by up to 1.9 years (Apte et al., 2018).
Awareness of air pollution could play a vital role in reducing air pollution (Selden and Song, 1994; Liao et al., 2015; Veloz et al., 2020). A lack of awareness among air-pollution-vulnerable groups was reported in previous studies conducted in the global south (Guttikunda et al., 2014; Mor et al., 2022). The scope of air pollution in educational curricula is limited and confined to indoor syllabus-oriented modules, whereas there are scopes to improve awareness beyond a syllabus-oriented approach (Huo et al., 2020). Community-based outdoor education approaches have been proven to improve the understanding of participants irrespective of their age groups (Commodore et al., 2017; Szczytko et al., 2020; Garip et al., 2021). Fieldwork, community learning and outdoor engagement could help in developing better environmental literacy and could inspire people to shift towards more sustainable consumption and environmentally friendly practices (Christie and Waller, 2019; Persson et al., 2022). Previous studies have shown that citizen participation programmes or “citizen-science”-driven air quality monitoring have been able to create active engagement and result in larger social objectives in cities in the global north (Nali and Lorenzini, 2007; Gabrys et al., 2016; Commodore et al., 2017; Varaden et al., 2018). However, such studies in the polluted global south are not available where impact sensitization has been created through a citizen science programme on air quality measurement.
Kolkata is one of the megacities in the eastern part of India, with 14.1 million people (census data taken from https://bengallocal.in/districts/kolkata/, last access: 22 June 2023). Previous studies have reported poor air quality and associated respiratory illness in the city (Ghose et al., 2005; Haque and Singh, 2017; Dutta and Pal, 2023). Industry, transport and biomass burning are known to be major sources of air pollution in Kolkata, and approximately 10 200 people die because of air pollution per year (Lelieveld et al., 2015; Gurjar et al., 2016). The deterioration of air quality is coupled with a lack of air quality information, public display and awareness among citizens. The present study intends to introduce a new awareness-building tool to improve understanding of air pollution among citizens. A walk across different parts of the city with air quality monitors and live data displays (in brief, a “pollution walk”) was conducted with diverse groups of citizens, and several complex air-quality-related topics were introduced. To the best of our knowledge, such innovative tools have not been introduced in India before and globally: we have only found a single approach in London (Gabrys, 2017). In the global north megacities, where air pollution has become a primary reason for premature mortality, no such innovative sensitization techniques have been used to the best of our knowledge.
The air pollution walk began with a short pre-walk discussion, and then the participants were asked to follow a specific path comprised of roads, food stalls, traffic intersections, etc., with a handheld PM2.5 monitor (see the Supplement). The PM2.5 monitoring procedure is discussed in detail in Sect. 2.3. Short training was given to all the participants regarding the operation process of the PM2.5 monitor and data collection procedure. On the path, the participants were sensitized about the relevant sources by showing them the live PM2.5 data, and detailed explanations were provided. Post-walk, a focus group discussion was organized with the participants from the walk to discuss the results. Three such air pollution walks were organized during the month of July 2022 with 24 participants altogether. Pre- and post-walk surveys were done with the participants. A follow-up open-ended survey was done after 1 year (July 2023) with the participants. The walk works as a citizen science programme where scientists designed the programme and walk with the participants, who act as contributors to the project (Wildschut, 2017).
2.1 Route for demonstration
Several aspects need to be taken care of before finalizing a route for demonstrating air quality. The route that has been selected for the study was comprised of indoor housing, followed by a kitchen, minor roads with residential houses and commercial outlets, a major road, a busy traffic intersection, roadside food stalls, and an industrial unit. Each of the micro-environments has different sources of air pollutants. The major roads have a stretch of 400 m, and this includes a busy cross section with 1 min of signal time. On average, approximately 10 000 cars pass during office hours on the major road. The minor roads (∼600 m long) have one-tenth of the traffic as compared to the major road. Multiple roadside restaurants using biomass as cooking fuel were observed during the trial. The industrial unit uses smelters and is located on the main road. The entire trail map is represented in Fig. 1. The walk took place during busy hours while most of the city's people were returning home from the office (18:00 GMT+5:30) and took nearly 2 h to finish.
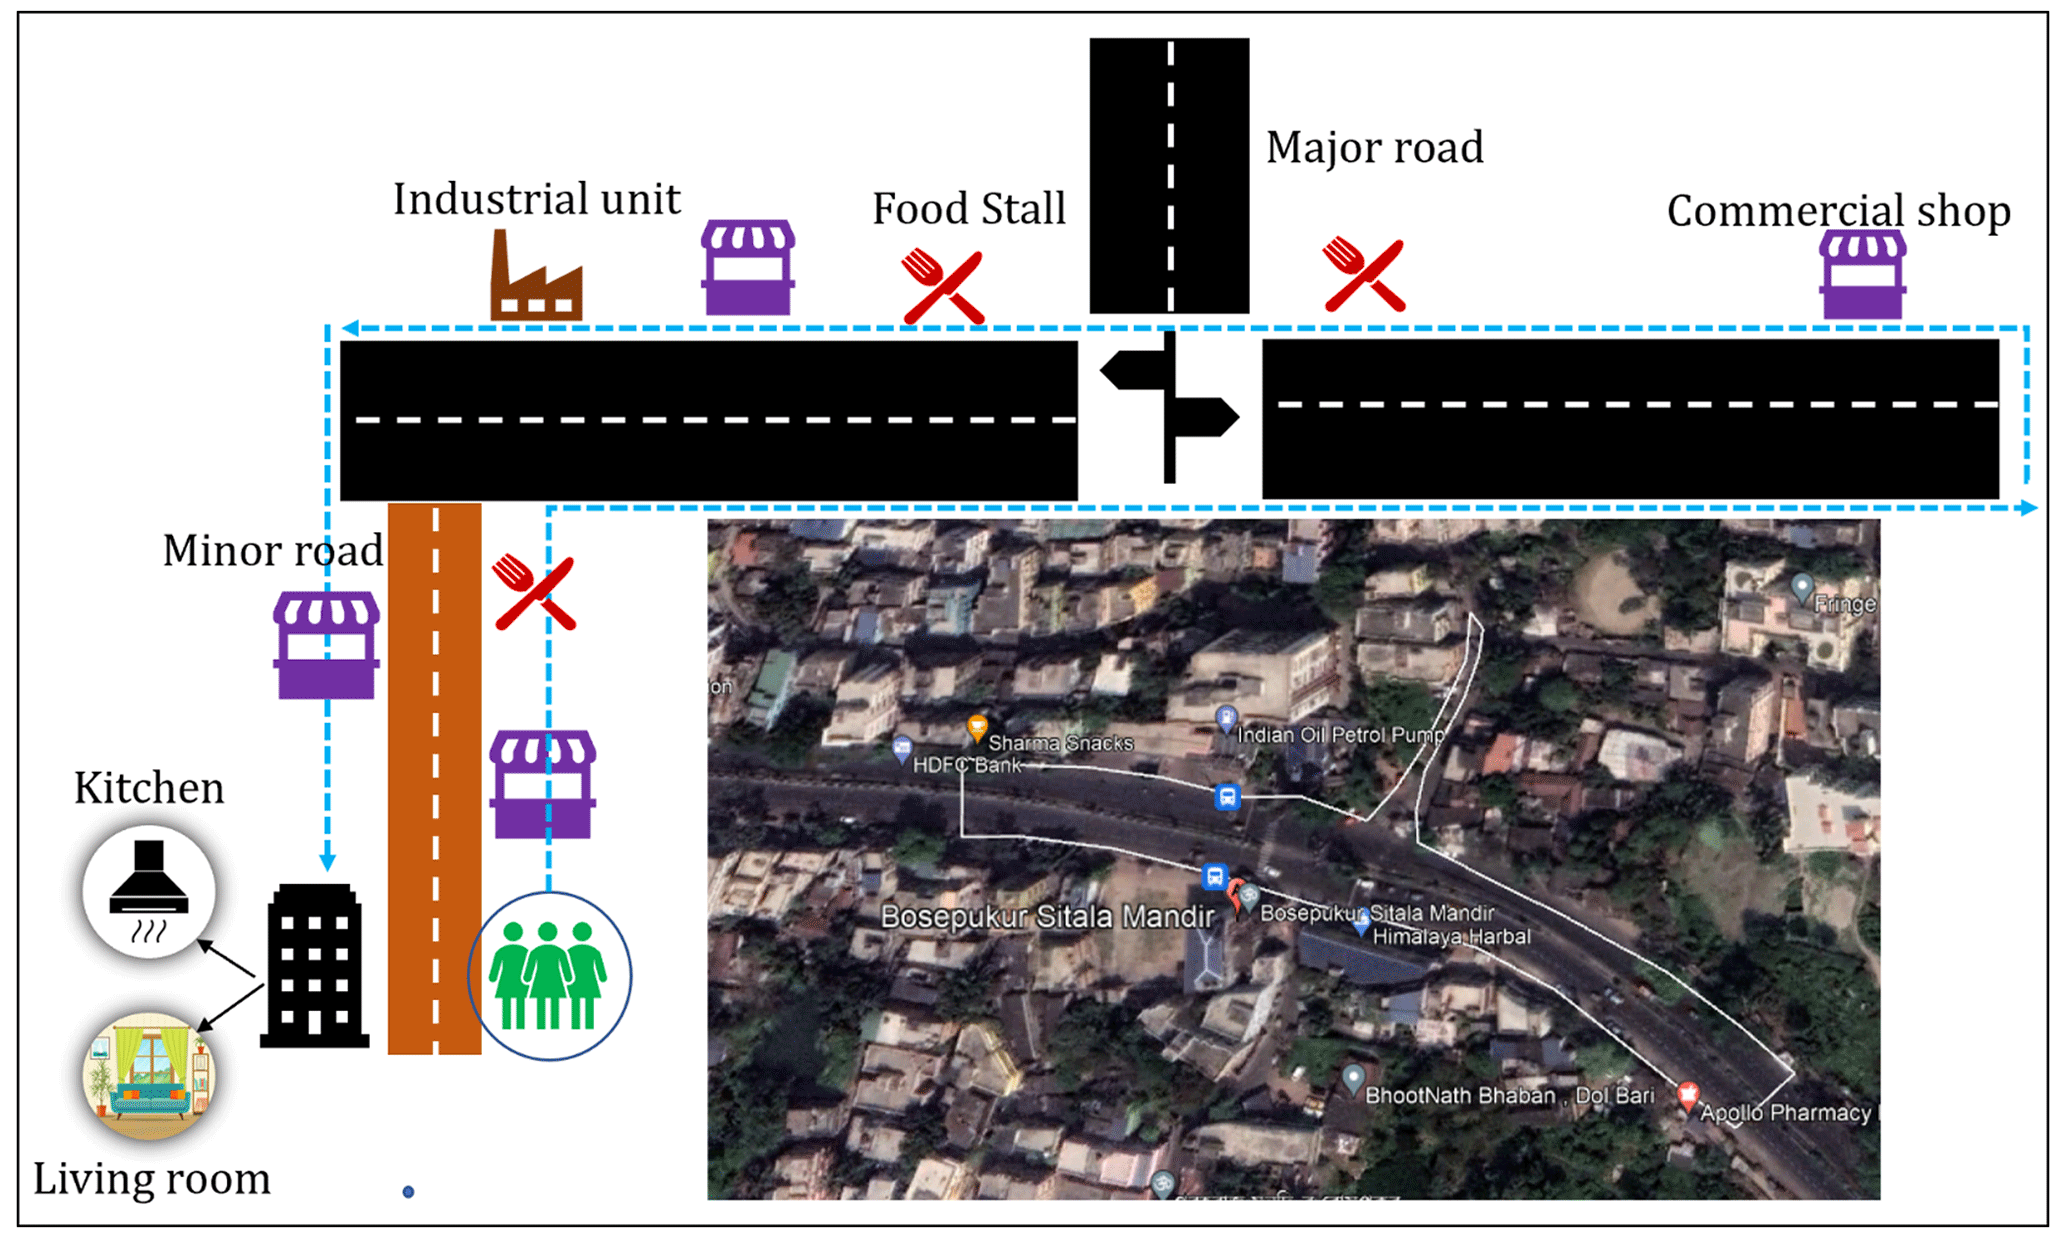
Figure 1Schematic and satellite image of the pollution walk path for the study. The blue dashed line indicates the walking trail (© Google Earth).
2.2 Targeted air pollutant characteristic
Traditionally, air quality has been measured using a fixed monitoring station installed at traffic sites or background sites to understand the compliance and trend of air quality (Varaden et al., 2021). Such stations are limited in terms of data availability and accessibility to citizens and also do not represent individual pollutant exposure (Snyder et al., 2013; Steinle et al., 2013). The recent advancement of low-cost mobile air quality sensors provides a unique opportunity to improve spatial monitoring extents as well as the perception of air quality among citizens (Nieuwenhuijsen et al., 2015). Live data also provide an interesting scope to explain several air quality-related topics which generally remain untouched during a conventional workshop. Here, the participants were able to visualize (a) how ventilation improves indoor air quality, (b) differential emission from different sources, (c) improvement of air quality away from the sources, (d) the impact of meteorology on air quality and (e) the spatial distribution of air pollutants. The pre-walk briefing was conducted in a room where the entire procedure was described to the participants, and we also measured the ambient PM2.5 concentration in the room. Then the participants were asked to visit the adjacent kitchen to monitor the indoor pollution contribution from cooking. Then the participants moved outside, and it was explained to them how ventilation helps to dilute air pollutants. Further, the participants walked through major and minor roads and measured air pollutants in different settings. The participants walked through the same route to the room, and a semi-structured interview was conducted.
2.3 Measurement of the air pollutant
PM2.5 has been considered this study's target pollutant since it is indisputably the most harmful air pollutant in India (Balakrishnan et al., 2019). A high-precision digital PM2.5 concentration sensor, Plantower PMS5003, has been used to measure the mass and amount of suspended particulate matter (PM2.5) in the air. This PMS5003 sensor has been integrated with an Arduino Mega 2560 micro-controller. A temperature and relative humidity sensor, DHT22, has also been attached to the micro-controller. A DS3231 real-time clock (RTC) module has been integrated with the system to provide a precise time and date to the PM2.5 data. A NEO-6M GPS module has been connected to the system to receive georeferenced PM2.5 pollution data at any location. An LCD has been interfaced with the system to display the PM2.5 data. For real-time data capture, a micro SD card has been connected to the system using a micro SD card module. A 18650 lithium battery shield has been used to supply the required power to operate this system. The code has been written and uploaded to the Arduino Mega 2560 micro-controller board using the Arduino IDE 1.8.19 software. The PM2.5 monitor has been calibrated against a reference monitor, and relative humidity corrections have been made following the previous literature (Badura et al., 2018; Feenstra et al., 2019; Jha et al., 2021).
2.4 Participants and interviews
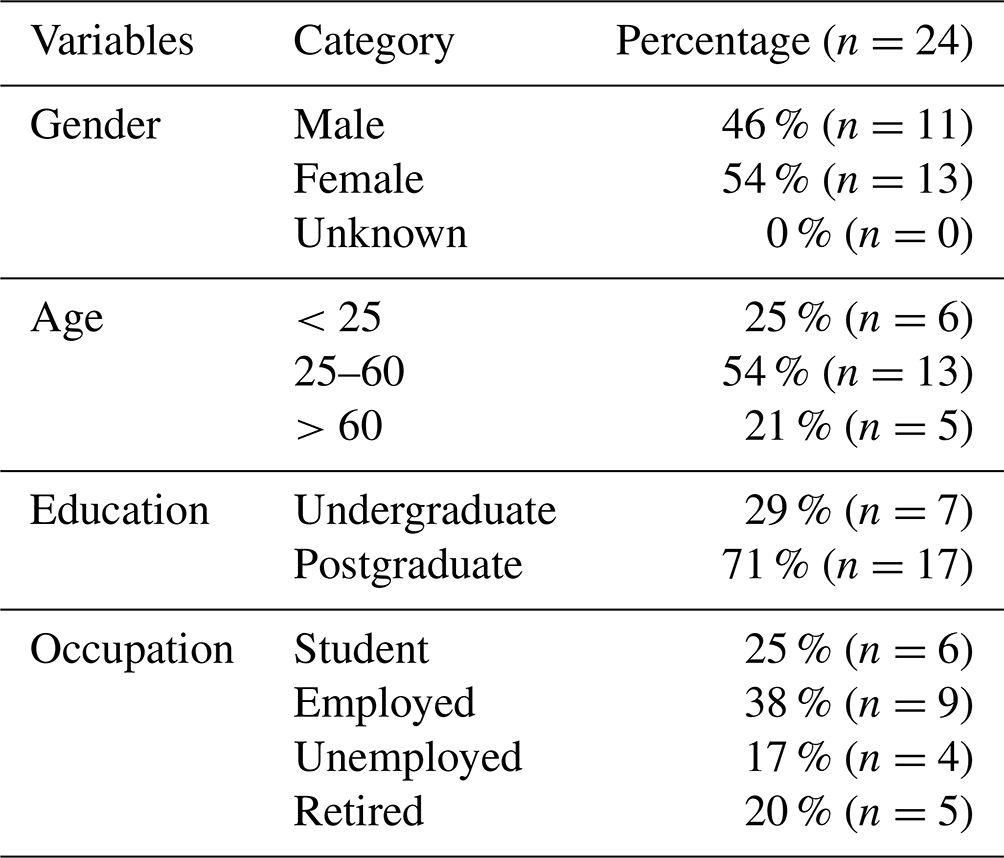
Three air pollution walks were conducted thrice, with a total of 24 participants altogether. The participants came from different socio-economic and educational backgrounds summarized in Table 1. The age range of the participants was from 18 to 68 (all the participants were adults, and minors were accompanied by their parents). Among the participants, there were students, government and private employees, homemakers, and retired professionals. Pre- and post-walk surveys were conducted among the participants. The immediate post-walk interview was conducted to understand whether this improved their understanding of air pollution and whether they preferred this format (pollution walk) over audio-visual presentation-based sensitization. Follow-up interviews were conducted 1 year after the walk to understand how the learning impacted their understanding of air pollution and whether the takeaway messages were integrated into their lifestyle or not.
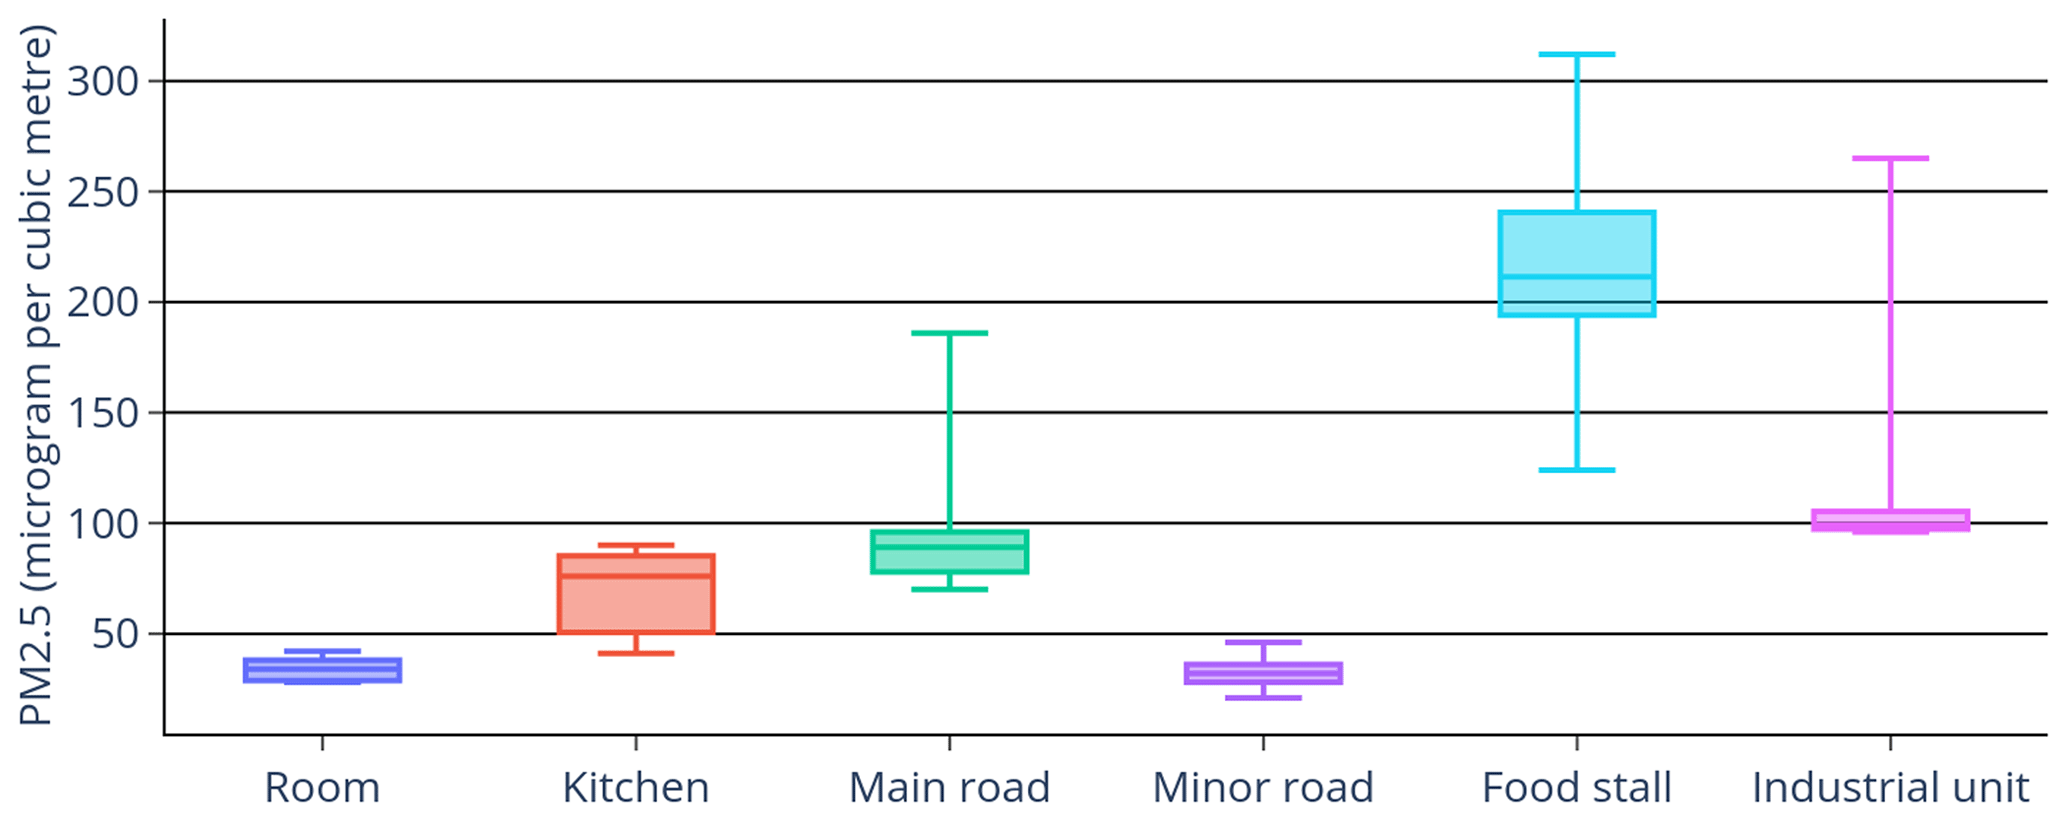
Figure 2Box plot depicting the PM2.5 concentration profile in different micro-environments during the pollution walk.
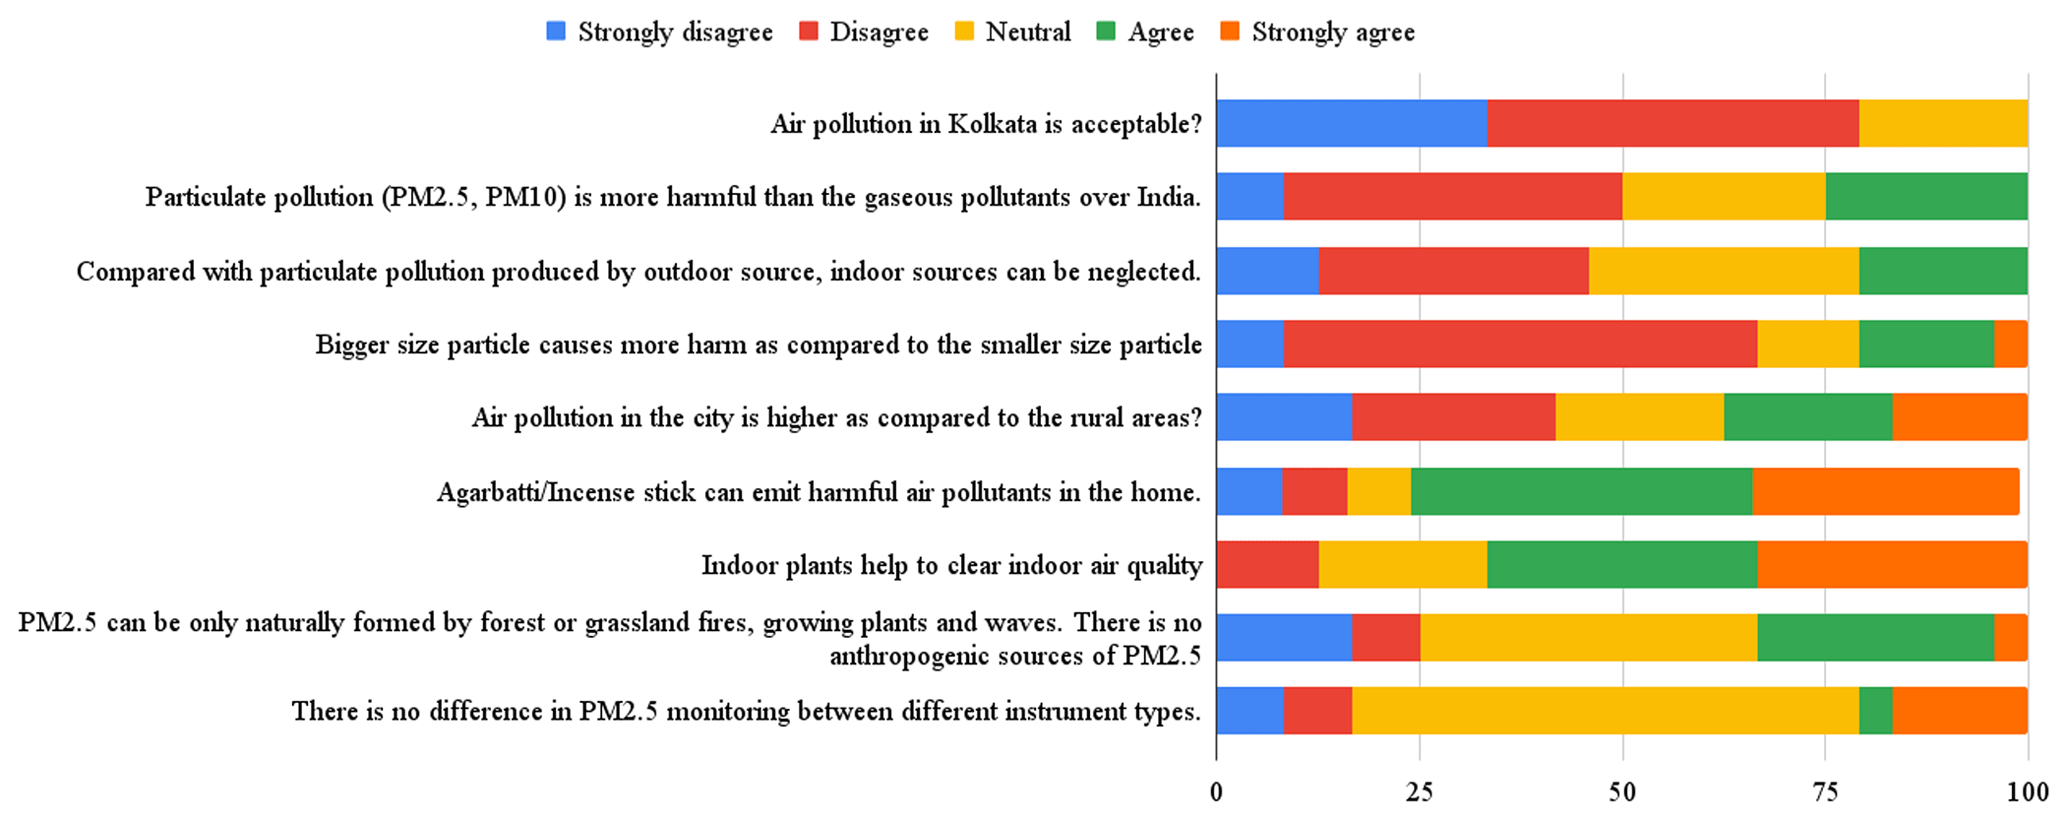
The entire questionnaire from the interviews is presented in Fig. 3.
3.1 Distribution of PM2.5
Participants measured PM2.5 concentrations in different micro-environments during the pollution walk (Fig. 2). The average PM2.5 concentration was found to be 85±66 µg m−3, which is approximately 17 times higher as compared to World Health Organization (WHO) standards (https://www.who.int/tools/air-quality-standards, last access: 22 June 2023). Higher PM2.5 concentrations were observed in the kitchen (70±19 µg m−3) as compared to the room (34±5 µg m−3). The pollution level dropped after the participants began the outdoor walk, due to the increased ventilation. As the participants started walking toward the main road, gradual increases in the pollutant concentration were observed. The highest outdoor concentration was observed when the participants stopped at a busy traffic intersection. As the signal turned green, vehicles started their engines and the participants measured the PM2.5 concentration (186 µg m−3). The average concentration of PM2.5 on the main road was found to be 98±31 µg m−3. An exponential fall in the PM2.5 concentration was observed when the participants entered the minor roads with lower traffic density. The participants also measured the pollutant concentration near the roadside food stalls, where biomass was used as a fuel source. The smoke from the food stall was clearly visible, and the participants measured 214±51 µg m−3 1 m from the oven. Concentrations near a small workshop near the streets that uses a smelter were found to be 121±53 µg m−3. When coming back, the participants also measured these points to re-check the concentration, and it was found to be comparable. During the walk, pollutants were monitored during windy periods where substantial reductions in concentration were observed.
3.2 Participant perception of air quality from the pre-walk and post-walk times
The pre-walk and post-walk surveys were conducted to understand the improvement of a participant's knowledge of air pollution, sources and impacts (Fig. 3). Some questions are very basic and should be answerable by people who regularly read news reports on air pollution. Other questions are more advanced and require more in-depth understanding to answer. Not all participants know about the deteriorating air quality over Kolkata or that smaller-sized particles are more harmful as compared to larger-sized particles. Half of the participants still considered gaseous pollutants to be the major air pollutants in the atmosphere. It was also found that participants have a basic knowledge of indoor pollution, and a significant proportion identified incense sticks as harmful air pollutant sources and also supported the statement that indoor pollution is a significant source of particulate matter pollution. It was evident that most of the participants did not have a specific idea regarding air pollution sources or monitoring overall.
The post-walk survey was conducted just after the walk and before the discussion. A significant improvement in air quality knowledge can be observed (Fig. 3). Specifically, answers to the specific questions on how the smaller-sized particulate matter has an impact on health and sources have improved. Participant knowledge on indoor air pollution has also marginally increased. Overall knowledge on air pollution has improved, and the answers to the questions post-walk have shifted more towards the extreme (strongly agree and strongly disagree), which indicates that the participants are now confident regarding their understanding of air pollution as well. We raised the question during the post-walk meeting about their preference regarding the mode of the learning exercise. The participants clearly mentioned that the pollution walk is definitely better as compared to conventional PowerPoint presentations.
3.3 Long-term participant sensitization and behavioural change
At each point of the walk, the participants measured the PM2.5 concentration and, after that, they were briefed on the possible reason for such an observation. The native language, Bengali, was used as the communication medium. The observation, related concept introduction and adaptation procedures are summarized in Table 2.
Table 2Different concept introductions to air pollution during the pollution walk.
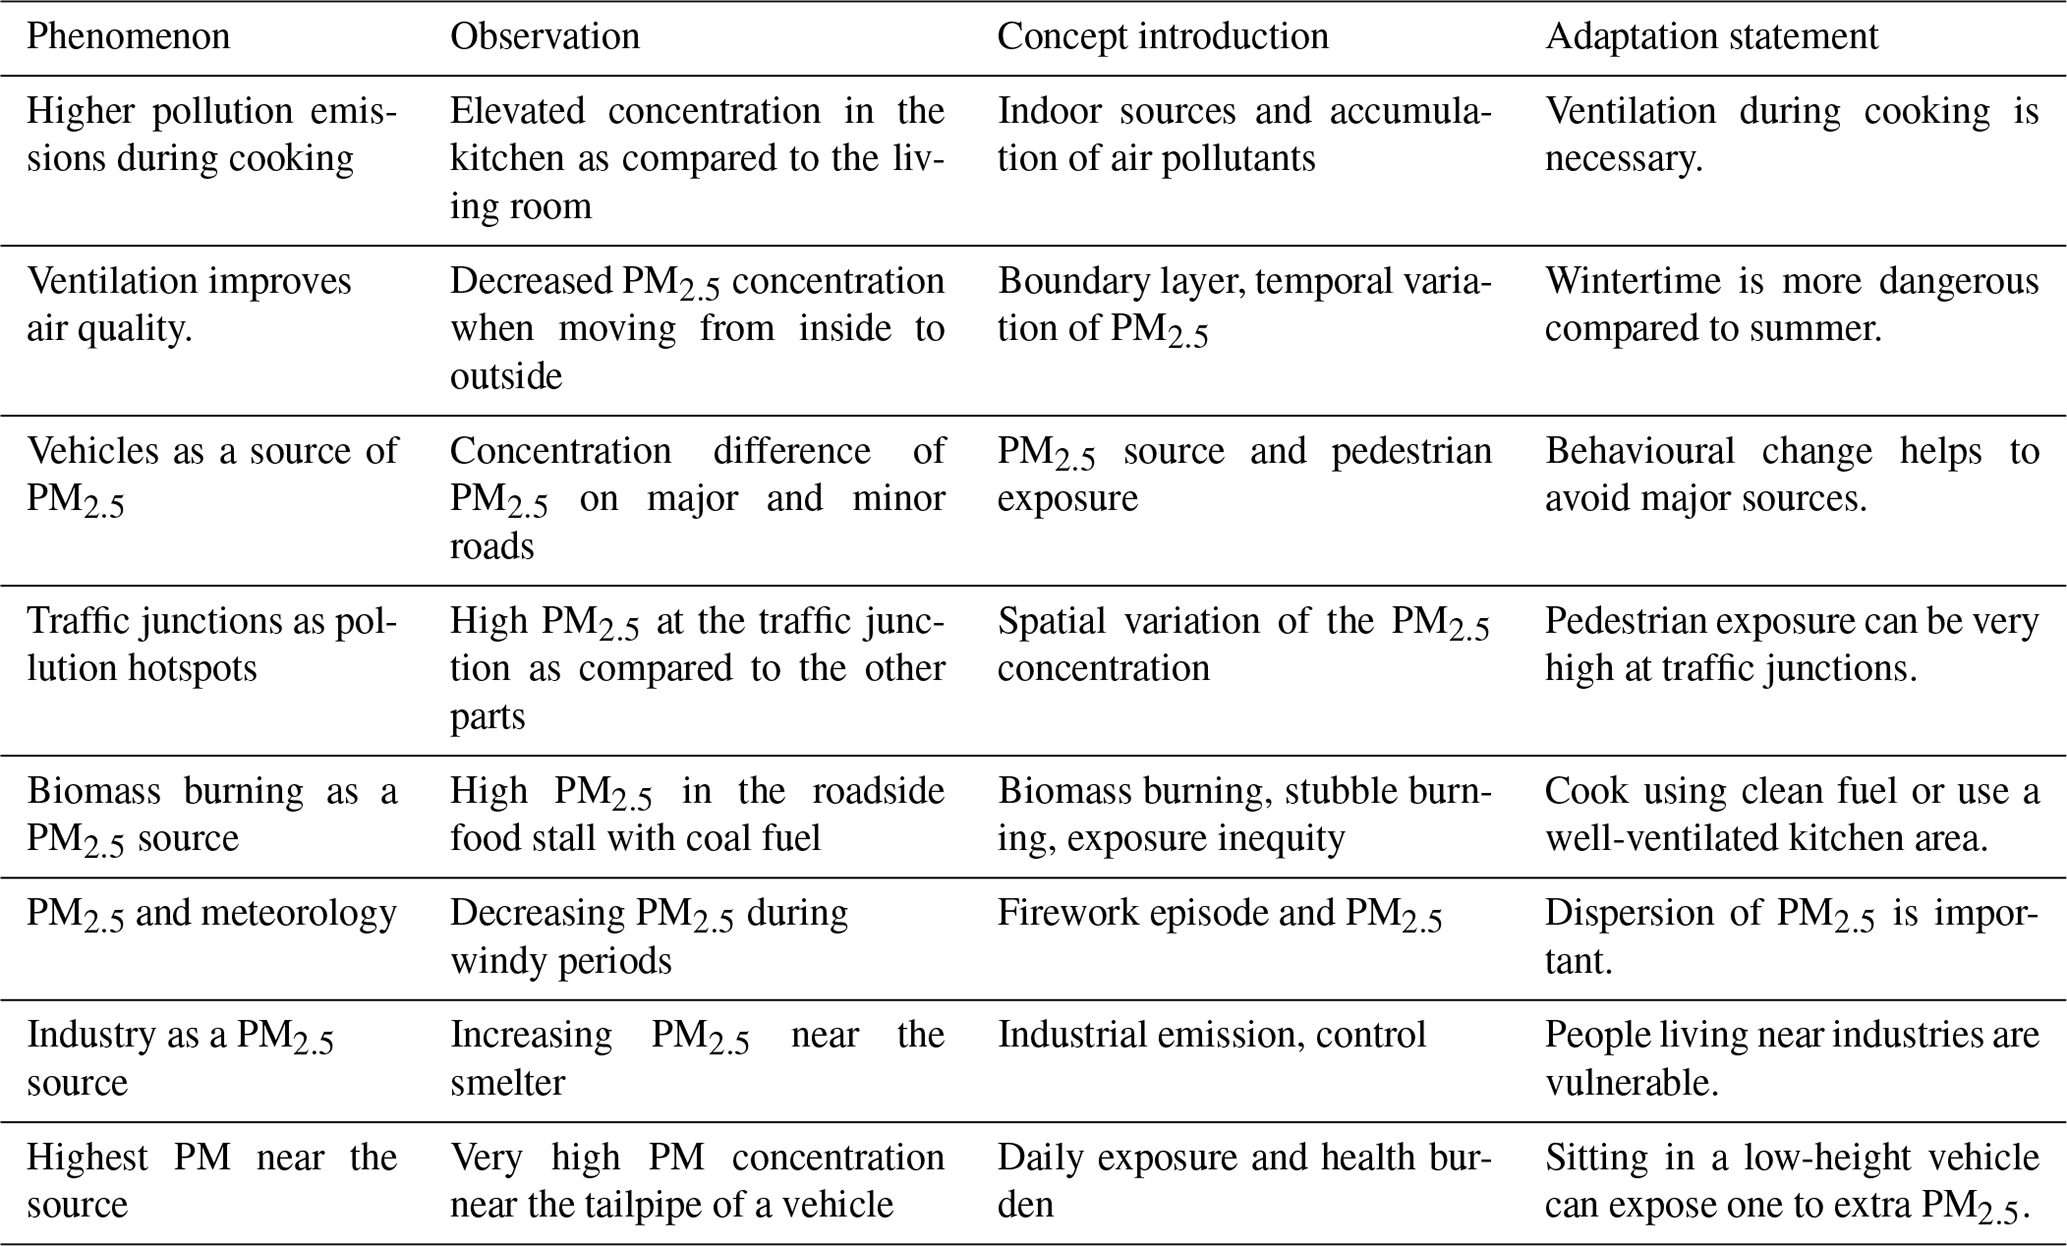
The walk began in a room where participants measured the concentration in the living room and in the kitchen. The higher concentration in the kitchen was explained by the emission of air pollutants during the different cooking procedures like frying or toasting. The impact of ventilation was also shown through measurement of PM2.5 while opening and closing the window. This was surprising to the participants, as even after using clean cooking fuel (liquefied petroleum gas – LPG) the concentration of PM2.5 was found to be twice as high compared to the room. Here we elaborated on the emission of PM2.5 in the different cooking procedures (Chafe et al., 2014; Shupler et al., 2018), and the participants were advised to use an induction cooking top or LPG if possible, install a kitchen chimney, and keep the doors and window of the kitchen open during the cooking procedure.
During our survey carried out 1 year after the experience, we realized that 83 % of the participants had remembered to keep windows open while cooking; 17 % of the participants had made their cooking procedure electrical. Moreover, 4 % of them had even installed a kitchen chimney. These changes in behaviour indicate that these participants were aware of the harmful effects of indoor air pollution due to cooking as a result of the previous event and had tried to modify their lifestyles accordingly. During the discussion, the participants mentioned that they were intrigued by how ventilation can reduce the pollution in a room, and they had remembered this during the cooking procedure. They also mentioned passing the information on to several near and dear ones and asking them to do the same.
The participants moved out of the building and found that the concentration of PM2.5 went down significantly. Here, the participants explained how ventilation improved the air quality (Becker et al., 2007; Vassella et al., 2021). We introduced the concept of the boundary layer at this point to the participants. The accumulation of pollutants inside a room with a certain height and, on the outside, the concentration, is low due to the larger mixing place. “Winter high and summer low” for the pollutants and the role of the atmospheric boundary layer were explained to the participants. This example was quickly grasped by the participants, and they instantly related this to high pollutant concentrations and haze during winter.
The participants further went on to measure the concentrations on the minor and major roads. The concentration difference between the two road types was explained by the number of vehicles and the types of vehicles. The vehicle fleet on the major roads comprises cars, bikes, autos and buses, whereas only motorbikes and very few cars were observed on the minor roads. Exponential decay in the pollutant concentration was observed when the participants moved away from the main road. This helped the participants to understand the impact of PM2.5 on the houses located on the main street. The participants were sensitized to the extent of pedestrian exposure on the main road. The participants were also advised to keep this in mind when getting a new home. In addition, the participants were advised to use masks while travelling in low-height vehicles such as autos due to the proximity of the tailpipe to other vehicles.
Participants were introduced to the concept of biomass burning and its role in pollutant accumulation while measuring air quality near the food stall (Milà et al., 2018; Xu et al., 2020). A very high concentration was observed as the smoke was coming from the cooking and burning of wood fuel. Here, we briefly introduced the participants to stubble burning and its role in the formation of haze in rural parts of India. Concepts related to industrial emission were introduced near the smelter. The participants were also sensitized to the inequity of air pollution exposure during the measurement near the smelter and the food stall. How poor people are more vulnerable to air pollution was introduced. During the walk, windy periods coincided with decreasing PM2.5 concentrations. Here the role of wind and overall ventilation in the reduction of PM2.5 concentrations was clarified again to the participants. The role of low wind speed during wintertime and how air pollutants accumulate during the Diwali festival were explained to the participants. Adaptation statements included how to improve cross-circulation and ventilation at home. After the walk, the participants were taken to the starting point, where a focus group discussion was conducted to evaluate their perceptions.
During the 1 year after the pollution-walk discussion, the participants reported taking extra precautions during travel in autos or low-height vehicles: 33 % of the participants reported shifting their walk time from winter mornings, and 21 % of the participants mentioned that they had changed their habit of igniting candlesticks inside closed rooms. All the participants mentioned that they had discussed air pollution issues in the last year with multiple people and kept track of air quality regularly through apps.
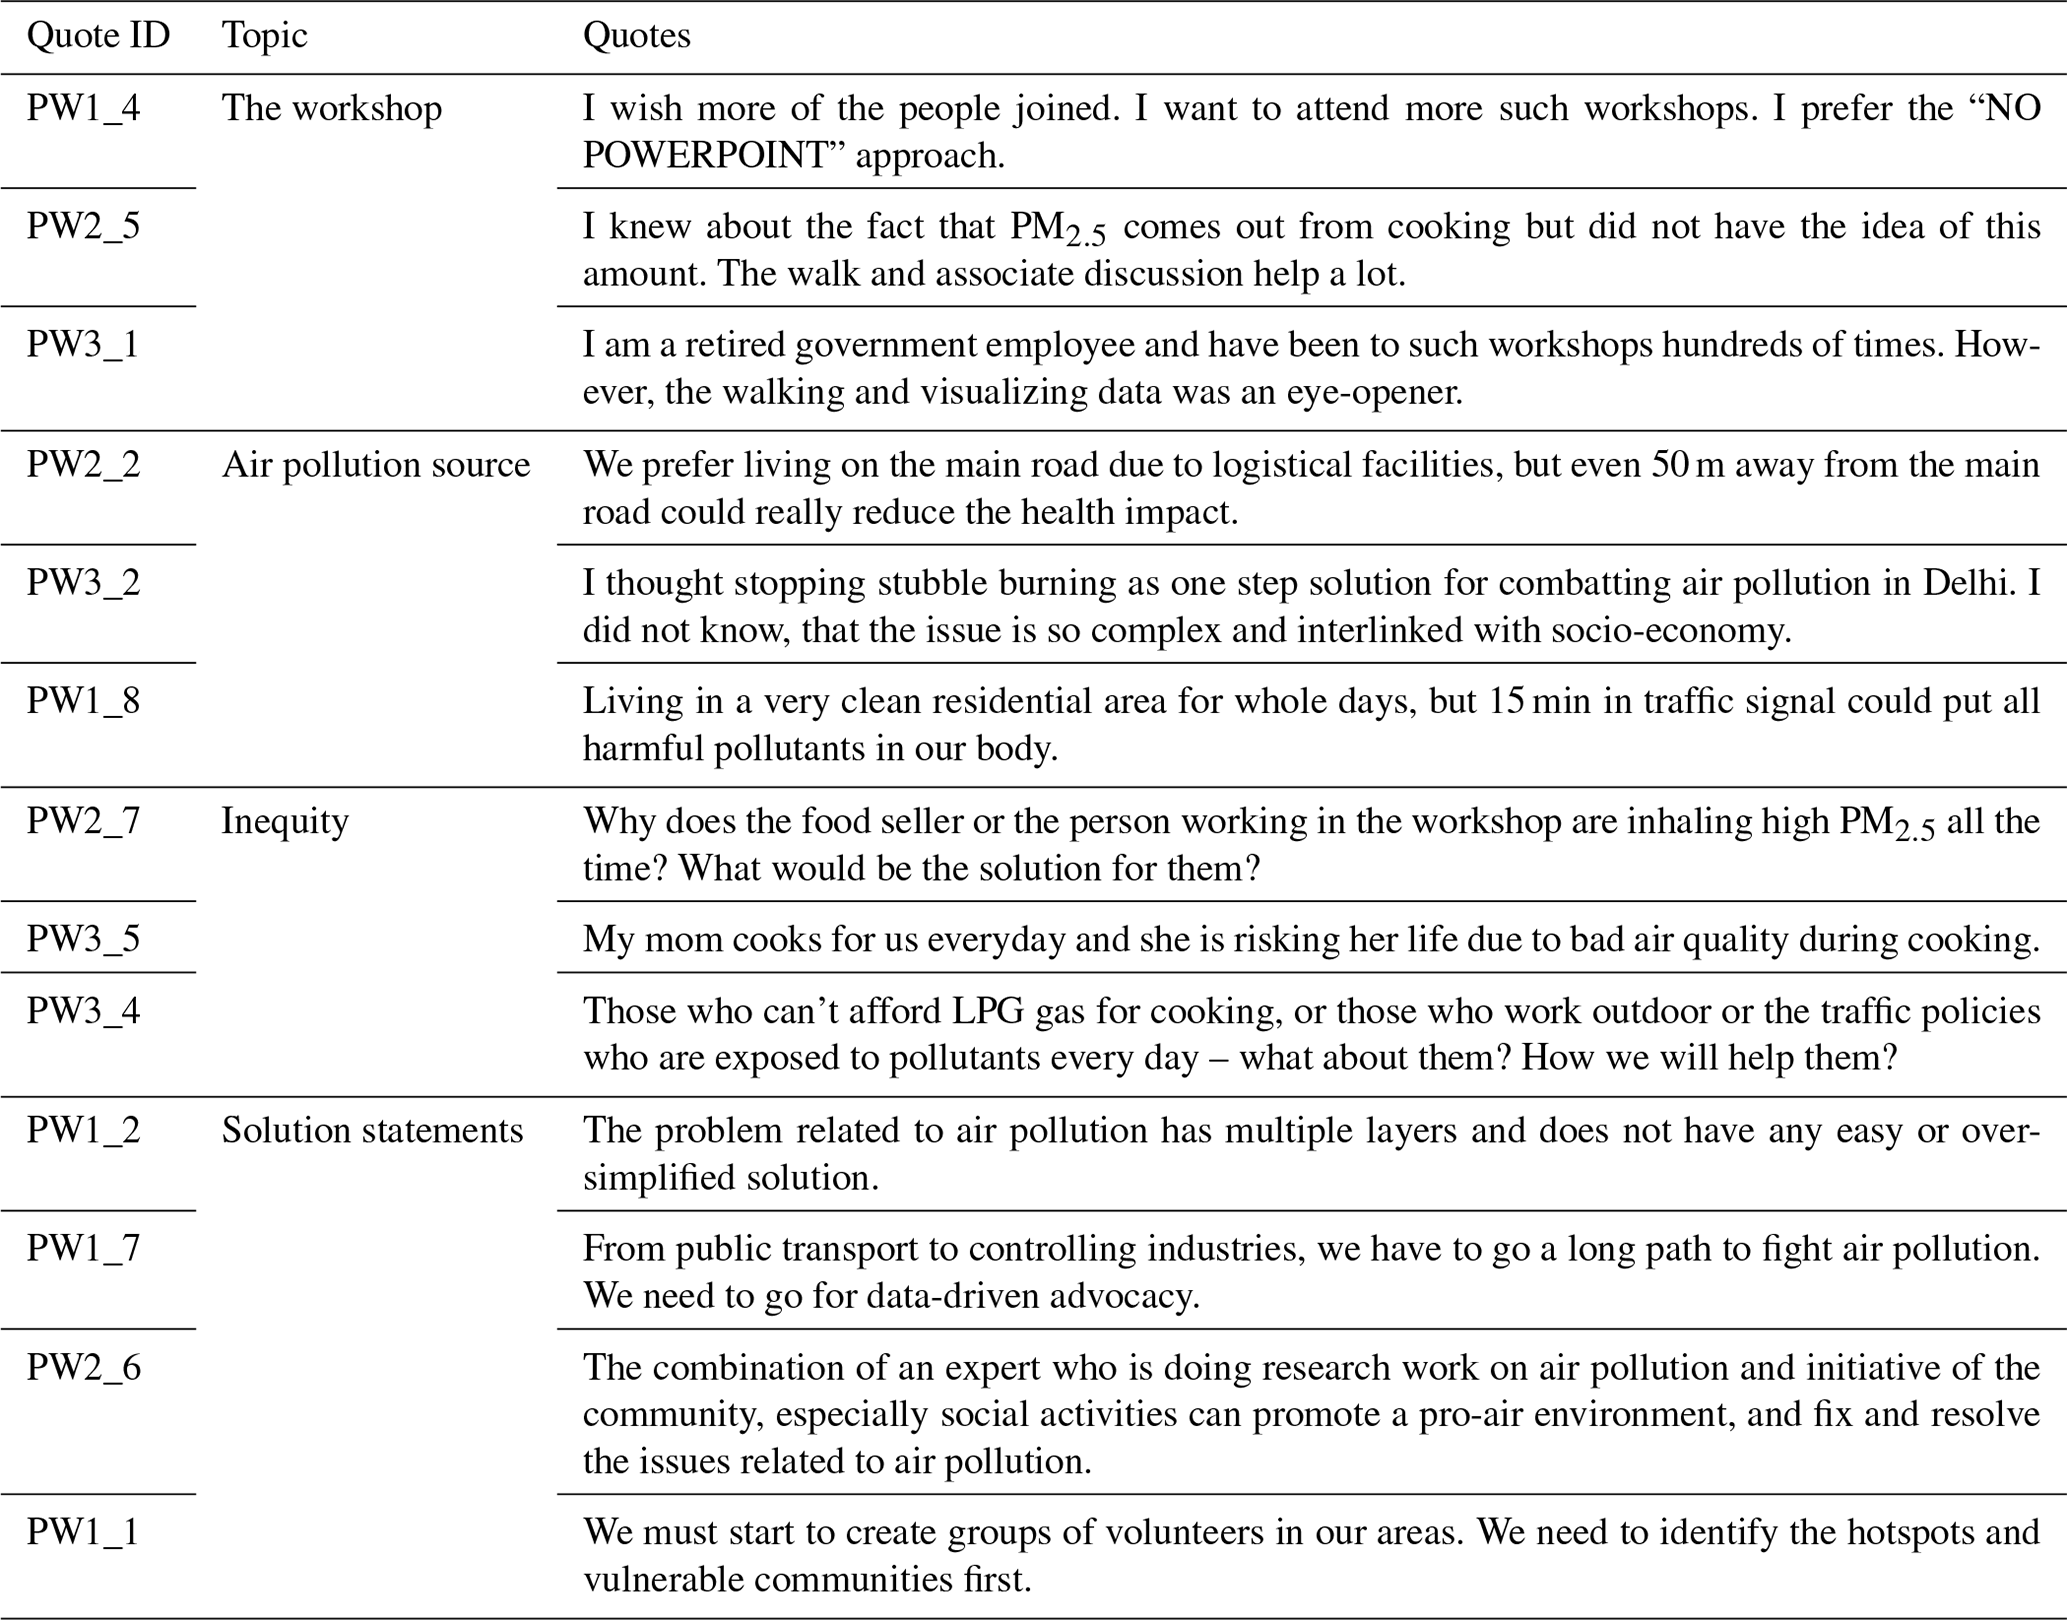
Different approaches were taken to improve sensitization to air pollution. In this study, we took a very different approach where a walk is organized with a group of citizens with live air quality monitors and where several complex concepts of air quality are explained to them. The live data help participants to grasp complex problems easily. One participant was quoted during the post-walk group discussion:
I did not understand the complex nature of air pollution and its control strategy before the walk. Also, the walk shows me how different people are exposed to the air pollution level differently.
The perception of the participants after the pollution walk changed from an over-simplified solution of “planting trees” before the walk to “data-driven advocacy” after the walk (Table 3). The participants raised questions about inequities in pollution exposure as economically deprived communities unable to use clean cooking fuel are exposed to massive amounts of air pollutants. “Those who can't afford LPG or air purifiers, how they will survive this massive air pollution?” asked one participant. The differential impact of socio-economic status and air quality exposure was identified by the participants, and this can be considered one of the major impacts of the pollution walk. Here the participants could visualize the enormous amounts of pollutants inhaled by outdoor workers, food vendors or factory workers who are compelled to work with such high air pollution levels. This changes their perception, which becomes more analytical and helps them understand the complex nature of the problem. They clearly identified the changes in their opinion as they spoke during the post-walk interview, where they mentioned “community initiative”, “data-driven advocacy” and “social activity” as solution statements (Table 3).
All the participants named the pollution walk as a better way of understanding air pollution as compared to an audio-visual presentation. We asked the participants to rate how the walk with the sensor helped with their overall understanding of air pollution levels: 96 % of the participants replied that the process was highly innovative and helped them to understand the complex nature of the air pollution problem in a much better way. Impact sensitization has always been an open problem in the fields of the environment and sustainability (Okaka, 2010; Syaharuddin et al., 2020). The pollution walk could be a better alternative compared to organizing a seminar or a workshop on educating citizens about air quality. Our survey 1 year after the pollution walk among the participants clearly indicates that the pollution walk is associated with long-term learning and behavioural changes among the participants. It takes a lot less time and far fewer logistics and engages citizens in a much better way. The pollution walk is an ideal teaching method for small groups (8–10 participants) of individuals with diverse backgrounds. As air quality has been getting worse, such a technique could prove very useful and robust in the resource-limited global south.
Data generated during the study are presented in the paper. Raw data are available on request to the corresponding author.
The supplement related to this article is available online at: https://doi.org/10.5194/gc-7-151-2024-supplement.
DB alone designed and calibrated the low-cost sensors used in the pollution walk. SSG helped with implementing the walking programme and provided all the logistical support. All four authors helped with analysing the data. AR conceived the idea and designed the implementation plans, conducted the interviews, and wrote the first draft of the manuscript. DB and SH helped with the manuscript writing, corrections and editing.
The contact author has declared that none of the authors has any competing interests.
For the pollution walk event, we collected signed consent forms from each participant regarding their willing participation. The survey and group discussion were conducted following the ethical guidelines of the associated non-profit organization (The Climate Thinker).
Publisher's note: Copernicus Publications remains neutral with regard to jurisdictional claims made in the text, published maps, institutional affiliations, or any other geographical representation in this paper. While Copernicus Publications makes every effort to include appropriate place names, the final responsibility lies with the authors.
The authors would like to acknowledge Warrior Moms, a group of mothers fighting against air pollution, for their help and collaboration. Arindam Roy would like to thank the Laboratory of atmospheric processes and their impacts (LAPI), EPFL (Athanasios Nenes and Satoshi Takahama) for hosting him, as well as the Swiss Agency for Development and Cooperation (SDC – Clean Air Project in India) for his fellowship.
This paper was edited by Tiziana Lanza and reviewed by two anonymous referees.
Apte, J. S., Brauer, M., Cohen, A. J., Ezzati, M., and Pope III, C. A.: Ambient PM2.5 reduces global and regional life expectancy, Environ. Sci. Tech. Lett., 5, 546–551, 2018.
Badura, M., Batog, P., Drzeniecka-Osiadacz, A., and Modzel, P.: Evaluation of low-cost sensors for ambient PM2.5 monitoring, J. Sensors, 1, 5096540, 2018.
Balakrishnan, K., Dey, S., Gupta, T., Dhaliwal, R. S., Brauer, M., Cohen, A. J., Stanaway, J. D., Beig, G., Joshi, T. K., Aggarwal, A. N., Sabde, Y., and Dandona, L.: The impact of air pollution on deaths, disease burden, and life expectancy across the states of India: the Global Burden of Disease Study 2017, Lancet Planet. Health, 3, e26–e39, 2019.
Becker, R., Goldberger, I., and Paciuk, M.: Improving energy performance of school buildings while ensuring indoor air quality ventilation, Build. Environ., 42, 3261–3276, 2007.
Bu, X., Xie, Z., Liu, J., Wei, L., Wang, X., Chen, M., and Ren, H.: Global PM2.5-attributable health burden from 1990 to 2017: Estimates from the Global Burden of disease study 2017, Environ. Res., 197, 111123, https://doi.org/10.1016/j.envres.2021.111123, 2021.
Chafe, Z. A., Brauer, M., Klimont, Z., Van Dingenen, R., Mehta, S., Rao, S., Riahi, K., Dentener, F., and Smith, K. R.: Household cooking with solid fuels contributes to ambient PM2.5 air pollution and the burden of disease, Environ. Health Perspect., 122, 1314–1320, 2014.
Christie, B. and Waller, V.: Community learnings through residential composting in apartment buildings, J. Environ. Educ., 50, 97–112, 2019.
Commodore, A., Wilson, S., Muhammad, O., Svendsen, E., and Pearce, J.: Community-based participatory research for the study of air pollution: a review of motivations, approaches, and outcomes, Environ. Monit. Assess., 189, 1–30, 2017.
Dutta, D. and Pal, S. K.: Prediction and assessment of the impact of COVID-19 lockdown on air quality over Kolkata: a deep transfer learning approach, Environ. Monit. Assess., 195, 223, https://doi.org/10.1007/s10661-022-10761-x, 2023.
Feenstra, B., Papapostolou, V., Hasheminassab, S., Zhang, H., Der Boghossian, B., Cocker, D., and Polidori, A.: Performance evaluation of twelve low-cost PM2.5 sensors at an ambient air monitoring site, Atmos. Environ., 216, 116946, https://doi.org/10.1016/j.atmosenv.2019.116946, 2019.
Gabrys, J.: Air walk: Monitoring pollution and experimenting with speculative forms of participation, in: Walking through social research, 145–161, edited by: Bates, C. and Rhys-Taylor, A., Routledge, eBook ISBN 9781315561547, 2017.
Gabrys, J., Pritchard, H., and Barratt, B.: Just good enough data: Figuring data citizenships through air pollution sensing and data stories, Big Data Soc., 3, 2053951716679677, https://doi.org/10.1177/2053951716679677, 2016.
Gargava, P. and Rajagopalan, V.: Source prioritization for urban particulate emission control in India based on an inventory of PM10 and its carbonaceous fraction in six cities, Environ. Dev., 16, 44–53, 2015.
Garip, G., Richardson, M., Tinkler, A., Glover, S., and Rees, A.: Development and implementation of evaluation resources for a green outdoor educational program, J. Environ. Educ., 52, 25–39, 2021.
Ghose, M. K., Paul, R., and Banerjee, R. K.: Assessment of the status of urban air pollution and its impact on human health in the city of Kolkata, Environ. Monit. Assess., 108, 151–167, 2005.
Gurjar, B. R., Ravindra, K., and Nagpure, A. S.: Air pollution trends over Indian megacities and their local-to-global implications, Atmos. Environ., 142, 475–495, 2016.
Guttikunda, S. K. and Goel, R.: Health impacts of particulate pollution in a megacity – Delhi, India, Environ. Dev., 6, 8–20, 2013.
Guttikunda, S. K., Goel, R., and Pant, P.: Nature of air pollution, emission sources, and management in the Indian cities, Atmos. Environ., 95, 501–510, 2014.
Haque, M. S. and Singh, R. B.: Air pollution and human health in Kolkata, India: A case study, Climate, 5, 77, https://doi.org/10.3390/cli5040077, 2017.
Huo, Y. J., Shih, K. T., and Lin, C. J.: The study on Integrating Air Pollution Environmental Education into the Teaching Personal and Social Responsibility Model in Physical Education, In IOP Conference Series: Earth and Environmental Science, November 2020, IOP Publishing, 576, 012006, https://doi.org/10.1088/1755-1315/576/1/012006, 2020.
IQAIR Report: World Air Quality Report 2020, https://www.iqair.com/world-air-quality-report (last access: 28 May 2024), 2020.
Jha, S. K., Kumar, M., Arora, V., Tripathi, S. N., Motghare, V. M., Shingare, A. A., Rajput, K. S., and Kamble, S.: Domain Adaptation-Based Deep Calibration of Low-Cost PM2.5 Sensors, IEEE Sens. J., 21, 25941–25949, 2021.
Lelieveld, J., Evans, J. S., Fnais, M., Giannadaki, D., and Pozzer, A.: The contribution of outdoor air pollution sources to premature mortality on a global scale, Nature, 525, 367–371, 2015.
Liao, X., Tu, H., Maddock, J. E., Fan, S., Lan, G., Wu, Y., Yuan, Z. K., and Lu, Y.: Residents' perception of air quality, pollution sources, and air pollution control in Nanchang, China, Atmos. Pollut. Res., 6, 835–841, 2015.
Milà, C., Salmon, M., Sanchez, M., Ambros, A., Bhogadi, S., Sreekanth, V., Nieuwenhuijsen, M., Kinra, S., Marshall, J. D., and Tonne, C.: When, where, and what? Characterizing personal PM2.5 exposure in periurban India by integrating GPS, wearable camera, and ambient and personal monitoring data, Environ. Sci. Technol., 52, 13481–13490, 2018.
Mor, S., Parihar, P., and Ravindra, K.: Community perception about air pollution, willingness to pay and awareness about health risks in Chandigarh, India, Environ. Chall., 9, 100656, https://doi.org/10.1016/j.envc.2022.100656, 2022.
Nali, C. and Lorenzini, G.: Air quality survey carried out by schoolchildren: an innovative tool for urban planning, Environ. Monit. Assess., 131, 201–210, 2007.
Nieuwenhuijsen, M. J., Donaire-Gonzalez, D., Rivas, I., de Castro, M., Cirach, M., Hoek, G., Seto, E., Jerrett, M., and Sunyer, J.: Variability in and agreement between modeled and personal continuously measured black carbon levels using novel smartphone and sensor technologies, Environ. Sci. Technol., 49, 2977–2982, 2015.
Okaka, W.: Developing regional communications campaigns strategy for environment and natural resources management policy awareness for the East African community, Research journal of environmental and earth sciences, 2, 106–111, 2010.
Persson, K., Andrée, M., and Caiman, C.: Down-to-earth ecological literacy through human and nonhuman encounters in fieldwork, J. Environ. Educ., 53, 99–116, https://doi.org/10.1080/00958964.2022.2046534, 2022.
Selden, T. M. and Song, D.: Environmental quality and development: is there a Kuznets curve for air pollution emissions?, J. Environ. Econ. Manage., 27, 147–162, 1994.
Shupler, M., Godwin, W., Frostad, J., Gustafson, P., Arku, R. E., and Brauer, M.: Global estimation of exposure to fine particulate matter (PM2.5) from household air pollution, Environ. Int., 120, 354–363, 2018.
Snyder, E. G., Watkins, T. H., Solomon, P. A., Thoma, E. D., Williams, R. W., Hagler, G. S., Shelow, D., Hindin, D. A., Kilaru, V. J., and Preuss, P. W.: The changing paradigm of air pollution monitoring, Environ. Sci. Technol., 47, 11369–11377, 2013.
Steinle, S., Reis, S., and Sabel, C. E.: Quantifying human exposure to air pollution – Moving from static monitoring to spatio-temporally resolved personal exposure assessment, Sci. Total Environ., 443, 184–193, 2013.
Syaharuddin, S., Hidayanti, H., and Mutiani, M.: The Role of Waste Banks to Improve Community Environment Awareness, The Innovation of Social Studies Journal, 1, 129–138, 2020.
Szczytko, R., Stevenson, K. T., Peterson, M. N., and Bondell, H.: How combinations of recreational activities predict connection to nature among youth, J. Environ. Educ., 51, 462–476, 2020.
Varaden, D., McKevitt, C., and Barratt, B.: Making the invisible visible: Engaging school children in monitoring air pollution in London, Research for All, 2, 267–288, https://doi.org/10.18546/RFA.02.2.06, 2018.
Varaden, D., Leidland, E., Lim, S., and Barratt, B.: “I am an air quality scientist” – Using citizen science to characterise school children's exposure to air pollution, Environ. Res, 201, 111536, 2021.
Vassella, C. C., Koch, J., Henzi, A., Jordan, A., Waeber, R., Iannaccone, R., and Charrière, R.: From spontaneous to strategic natural window ventilation: Improving indoor air quality in Swiss schools, Int. J. Hyg. Environ. Health, 234, 113746, https://doi.org/10.1016/j.ijheh.2021.113746, 2021.
Veloz, D., Gonzalez, M., Brown, P., Gharibi, H., and Cisneros, R.: Perceptions about air quality of individuals who work outdoors in the San Joaquin Valley, California, Atmos. Pollut. Res., 11, 825–830, 2020.
Wildschut, D.: The need for citizen science in the transition to a sustainable peer-to-peer-society, Futures, 91, 46–52, 2017.
Xu, H., Ta, W., Yang, L., Feng, R., He, K., Shen, Z., Meng, Z., Zhang, N., Li, Y., Zhang, Y., and Lu, J.: Characterizations of PM2.5-bound organic compounds and associated potential cancer risks on cooking emissions from dominated types of commercial restaurants in northwestern China, Chemosphere, 261, 127758, https://doi.org/10.1016/j.chemosphere.2020.127758, 2020.